
International Journal of Cancer Research & Therapy(IJCRT)
ISSN: 2476-2377 | DOI: 10.33140/IJCRT
Impact Factor: 1.3

Research Article - (2024) Volume 9, Issue 2
Technical and Biological Variations in the Purification of Extrachromosomal Circular DNA (eccDNA) and the Finding of More eccDNA in the Plasma of Lung Adenocarcinoma Patients Compared with Healthy Donors
2Department of Biomedicine, Aarhus University, Høegh-Guldbergs Gade 10, 8000 Aarhus, Denmark
3Computational Biology and Systems Biomedicine, Biogipuzkoa Health Research Institute, Calle Doctor Begiristain s/n, 20014 San Sebastian, Spain
4Basque Foundation for Science, IKERBASQUE, Calle María Díaz Harokoa 3, 48013 Bilbao, Spain
5Department of Cell Biology and Histology, Faculty of Medicine and Nursing, University of Basque Country (UPV/ EHU), 48940 Leioa, Spain
6Steno Diabetes Center Aarhus, Aarhus University Hospital, Palle Juul-Jensens Boulevard, 99 indgang G plan 2 G208, 8200 Aarhus, Denmark
7Department of Oncology, Copenhagen University Hospital –Herlev and Gentofte, Borgmester Ib Juuls Vej 11, 2730 Herlev, Denmark
Received Date: Apr 12, 2024 / Accepted Date: May 02, 2024 / Published Date: May 09, 2024
Copyright: ©Ã?©2024 Birgitte Regenberg, et al. This is an open-access article distributed under the terms of the Creative Commons Attribution License, which permits unrestricted use, distribution, and reproduction in any medium, provided the original author and source are credited.
Citation: Zole, E., Hansen, L. B., Hasko, J., Gerovska, D., Regenberg, B., et al. (2024). Technical and Biological Variations in the Purification of Extrachromosomal Circular DNA (eccDNA) and the Finding of More eccDNA in the Plasma of Lung Adenocarcinoma Patients Compared with Healthy Donors. Int J Cancer Res Ther, 9(2), 01-22.
Abstract
Human plasma DNA originates from all tissues and organs, and has a potential to act as a versatile marker for diseases such as cancer, since fragments of cancer-specific alleles can be found circulating in the blood. While linear DNA has been studied intensely as a liquid biomarker, the role of circular circulating DNA in cancer is more unknown due, in part, to a lack of comprehensive testing methods. Our developed method profiles extrachromosomal circular DNA (eccDNA) in plasma, integrating Solid-Phase Reversible Immobilization (SPRI) bead purification, the removal of linear DNA and mitochondrial DNA, and DNA sequencing. As an initial assessment, we tested the method, biological variations, and technical variations using plasma samples from four patients with lung adenocarcinoma and four healthy and physically fit individuals. Despite the small sample group, we observed a significant eccDNA increase in cancer patients in two independent laboratories and that eccDNA covered up to 0.4 % of the genome/mL plasma. We also saw large variations in the eccDNA content between individual samples and technical replicates; however, we found a subset of eccDNA from recurrent genes present in cancer samples but not in every control. In conclusion, our data reflect the large variation found in eccDNA sequence content and show that the variability observed among replicates in eccDNA stems from a biological source and can cause inconclusive findings for biomarkers. This suggests the need to explore other biological markers, such as epigenetic features on eccDNA.
Keywords
Lung Adenocarcinoma, Biomarker, Diagnosis, eccDNA, Liquid Biopsy, eccDNA Purification
Introduction
Until recently, the diagnosis and monitoring of many cancer types have almost exclusively relied on the usage of biopsies, imaging and clinical signs. This is currently changing with an increasing scientific focus on developing safer and less invasive diagnostic approaches for cancer detection and monitoring [1]. One such developing field focuses on liquid biopsies, among which plasma biopsies offer an easily applicable clinical approach, with low invasiveness for patient monitoring through novel biological markers (reviewed in [2]). Plasma contains cell-free DNA (cfDNA), which can serve as a biomarker for multiple diseases and conditions, including cancers (reviewed in [3]). Among cancers, lung cancer has the highest yearly death toll, and despite recent advances in early detection and treatment, the majority of cases are diagnosed at a late stage [4,5]. Previous investigations of linear cfDNA in plasma from patients with cancers such as hepatocellular, colorectal, and lung cancer, have found copy number and size variations in linear cfDNA compared with healthy controls [6,7]. Furthermore, it has been suggested that both the specific sequences, mutations and methylation profiles observed in cfDNA can serve as indicative biomarkers of cancer [8,9]. In line with this, there are already FDA-approved linear cfDNA testing methods for specific alleles (reviewed in [10]), indicating the potential of cfDNA as a tool in disease diagnostics and monitoring.
However, the field of cfDNA is still developing, and cfDNA assays often show insufficient sensitivity and specificity for many cancers, especially for those in the early stages [8,11]. Linear DNA is unstable (T1/2 = 114 min. [12]) and is only found at low concentrations in plasma, causing high variability of cfDNA concentration and content among patients and samples [13–19]. This reduces linear plasma DNA's applicability as a broad cancer marker despite its relevance as a direct indicator of tumor constituents. An alternative potentially interesting cancer biomarker is extrachromosomal circular DNA (eccDNA), which has the potential to contain genetic information similar to that of linear DNA. The circular form of eccDNA is likely to make it more resistant to enzymatic degradation and gives it increased stability in the bloodstream, compared with linear DNA, as there are no free ends for DNA exonucleases to degrade [20,21]. The potential of eccDNA as a diagnostic biomarker has not gone unnoticed by the scientific community, which has tested its potential in relation to the detection of cancer and fetal eccDNA [21,22]. eccDNA is of particular interest as a cancer marker as it has been shown to be associated with both DNA damage and tumor heterogeneity (reviewed in [23-26]). However, the methods used to extract cell-free eccDNA have not been standardized, and the current methods are considered to be time-consuming and lacking sufficient sensitivity [21,26,27]. Methods for eccDNA extraction can also be DNA degrading, which can affect the purification yield of larger eccDNA [27,28]. Since large eccDNA has the potential to contain valuable information, such as whole- or fragments of oncogenes (reviewed in [26]), purification that preserves the circular DNA is important for clinical assessments. eccDNA has previously been extracted from plasma samples of patients with lung cancers [21,29,30]. EccDNA in these studies ranged in size from 100 bp to 400 bp, and 100 bp to 2000 bp [21,29]. Kumar et al. show that two out of four lung cancer patients carry larger circulating circular DNA pre-surgery than post-surgery [21]. Two groups have found an overrepresentation of eccDNA from particular genes in the plasma of adenocarcinoma patients, though there is no overlap between the genes in the two studies [29,30]. While these studies suggest that eccDNA has potential as a marker for lung adenocarcinomas by investigating the variation in eccDNA between both patients and independent samples, they also reveal a need for methods that preserve the eccDNA.
We therefore developed a method for extracting eccDNA from plasma based on Solid-Phase Reversible Immobilization (SPRI) bead purification. It takes advantage of solid-phase reversible immobilization on magnetic beads and enzymatic reactions to remove mitochondrial DNA (mtDNA) and linear chromosomal DNA fragments from plasma samples of variable volumes in the mL range. EccDNA extracted by this method can subsequently be sequenced, mapped, and analyzed, including eccDNA gene profiles generated. We tested our eccDNA purification method by comparing the results of eccDNA extracted from one mL plasma from four controls and four patients with stage IV lung cancer (adenocarcinoma). We performed purification at two different laboratories to see if results were reproducible in laboratories with different experience levels of the technique (Laboratory A was familiar with the method, whereas Laboratory B was not). To further understand the level of biological and technical variance, we measured the variation at different purification steps, from DNA extraction to the synthesis of sequencing libraries. Our study revealed that individuals with stage IV lung cancer could be distinguished from healthy individuals based on the number of eccDNA in their plasma. We also found that the number of circular DNA per sample varied between biological and technical replicates. In addition, the size of purified DNA was much larger than in previous studies. Although circular DNA profiles had little sequence overlap, a subset of circular DNA from genes involved in lung cancer was overrepresented in the individuals with lung cancer. Thus, the SPRI bead purification method appears to be suitable for the purification and application of plasma eccDNA. Still, for specific cancer biomarkers, future studies have to explore additional possible markers like epigenetic or ATAC-seq profiles on eccDNA.
Materials and Methods
Plasma Samples
For the preliminary assessment of the method, we used two distinct groups of plasma samples of 2-6 mL per patient (1 mL per replicate sample) from 4 patients with lung cancer (adenocarcinoma, stage IV) (age 67.5 ±6.2 years, 1 male and 3 females). Samples were well mixed by gentle pipetting, avoiding high-speed centrifugation and vortexing to preserve circular DNA. Samples were obtained from LUCAS Biobank, and a group of 4 healthy and physically fit controls (age 57.5 ± 3.5 years, 1 male and 3 females), obtained from voluntary donors. The cancer patients` blood was collected 11-27 days after the pathology diagnosis. The blood samples were collected before the start of chemotherapy treatment. The blood was collected in EDTA-containing BD Vacutainer tubes (Becton, Dickinson and Company, NJ, USA), from which plasma was separated by centrifugation at 2000 g for 15 min. at room temperature and stored at -80 °C until analysed. All plasma samples were anonymized. One of the cancer plasma samples from laboratory B (B6) failed during ![]() 29 polymerase rolling circle amplification, therefore, B6 was removed from further bioinformatics data analysis though still sequenced and applied as a control for non-
29 polymerase rolling circle amplification, therefore, B6 was removed from further bioinformatics data analysis though still sequenced and applied as a control for non-![]() 29 amplified eccDNA identification.
29 amplified eccDNA identification.
Plasmid and Linear DNA Controls
For quality control and procedure testing, we spiked-in a control mixture consisting of plasmids (50,000 copies of p4339 (5064 bp (base pairs)), 10,000 copies of pBR322 (4361 bp) (New England Biolabs, MA, USA)), and amplified linear DNA fragments from yeast DNA (25,000 copies of linear DNA formed from primers detailed in Table S1 that fit the four yeast genes GNP1, AGP1, ACT1 and BCP1) [31]. All plasmids were maintained in Escherichia coli and purified with a standard plasmid midi-prep kit (NucleoBond® Xtra Midi, MACHEREY-NAGEL, DE).
Circular DNA Extraction by Phenol/Chloroform Method
We employed a conventional phenol/chloroform-based salt precipitation method to extract DNA from six plasma samples, for the purpose of comparison with the SPRI bead purification method applied to another set of six samples. The tested plasma consisted of pooled human plasma from Innovative Research (MI, USA). In short, the phenol/chloroform purification approach was conducted as follows: for each replicate, 1 mL of plasma was used. For internal control, 10 µL of the spike-in mix was used. After spike-in addition, 22 µL of proteinase K (20 mg/mL) (ThermoFisher, MA, USA) was added to each sample (final concentration 400 µg/mL), followed by 64 µL 20% SDS (ThermoFisher, MA, USA). The samples were then incubated for 1 h at 37°C, and heat-denatured at 95-98°C for 5 min. before being incubated on ice for 5 min. The samples were then divided into two tubes of 540 µL sample to which was added 540 µL of phenol/chloroform/isoamyl alcohol (25:24:1, pH=7.9) (ThermoFisher, MA, USA). The samples were gently mixed by inverting the tubes and centrifuged at 13,100 g for 10 min. before the aqueous (top) phase was transferred to a clean 2 mL tube. Glycoblue (ThermoFisher, MA, USA) was added to each aqueous phase (1:300 volume of aqueous phase), followed by 3 M, pH=5.2 sodium acetate (Carl Roth, DE) at 1:10 volume of the aqueous phase, after which 100% ethanol (VWR Chemicals, PA, USA) was added at 2.5x volume of the aqueous phase. Samples were then incubated at -20 °C for 1 h, before being centrifuged for 30 min. 13,100 g at 4 °C, and the supernatant removed. Pellets were washed in 500 µL ice-cold 70% ethanol (VWR Chemicals, PA, USA) and centrifuged for 10 min. 13,100 g at 4 °C. The pellets were dried in upside-down tubes till the ethanol had evaporated, at which point the still moist pellet was resuspended in 25 µL 10 mM Tris-HCl, pH=8 (ThermoFisher, MA, USA) and left to dissolve for 1 h at room temperature. The split sample fragments were then recombined into 50 µL of total DNA for experimental usage. DNA concentrations were measured using Qubit (ThermoFisher, MA, USA) as per manufacturer's instructions.
Circular DNA Extraction by SPRI Bead Purification Method
Each 1 mL plasma sample was transferred into a 5 mL tube, and 10 µL of spike-in mix was added. Furthermore, a 1 mL negative H2O control was prepared for each purification. For each sample we added 50 µL of Proteinase K (>600 U/mL) (ThermoFisher, MA, USA), followed by 20 µl RNase A (7000 units/mL) (Qiagen, NL) and 750 µL of buffer 1 (containing an undisclosed (somewhere between 50-70% (w/w)) amount of Guanidinium Hydrochloride (EMD Millipore, DE) dissolved in ultra-pure H2O, supplemented with Tween 20 (Sigma-Aldrich, MA, USA), EDTA (Carl Roth, DE), and buffered by 10 mM Tris-HCl, pH=8 (ThermoFisher, MA, USA). The samples were then mixed by pipetting >10x till the solution was homogenous. Samples were next incubated for 30 min. at room temperature (15-25 oC). Afterwards, 1464 µL of AMPure XP beads (0.8x volume ratio) (Beckman Coulter, CA, USA) was added to each sample and mixed by pipetting 10x. 1710 µL buffer 2 (containing an undisclosed (between 75-90% (w/w)) guanidinium thiocyanate (Sigma-Aldrich, MA, USA) amount dissolved in isopropanol (Sigma-Aldrich, MA, USA)) was added to each sample which was mixed >10x until a homogenous solution was reached. The samples were then incubated at room temperature for 3 min. before the tubes were placed on a magnetic rack for 7 min. for bead-supernatant separation, after which the supernatant was extracted and discarded. The sample-beads were then washed with 3 mL 75-80% ethanol (VWR Chemicals, PA, USA) and again with 2 mL 75-80% ethanol. The supernatant was removed, and the samples were dried for a couple of minutes (ensuring that the beads were still lightly glossy). The tubes were then taken off the magnet, and the beads resuspended in 30 µL pH=8.0 salt-free elution buffer and mixed by pipetting 10x. The tubes were shortly spun down and incubated for 5 min. at 50 oC, before being placed on the magnet and incubated for two min. 25 µL of the eluate was taken out and transferred to a clean 1.5 mL DNA Lobind tube (Eppendorf, DE) (5 µL of the eluate was left behind). A second elution was then repeated using 25 µL elution buffer and combined with the former elute, leading to a final volume of 50 µL per sample.
To ensure an efficient qPCR, the purified product underwent an additional purification step in which 90 µL of AMPure XP beads (1.8x ration) (Beckman Coulter, CA, USA) was added to each sample, mixed by pipetting 10x and incubated at room temperature for 5 min. The samples were put on a magnetic rack for 3 min., following which the supernatant was discarded. The samples were then washed twice with 200 µL 75-80% ethanol (VWR Chemicals, PA, USA) and dried until the beads were slightly moist. The beads were then resuspended in 30 µL of elution buffer and mixed by pipetting 10x, before being incubated for 5 min. at 50 oC. This was followed by a 2 min. bead separation step on the magnetic rack, after which 25 µL of the eluate was taken out and transferred to a clean new 1.5 mL DNA Lobind tube (Eppendorf, DE) (5 µL were left behind). The elution step was then repeated using 27 µL elution buffer and combined with the other elute for a final sample volume of 52 µL. 12 µL of each sample were transferred to a new PCR tube for DNA concentration measurements using Qubit (ThermoFisher, MA, USA) as per manufacturer's instructions, and qPCR quality control using SYBRTM Green PCR Master Mix (ThermoFisher, MA, USA) as per manufacturer's instructions, targeting p4339 plasmid as an indicator of circular DNA preservation (Table S1, Figure S1A,B).
Enrichment of Circular DNA by Mitochondrial DNA Linearization and Linear DNA Removal
Circular mtDNA was first linearized by adding 12.5 U/µL MssI enzyme (Pmel, 8-bp endonuclease) (ThermoFisher, MA, USA) for 2 h at 37 oC in accordance with the manufacturer`s instructions. Afterwards, the linear DNA was digested using 28.8 U/µL of plasmid-safe ATP-dependent DNase Exonuclease V (ExoV, RecBCD) (New England Biolabs, MA, USA) for 1 h at 37 oC, which was followed by a heat-inactivation step at 70 oC for 30 min. as per manufacturer's instructions. The circles of interest in the sample were then purified through the circle purification step detailed above (section 2.4.) using a 1.8x volume ratio of AMPure XP beads (Beckman Coulter, CA, USA). The efficiency of each sample purification was assessed through a standard qPCR assay using SYBRTM Green PCR Master Mix (ThermoFisher, MA, USA) as per manufacturer's instructions, targeting Cytochrome c oxidase I (MT-CO1) as a control for mtDNA removal, the BCP1 yeast gene containing PCR fragment as an indicator of linear DNA digestion. Circular DNA preservation was assessed through qPCR targeting the p4339 plasmid (Table S1, Figure S1B).
Rolling-circle Amplification of eccDNA for Sequencing
The volume of each sample was reduced by 50% to ~15 µL by evaporation at 55 oC for 1.5 h. The remaining sample was then used as a template for ![]() 29 polymerase reactions (4BBTM TruePrime® RCA Kit) (4basebio, UK), which was used in accordance with the manufacturer's instructions and incubated for 48 h at 30°C. 2.7. EccDNA Sequencing from Plasma Samples Laboratory A performed both the DNA fragmentation and library preparation for all samples. A portion from each
29 polymerase reactions (4BBTM TruePrime® RCA Kit) (4basebio, UK), which was used in accordance with the manufacturer's instructions and incubated for 48 h at 30°C. 2.7. EccDNA Sequencing from Plasma Samples Laboratory A performed both the DNA fragmentation and library preparation for all samples. A portion from each ![]() 29-amplified DNA sample was diluted to 15 ng/µL in 10 mM Tris-HCl, pH=8 (ThermoFisher, MA, USA) for a total volume of 100 µL and sonicated (4 cycles of 20sec/30sec (on/off time)) using a Bioruptor (Pico II, Diagenode, BE). The successful generation of fragments with a mean fragment size of 400 nucleotides was confirmed using a Bioanalyzer as per manufacturer's instructions (Agilent, CA, USA). The libraries were then prepared using NEBNext Ultra II DNA Library Prep Kit for Illumina and NEBNext Multiplex Oligos for Illumina (New England Biolabs, MA, USA) in accordance with the manufacturer's protocol. The library replicate samples were prepared using the same procedure as applied to the original libraries, except only half the volume of reagents and amount of sonicated DNA was used.
29-amplified DNA sample was diluted to 15 ng/µL in 10 mM Tris-HCl, pH=8 (ThermoFisher, MA, USA) for a total volume of 100 µL and sonicated (4 cycles of 20sec/30sec (on/off time)) using a Bioruptor (Pico II, Diagenode, BE). The successful generation of fragments with a mean fragment size of 400 nucleotides was confirmed using a Bioanalyzer as per manufacturer's instructions (Agilent, CA, USA). The libraries were then prepared using NEBNext Ultra II DNA Library Prep Kit for Illumina and NEBNext Multiplex Oligos for Illumina (New England Biolabs, MA, USA) in accordance with the manufacturer's protocol. The library replicate samples were prepared using the same procedure as applied to the original libraries, except only half the volume of reagents and amount of sonicated DNA was used.
Following library preparation, all samples were multiplexed and sequenced on a Novaseq 6000, S2 flow-cell as 2 × 150-nucleotide paired-end reads on two lanes (Rigshospitalet, DK), with an average of 124 million single reads per sample.
Mapping of the eccDNA with Circle-map
The sample sequence reads were mapped to a human reference genome (hg38) to record the origin of chromosomal-derived eccDNA [32]. All steps were performed in accordance with GitHub instructions except for the usage of bwa mem, which was replaced by bwa mem2.
Circle Quality Assessment
Circles were deemed to be of sufficient quality and thereby trusted if they contained at least 1 concordant and 1 split read or 2 split reads while having at least 50% read coverage. Identified circles that did not fulfill these criteria were excluded from further analysis. Each uniquely mapped sequence fragment was counted as one circle. Circle sizes were calculated in bp using the end and start coordinates of the mapped circles.
Statistical Analysis
The primary statistical and bioinformatics analysis was conducted using R-studio (V. 1.4.1106) and Ubuntu (20.04.2 LTS (GNU/Linux 4.4.0-19041-Microsoft x86_64)), which was applied for intersect analysis between circles and the ENSEMBL (Homo_sapiens. GRCh38.105.gtf.gz) genome. R-packages used in our analysis and graphical construction: rmarkdown, plyr, ggplot2, ggrepel, modelr, stringr, tidyr, tibble, tibble, sfsmisc, psych, car, quantreg, splines, tidyverse, tidyselect, writexl, readxl, rlang, dbplyr, dplyr, plotly, ggvenn, VennDiagram, BiocStyle::Biocpkg("plotly"), RIdeogram (V.0.2.2), Bioconductor (V3.16), regioneR (V1.30.0), and pheatmap.
The genetic density and chromosome locations applied for ideogram formations were downloaded via the RIdeogram package from Gencode (version 32): gencode.v32.annotation.gff3.gz. The likelihood of achieving the observed number of eccDNA-overlaps for NFIA, PCDH9, ERBB4, and CTNND2 was assessed relative to randomized overlaps with the genetic regions from the same-sized theoretical eccDNA datasets (using regioneR (V1.30.0)) placed on a masked GR38 genome (BSgenome.Hsapiens.UCSC. hg38.masked (V1.4.5)).
Additional statistical testing: GraphPad Prism version 9.3.1 for Windows was applied for double-sided Student's t-test comparisons. Figures were processed using Adobe Illustrator version 25.2.1.
Results
We have developed a SPRI bead purification method for eccDNA purification from human plasma. We compared our SPRI bead purification against a standard phenol/chloroform and salt precipitation method for the enrichment of eccDNA by using commercially available healthy plasma with spiked-in plasmids (Figure S2). The SPRI bead purification method led to a 35% greater DNA yield compared with the phenol/chloroform approach (p=0.0008, t-test), demonstrating that our method is more efficient than the phenol/chloroform and salt precipitation method.
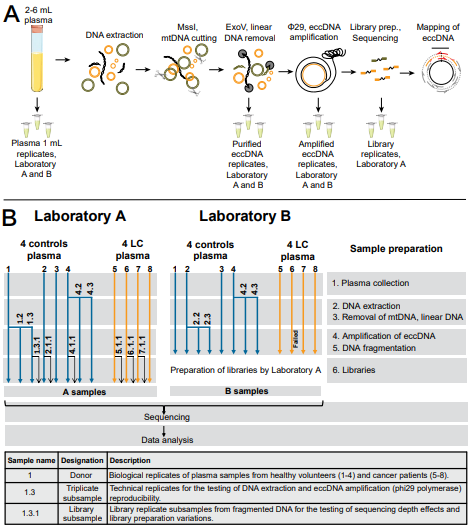
Figure 1: Design of the inter-laboratory comparison experiment. (A, B) At several steps during the workflow, technical replicates were subsampled to test the repeatability of the method. Samples 4, 4.2, 4.3 represent technical triplicates of a plasma sample, 1, 1.2, 1.3 and 2, 2.2, 2.3 represents ![]() 29 amplification replicates. Sample 6 in Laboratory B failed at
29 amplification replicates. Sample 6 in Laboratory B failed at ![]() 29 rolling-circle amplification step. Samples 1.3.1, 2.1.1, 4.1.1, 5.1.1, 6.1.1., and 7.1.1 were library preparation replicates only for Laboratory A samples, to assess divergence between samples of the new extraction method and sequencing. LC, lung cancer (adenocarcinoma); MssI, Pmel enzyme; ExoV, Exonuclease V; eccDNA, extrachromosomal circular DNA.
29 rolling-circle amplification step. Samples 1.3.1, 2.1.1, 4.1.1, 5.1.1, 6.1.1., and 7.1.1 were library preparation replicates only for Laboratory A samples, to assess divergence between samples of the new extraction method and sequencing. LC, lung cancer (adenocarcinoma); MssI, Pmel enzyme; ExoV, Exonuclease V; eccDNA, extrachromosomal circular DNA.
Using SPRI bead purification, we tested the applicability of plasma eccDNA purification. One mL of plasma was analyzed per sample from four patients with stage IV lung cancer and four age-matched control donors, and eccDNA was purified in two independent laboratories (A and B) with replicates at four levels (Figure 1A,B). Following DNA extraction, the total DNA concentration, as well as the successful degradation of both linear DNA and mtDNA, were determined as methodological quality controls (Figure S1). One control plasmid (p4339) was also measured by qPCR to assess the method's purification efficiency and the circular DNA loss during purification. For both laboratories A and B the plasmid was recovered 82.5% and 42.5%, respectively, and linear DNA and mtDNA were removed.
Experimental Reproducibility
To evaluate the biological and technical variation of circular DNA, replicates were prepared in two different laboratories and at different stages of the analytical procedure following eccDNA purification (Figure 1B). The procedure was evaluated on plasma from different individuals within a biological group, replicates from one individual, and technical replicates for the eccDNA purifications. As we are focusing on developing a new methodology, library preparation and sequencing was exclusively conducted in one laboratory to avoid the introduction of any potential procedural variations. For each group and replicate, we compared the differences in eccDNA count and size (Table 1). We observed a high variance in eccDNA counts and sizes among all the samples from laboratories A and B, excluding library duplicates.
Standard deviation (SD) for eccDNA counts were between 53% for controls (all the control A and B samples) and 43% for lung cancer samples (all the lung cancer A and B samples). SD for mean eccDNA size, excluding library duplicates, was 40% for controls (all the control A and B samples) and 29% for lung cancer samples (all the lung cancer A and B samples). This variation was as expected since the eccDNA counts varied markedly within the biological groups (SD for eccDNA counts were between 42% and 51% for controls (A1-A4 and B1-B4, respectively), and 35% and 52% for lung cancer (A5-A8 and B5-B8, respectively)). Also, a large SD was observed for the mean eccDNA size which was 26% and 27% for controls (A1-A4 and B1-B4, respectively) and 27% and 82% for lung cancer (A5-A8 and B5-B8, respectively).
|
Samples |
Mean circle count |
SD (%) |
Mean circle size, bp |
SD (%) |
Median circle size, bp |
Group |
Variations |
|
All the control A and B samples |
487 |
260 (53) |
3954 |
1570 (40) |
2212 |
Controls |
Between laboratories |
|
All the lung cancer A and B samples |
2056 |
881 (43) |
2722 |
793 (29) |
1582 |
Lung cancer |
Between laboratories |
|
A1 - A4 |
625 |
320 (51) |
3499 |
914 (26) |
1941 |
Controls |
Within individuals in a biological group |
|
B1 - B4 |
402 |
168 (42) |
5277 |
1438 (27) |
3040 |
Controls |
|
|
A5 - A8 |
2278 |
787 (35) |
2530 |
678 (27) |
1562 |
Lung cancer |
|
|
B5 - B8 |
1813 |
949 (52) |
5610 |
4621 (82) |
4123 |
Lung cancer |
|
|
A4, A4.2, A4.3 |
583 |
200 (34) |
4098 |
538 (13) |
2261 |
Controls |
Within the same individual in each laboratory, triplicates |
|
B4, B4.2, B4.3 |
537 |
121 (22) |
4949 |
1485 (30) |
2886 |
Controls |
|
|
A1, A1.2, A1.3 |
541 |
115 (21) |
1912 |
258 (14) |
1136 |
Controls |
Within the same eccDNA purification, triplicates |
|
B2, B2.2, B2.3 |
246 |
28.3 (11) |
3652 |
196 (5) |
1769 |
Controls |
|
|
A1.3, A1.3.1 |
628 |
40 (6.3) |
1772 |
54 (3.1) |
1076 |
Controls |
Within the same library preparation |
|
A2, A2.1.1 |
365 |
5 (1.2) |
4098 |
49 (1.2) |
2318 |
Controls |
Within the same library preparation |
|
A4, A4.1.1 |
803 |
49 (6.1) |
3593 |
77 (2.1) |
1998 |
Controls |
Within the same library preparation |
|
A5, A5.1.1 |
3117 |
256 (8.2) |
2195 |
111 (5) |
1385 |
Controls |
Within the same library preparation |
|
A6, A6.1.1 |
2516 |
30 (1.2) |
3512 |
12 (0.3) |
2193 |
Controls |
Within the same library preparation |
|
A7, A7.1.1 |
1636 |
122 (7.4) |
1806 |
68 (3.8) |
1286 |
Controls |
Within the same library preparation |
SD - standard deviation, bp – base pairs
Table 1: Variations of circle count and size among samples and between laboratories.
Variation between individuals in a biological group was larger than between triplicate samples (Table 1). Triplicates of the same samples from the control group eccDNA count SD of 34% and 22% (A4, A4.2, A4.3 and B4, B4.2, B4.3, respectively), and eccDNA size SD of 13% and 30% (A4, A4.2, A4.3 and B4, B4.2, B4.3, respectively). The SD were the smallest for triplicates within the same purification, eccDNA count SD of 21% and 11%, and the eccDNA size SD of 14% and 5% (A1, A1.2, A1.3 and B2, B2.2, B2.3, respectively).
We also made duplicates during library preparations to test the variance within the same library preparation (Table 1, Figure 2).
When comparing the eccDNA counts for samples sequenced from the same library preparation, we found little variation in eccDNA counts and size. For controls, SD of eccDNA count was 6.3% (A1.3 and A1.3.1), 1.2% (A2 and A2.1.1), and 6.1% (A4 and A4.1.1), for lung cancer SD was 8.2% (A5 and A5.1.1), 1.2% (A6 and A6.1.1), and 7.4% (A7 and A7.1.1). The size of eccDNA among the library triplicates again showed little variation when compared between the original samples and their corresponding library replicates. The SD for controls was 3.1% (A1.3 and A1.3.1), 1.2% (A2 and A2.1.1), and 2.1% (A4 and A4.1.1), for lung cancer samples, SD was 5% (A5 and A5.1.1), 0.3% (A6 and A6.1.1), and 3.8% (A7 and A7.1.1).
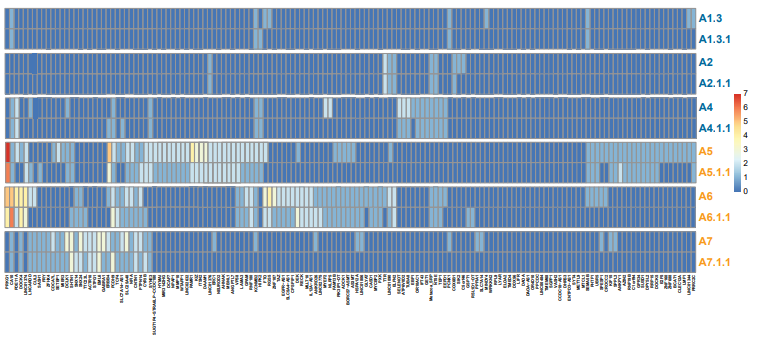
Figure 2: Heat map of the library duplicates. Reproducibility for 150 significantly overrepresented gene segments (>95 percentile quantile regression analysis) among all identified eccDNA relative to the genetic length. Controls n=3, cancers n=3. Blue letters, controls; orange letters, lung cancer samples.
Thus, though we found a large variation in the DNA sequence of eccDNA between individual samples, we were, to a large extent, able to reproduce the size distribution and the number of uniquely identified eccDNA among biological and technical replicates. On the other hand, we found large variations in the number and size of eccDNA detected in different laboratories, suggesting a need to formalize the protocol to reduce the variation.
Plasma from Patients with Lung Cancer Contains more eccDNA than Healthy Controls
Next, we analyzed the purified eccDNA in all samples obtained from both laboratories. We observed a significant difference in the mean unique eccDNA count between control (487 circles) and lung cancer (2056 circles) samples for both laboratories (Laboratory A: p=0.0175, Laboratory B: p=0.0485) (Figure 3A,B). We did not find any significant difference in the mean eccDNA size between the two groups (range Laboratory A controls 67–109,902 bp and lung cancer 70–79,497 bp, range Laboratory B controls 33–64,091 bp and lung cancer 29–67,642 bp) (Table S2). As eccDNA may have diagnostic value, we then investigated the relative difference of eccDNA counts for each stage IV lung cancer sample relative to the control population (four age-matched control samples) from the same laboratory. Our Z-score analysis revealed that 3/4 of lung cancer samples from Laboratory A were significantly different (p<0.05) from the control population. When the same samples were tested at Laboratory B; all lung cancer samples (3/3) were significantly (p<0.01) different from the purified control samples (Figure 3C).
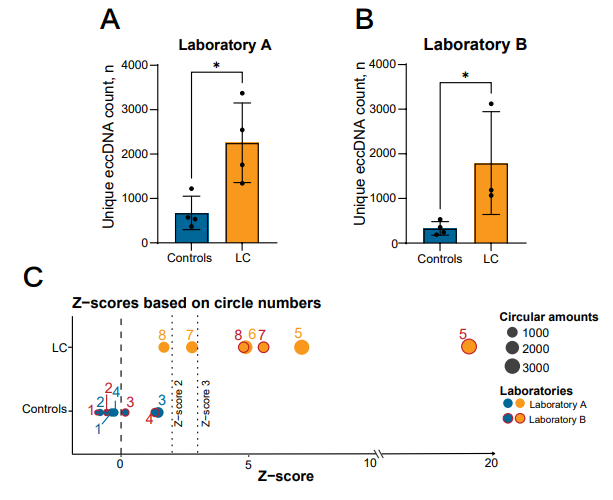
Figure 3: Circle count comparison between the control and lung cancer groups. (A, B) Number of unique eccDNA in the control and lung cancer groups in Laboratory A (controls n=4, cancers n=4) and B (controls n=4, cancers n=3). (C) Graphical presentation of the sample Z-scores relative to the mean control eccDNA counts of each laboratory. The mean of the sample triplicates were used for the Z-score assessments of the control values (counting as one assessment in the overall mean determination). Library duplicates are not included. LC, lung cancer (adenocarcinoma). *, P<0.05 ±=0.05, SD. Dashed lines mark Z-scores of 0, 2 and 3.
EccDNA Population Characterization
An assessment of the investigated eccDNA size distribution revealed a periodic pattern in which the eccDNA sizes peaked at regular intervals of 170-200 bp (Figure 4). This pattern was also observed in plasma from both the control and the lung cancer group for circles containing gene segments (Figure S3).
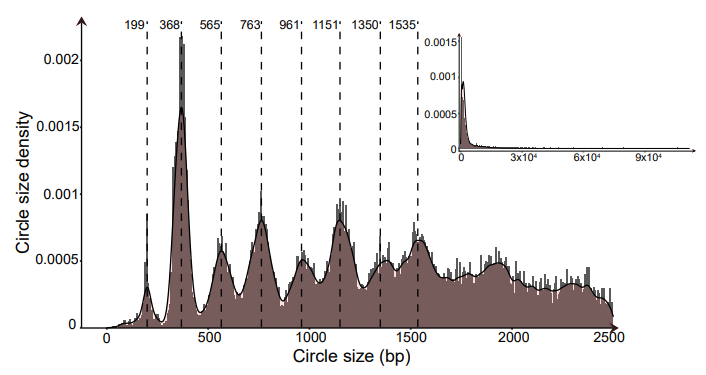
Figure 4: Combined eccDNA size density distributions for all eccDNA identified in this study. Dashed lines highlight peak density tips at 170-200 bp intervals observed in the plotted data. Controls n=8, cancers n=7. bp, base pairs.
It has been published that eccDNA in somatic cells derives from gene-rich chromosomes [33]. To test if this is also the case for eccDNA in plasma, we prepared ideograms of the eccDNA chromosomal distribution side-by-side with chromosomal gene density. We found that plasma eccDNA did not primarily originate from gene-rich chromosomes (such as chromosomes 17 and 19) but came from all parts of the genome (both healthy and lung cancer groups) (Figure 5A,B). We also assessed the relative eccDNA distribution per Mbp against the genetic density per Mbp for each chromosome (Figure 5C). In addition to having a higher eccDNA count, lung cancer samples were found to have a greater chromosomal variation (1.18 SD (27.07%)) compared with control samples (0.31 SD (24.17%)).
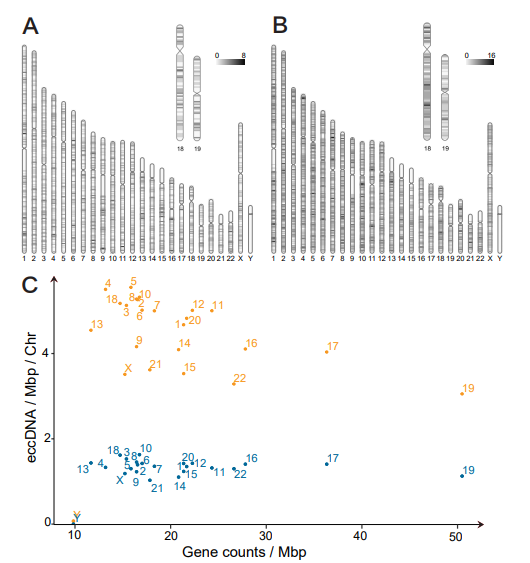
Figure 5: Chromosomal origin of eccDNA in controls and lung cancer patients. Ideograms of the chromosomal eccDNA distribution for mappable and non-mappable regions in one Mbp intervals (A) controls and (B) patients with lung cancer. Numeric range; controls: 0-8, lung cancer samples: 0-16. (C) Graphical overview of the chromosomal eccDNA/Mbp relative to gene counts/Mbp for all control and lung cancer samples. Controls n=8, cancers n=7. Chr, chromosome; Mpb, megabase pairs; blue dots, controls; orange dots, lung cancer samples.
The Genetic Origin of eccDNA
Genome coverage analysis showed that eccDNA purified from 1 mL plasma covered between 0.023-0.137% from healthy and 0.058-0.356% from lung cancer patients, as exemplified in a regional genome plot of eccDNA on chromosome 5 (Figure 6). A large portion of the plasma eccDNA did not contain any full genes or fragments of genes (9493 eccDNA in controls (40.25%) (n=19, including all the replicates and library duplicates) and 21268 in lung cancers (47.25%) (n=10, including all the replicates and library duplicates). The rest of the circles originated from genetic segments, and only a small fraction contained full-length genes (2.69% controls, 1.44% lung cancer), whereas most were found to contain fragments of genes (57.06% controls, 51.31% lung cancer). In general, we observed a low overlap in circles originating from the same genes among lung cancer samples and even less among controls (Figure 7A,B; Table S3). Despite the observed low overlap, the lung cancer genetic overlap was found to be greater than expected by chance (p=0.0099). Four genetic regions were particularly interesting, as fragments from these genes could be found in all cancer samples (NFIA, PCDH9, ERBB4, and CTNND2).
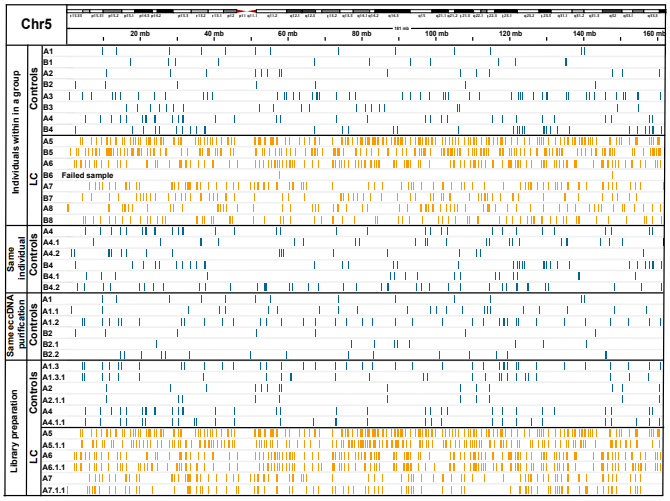
Figure 6: Coverage of eccDNA on Chr5 as an example. EccDNA covers a small fraction of the chromosome. Laboratory A (A1-A8) and B (B1-B8), each line represents a circle. Controls n=8, cancers n=7. LC, lung cancer (adenocarcinoma); blue lines, controls; orange lines, lung cancer samples.
We next assessed which of these genes were overrepresented on eccDNA relative to their lengths. To compensate for how larger genes may have a greater likelihood of generating eccDNA by chance, we conducted a quantitative regression analysis on gene length vs. eccDNA counts with 6 degrees of freedom and determined significant outliers (Figure 7C,D). Our analysis revealed 126 genes that were significantly overrepresented on eccDNA (>95% quantile) in the lung cancer samples. We then compared the sample profiles for these 126 genes on the eccDNA purified from control and lung cancer plasma samples and observed a low representation of these genes in the control samples (13.4x less hits pr. gene compared with lung cancer samples) (Figure 7E; Table S4). Gene ontology analysis of the 126 genes revealed an overrepresentation of genes involved in pathways important for cancer development, with the highest hits being in ontologies related to developmental growth and cell morphogenesis associated with differentiation (Figure S4).
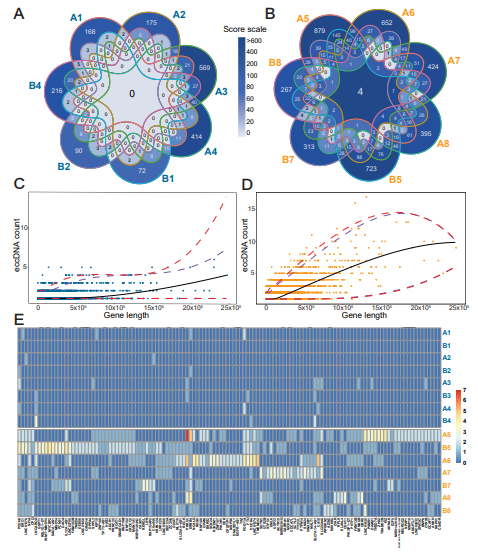
Figure 7: Reoccurring genes in eccDNA and the correlation between gene overlapping eccDNA count and gene length. (A) Gene overlapping eccDNA in controls (n=7) and (B) lung cancer samples (n=7). The formula for calculating the color intensity of frequency for overlapping gene fragments among the samples, Score scale=2 No. of samples in which a fragment was found x No. of common fragments of genes. For example, the center of lung cancer =27x4=512. (C, D) A quantitative regression analysis plot of a gene count found on eccDNA in correlation with the gene length. Blue color, controls; orange color, cancer samples. Purple dashed lines mark 90% significance, red dashed lines mark 95% significance. (E) Heat map of the genes overrepresented on circles identified using quantitative regression analysis (C and D) in controls (top-blue) and cancer samples (bottom-orange) from laboratory A and B. Blue letters, controls; orange letters, lung cancer samples.
Discussion
In this study, we describe an effective method for the purification of eccDNA from plasma. We show that plasma from patients with stage IV lung cancer (adenocarcinoma) contains four times more unique eccDNA than healthy individuals, and that this number can be used to distinguish lung cancer patients from healthy controls (7/8 measures). As such, a large proportion of the unique eccDNA found in plasma from patients with stage IV lung cancer is, therefore, likely to be circulating tumor DNA (ctDNA). Through eccDNA sequence analysis, we observed that eccDNA originated from across the mappable parts of the genome. Notably, some gene regions were found to generate significantly more eccDNA compared with other regions. The eccDNA sequence analysis also reveals that eccDNA identified in one mL plasma covers less than 0.4% of the human genome, which can explain the large eccDNA sequence variations between samples from the same donor. Despite a significant variance in plasmid recovery between the two laboratories (Figure S1), the trends observed in circle count and genes found in the samples remained consistent.
We tested the biological and technical variation of eccDNA at various levels through comparison of the new SPRI bead purification method in two different laboratories. We observed a large variation in the DNA sequences present on the eccDNA among both samples from the same individual and eccDNA purifications from the same sample (Table S3). This variation is likely caused by the low coverage of the genome due to the low eccDNA content purifiable from the plasma. Our analysis showed that one mL of plasma only contained eccDNA, covering an average of 0.05% (control) and 0.17% (lung cancer) of the total genome (Figure 6). Thus, the replicative variations did not seem to originate from technical variations. The low amount of eccDNA however, can be problematic for the effective detection of eccDNA and might be overcome by larger plasma sample volumes. The observed variations in replication did not appear to stem from the tested methodology either, as it continued to diminish throughout the sampling process, and our library duplicates exhibited minimal variability. High biological variability for unique eccDNA among triplicates of different cell lines has been reported before using SPRI bead purification [34]. As such, we consider the SPRI bead purification method to be reliable and reproducible.
Circulating eccDNA carries the potential as a ctDNA biomarker that can be used to complement studies of linear ctDNA. The amount of linear circulating cfDNA in the plasma of cancer patients and healthy individuals is low, and cell-free tumor DNA often represents only a small fraction of it [35,36]. Though it is well established that linear cfDNA in plasma can be used to distinguish between healthy controls and individuals for several types of cancer, including different types of lung cancer [37â??39], plasma eccDNA may provide an alternative and more stable biomarker for cancer detection. Cell-free eccDNA has only recently been identified and differentiated from linear cell-free DNA in the scientific community (rewieved in [26]). It could, therefore, potentially be used for early-stage diagnostics when ctDNA in plasma is very low, however, there is still a need for in-depth studies before it can be applied in a clinical setting.
Our results showed that the amount of unique eccDNA is significantly increased in plasma from lung cancer patients (Figure 3), which is similar to what has been observed for circulating linear cfDNA and mentioned, though not further assessed, by Wu et al. for eccDNA in lung cancer patients [30,35,36]. Interestingly, our findings suggest that this increase in eccDNA number can be applied as a potential marker for stage IV lung cancer. We observed no differences in the size of eccDNA between the lung cancer patients and the healthy controls. However, a previous study of plasma from four patients with lung cancer found two patients to carry larger circulating circular DNA pre-surgery than post-surgery [21].
We found that the new SPRI-bead purification method yields larger eccDNA compared to the methods used by Wu et al., Xu et al., and Kumar et al. Circular DNA in the current study stretches from 100 to >100.000 bp, whereas Wu et al. (100-400 bp) and Kumar et al. (100-1500 bp) show a far more limited detection range for their purified products [21,29,30]. This suggests that the present method has a smaller loss of purified eccDNA than previously published methods despite using a far smaller sample volume. We observed a high variation of the chromosomal plasma eccDNA load for lung cancer patients (Figure 5C), which may reflect an underlying chromosomal variation in the tumors that feed eccDNA into the plasma. Plasma eccDNA may therefore have the potential to reveal copy-number variations in the tumor, such as aneuploidy, which occurs in 90% of all solid cancers (reviewed in [40]).
In line with the low genome coverage observed for one mL plasma, we did not find any broad genetic-origin overlaps among eccDNA from controls, whereas in the lung cancer group, we found a number of eccDNAs from the same genes (Figure 7A,B). Some of the recurring genes were found to be involved in the regulation of developmental growth and differentiation, protein ubiquitination, and cancer-related pathways, as was also observed by Sanzhez-Vega et al. [41]. Interestingly, fragments from four genes were found in all lung cancer samples and either at reduced levels, or not at all in the control populations. Plasma eccDNA containing NFIA, CTNND2, ERBB4, or PCDH9 are genes generally involved in cancer development (reviewed in [42–45]). An increased presence of these genes in the bloodstream could stem from genome amplifications and alterations within tumors. For instance, gene CTNND2 is located on Chr5, for which we demonstrated a greater eccDNA count per chromosome after length normalization in cancer samples (Figures 5C). Our assessments did not uncover any of the previously reported established biomarkers of lung cancer in our plasma eccDNA populations [5,29,30,46–50].
The 170-200 bp periodic peak size pattern observed among our purified plasma eccDNA (Figure 4) suggests that a large portion of the identified eccDNA has a nucleosomal-related origin. It has also been suggested that apoptotic or necrotic cells can lead to the release of nucleosomal-sized linear DNA [21,35]. Likewise, similar periodical patterns have been observed for linear cfDNA in other cancers, peaking at 145 and 166 bp and with a high frequency of fragment sizes between 40 and 150 bp compared with cfDNA in healthy controls [51]. The nucleosomal-related eccDNA pattern is also in line with the increased apoptosis of cancer cells, which leads to similar-sized fragments and can contribute to accelerated cancer development and metastasis [52]. Furthermore, this periodical pattern was observed in both the lung cancer and control group (Figure S3), suggesting a general underlying eccDNA formation mechanism in which the nucleosomal structure plays a role for both cancers and healthy cells, as previously suggested for linear ctDNA (reviewed in [53]).
Conclusion
In conclusion, we observed a significant difference in plasma eccDNA counts between lung cancer and control samples. On the other hand, we were not able to identify conclusive gene markers that could be used to identify LC reproducibly. This suggests that traits other than genes and gene fragments on eccDNA are likely better targets for biomarker development (e.g. epigenetic features) due to the randomness of eccDNA found in plasma, its low genomic coverage, and its high inter-sample variability.
Author's Contribution
EZ, LBH and BR designed the study. EZ and JH performed the purification of the eccDNA and sequence preparation. DG, MJA-B, mapped the circles based on sequence data. LBH and EZ performed bioinformatics and analysis. JSJ included the lung cancer patients in the LUCAS study and provided the samples and clinical data. EZ and LBH co-wrote the first draft of the manuscript. The article was prepared by EZ, BR and LBH. BR supervised the study. All authors discussed the results and contributed to the final manuscript.
Funding
This project has received funding from the European Union's Horizon 2020 research and innovation programme under grant agreement No 899417, CIRCULAR VISION (JH, DG, MJA-B, YL, JBH, JSJ and BR), the Innovation Fund Denmark (8088-00049B, (LBH, JBH, JSJ and BR)), the Carlsberg Foundation (CF19-0705).
Ethics
All patients with lung cancer gave written informed consent. The study was performed according to the declaration of Helsinki. The LUCAS study protocol was approved by the Ethics Committee of the Capital Region of Denmark (VEK j.nr. H-2-2011-1) and the Danish Data Protection Agency (j. nr. 2007-58-0015, HEH-750.24-56, I-suite nr. 02771 and PACTIUS P-2019-614).
Acknowledgement
Professor Jorgen Wojtaszewski and technician Betina Blomgren, Department of Nutrition, Exercise and Sports, University of Copenhagen, for the sampling of blood and plasma from healthy individuals. Department of Oncology and The Danish Cancer Biobank for handling, freezing, and sampling the blood and plasma from patients with lung cancer. Sam Keating for processing test plasma samples with phenol/chloroform-salt precipitation method. Material from SMART- Servier Medical ART (https://smart. servier.com/) was used to create Figure 1.
Conflicts of Interest
The authors declare no conflict of interest.
Data Availability
Sequencing data are publicly available as of the date of publication at the SRA database (published Under BioProject number PRJNA939968).
References
- Ahmed, A. A., & Abedalthagafi, M. (2016). Cancer diagnostics: the journey from histomorphology to molecular profiling. Oncotarget, 7(36), 58696.
- Martins, I., Ribeiro, I. P., Jorge, J., Gonçalves, A. C., Sarmento-Ribeiro, A. B., Melo, J. B., & Carreira, I. M. (2021). Liquid biopsies: applications for cancer diagnosis and monitoring. Genes, 12(3), 349.
- Yan, Y. Y., Guo, Q. R., Wang, F. H., Adhikari, R., Zhu, Z.Y., Zhang, H. Y., ... & Zhang, J. Y. (2021). Cell-free DNA: hope and potential application in cancer. Frontiers in cell and developmental biology, 9, 639233.
- Thandra, K. C., Barsouk, A., Saginala, K., Aluru, J. S., & Barsouk, A. (2021). Epidemiology of lung cancer. Contemporary Oncology/Wspólczesna Onkologia, 25(1), 45-52.
- Villalobos, P., & Wistuba, I. I. (2017). Lung cancer biomarkers.Hematology/Oncology Clinics, 31(1), 13-29.
- Jiang, P., Chan, C. W., Chan, K. A., Cheng, S. H., Wong,J., Wong, V. W. S., ... & Lo, Y. D. (2015). Lengthening and shortening of plasma DNA in hepatocellular carcinoma patients. Proceedings of the National Academy of Sciences, 112(11), E1317-E1325.
- Mouliere, F., Robert, B., Arnau Peyrotte, E., Del Rio, M., Ychou, M., Molina, F., ... & Thierry, A. R. (2011). High fragmentation characterizes tumour-derived circulating DNA. PloS one, 6(9), e23418.
- Jamshidi, A., Liu, M. C., Klein, E. A., Venn, O., Hubbell, E., Beausang, J. F., ... & Swanton, C. (2022). Evaluation of cell-free DNA approaches for multi-cancer early detection. Cancer Cell, 40(12), 1537-1549.
- Li, B. T., Janku, F., Jung, B., Hou, C., Madwani, K., Alden, R., ... & Oxnard, G. R. (2019). Ultra-deep next-generation sequencing of plasma cell-free DNA in patients with advanced lung cancers: results from the Actionable Genome Consortium. Annals of Oncology, 30(4), 597-603.
- Vasseur, D., Sassi, H., Bayle, A., Tagliamento, M., Besse, B., Marzac, C., ... & Lacroix, L. (2022). Next-generation sequencing on circulating tumor DNA in advanced solid cancer: swiss army knife for the molecular tumor board? A review of the literature focused on FDA approved test. Cells, 11(12), 1901.
- Bronkhorst, A. J., Ungerer, V., & Holdenrieder, S. (2019). The emerging role of cell-free DNA as a molecular marker for cancer management. Biomolecular detection and quantification, 17, 100087.
- Diehl, F., Schmidt, K., Choti, M. A., Romans, K., Goodman, S., Li, M., ... & Diaz Jr, L. A. (2008). Circulating mutant DNA to assess tumor dynamics. Nature medicine, 14(9), 985-990.
- Gerdes, M. J., Sood, A., Sevinsky, C., Pris, A. D., Zavodszky,M. I., & Ginty, F. (2014). Emerging understanding of multiscale tumor heterogeneity. Frontiers in oncology, 4, 366.
- Xia, L., Li, Z., Zhou, B., Tian, G., Zeng, L., Dai, H., ... &He, J. (2017). Statistical analysis of mutant allele frequency level of circulating cell-free DNA and blood cells in healthy individuals. Scientific reports, 7(1), 7526.
- Fernando, M. R., Jiang, C., Krzyzanowski, G. D., & Ryan,W. L. (2017). New evidence that a large proportion of human blood plasma cell-free DNA is localized in exosomes. PloS one, 12(8), e0183915.
- Markus, H., Contente-Cuomo, T., Farooq, M., Liang, W. S., Borad, M. J., Sivakumar, S., ... & Murtaza, M. (2018). Evaluation of pre-analytical factors affecting plasma DNA analysis. Scientific reports, 8(1), 7375.
- McDonald, B. R., Contente-Cuomo, T., Sammut, S. J., Odenheimer-Bergman, A., Ernst, B., Perdigones, N., ... & Murtaza, M. (2019). Personalized circulating tumor DNA analysis to detect residual disease after neoadjuvant therapy in breast cancer. Science translational medicine, 11(504), eaax7392.
- Meador, C. B., Milan, M. S., Hu, E. Y., Awad, M. M., Rabin,M. S., Paweletz, C. P., ... & Oxnard, G. R. (2021). High sensitivity of plasma cell-free DNA genotyping in cases with evidence of adequate tumor content. JCO Precision Oncology, 5, 921-930.
- Hatipoglu, T., Esmeray Sönmez, E., Hu, X., Yuan, H., Danyeli, A. E., Seyhanli±, A., ... & Küçük, C. (2022). Plasma concentrations and cancer-associated mutations in cell-free circulating DNA of treatment-naive follicular lymphoma for improved non-invasive diagnosis and prognosis. Frontiers in Oncology, 12, 870487.
- Bendich, A., Wilczok, T., & Borenfreund, E. (1965). Circulating DNA as a possible factor in oncogenesis. Science, 148(3668), 374-376.
- Kumar, P., Dillon, L. W., Shibata, Y., Jazaeri, A. A., Jones,D. R., & Dutta, A. (2017). Normal and cancerous tissues release extrachromosomal circular DNA (eccDNA) into the circulation. Molecular Cancer Research, 15(9), 1197-1205.
- Sin, S. T., Jiang, P., Deng, J., Ji, L., Cheng, S. H., Dutta, A.,... & Lo, Y. D. (2020). Identification and characterization of extrachromosomal circular DNA in maternal plasma.Proceedings of the National Academy of Sciences, 117(3), 1658-1665.
- Cohen, S., Regev, A., & Lavi, S. (1997). Small polydispersed circular DNA (spcDNA) in human cells: association with genomic instability. Oncogene, 14(8), 977-985.
- Cohen, S., & Mechali, M. (2001). A novel cell-free system reveals a mechanism of circular DNA formation from tandem repeats. Nucleic acids research, 29(12), 2542-2548.
- Nanic, L., Ravlic, S., & Rubelj, I. (2016). Extrachromosomal DNA in Genome (in) Stability–Role of Telomeres. Croatica chemica acta, 89(2), 175-181.
- Noer, J. B., Hørsdal, O. K., Xiang, X., Luo, Y., & Regenberg,B. (2022). Extrachromosomal circular DNA in cancer: history, current knowledge, and methods. Trends in Genetics, 38(7), 766-781.
- Bøllehuus Hansen, L., Jakobsen, S. F., Zole, E., Noer, J. B., Fang, L. T., Alizadeh, S., ... & Regenberg, B. (2023). Methods for the purification and detection of single nucleotide KRAS mutations on extrachromosomal circular DNA in human plasma. Cancer Medicine, 12(17), 17679-17691.
- Hung, K. L., Luebeck, J., Dehkordi, S. R., Colón, C. I., Li, R., Wong, I. T. L., ... & Chang, H. Y. (2022). Targeted profiling of human extrachromosomal DNA by CRISPR-CATCH. Nature genetics, 54(11), 1746-1754.
- Xu, G., Shi, W., Ling, L., Li, C., Shao, F., Chen, J., &Wang, Y. (2022). Differential expression and analysis of extrachromosomal circular DNAs as serum biomarkers in lung adenocarcinoma. Journal of Clinical Laboratory Analysis, 36(6), e24425.
- Wu, X., Li, P., Yimiti, M., Ye, Z., Fang, X., Chen, P.,& Gu, Z. (2022). Identification and characterization of extrachromosomal circular DNA in plasma of lung adenocarcinoma patients. International Journal of General Medicine, 4781-4791.
- Goldstein, A. L., & McCusker, J. H. (1999). Three new dominant drug resistance cassettes for gene disruption in Saccharomyces cerevisiae. Yeast, 15(14), 1541-1553.
- Prada-Luengo, I., Krogh, A., Maretty, L., & Regenberg,B. (2019). Sensitive detection of circular DNAs at single-nucleotide resolution using guided realignment of partially aligned reads. BMC bioinformatics, 20, 1-9.
- Møller, H. D., Mohiyuddin, M., Prada-Luengo, I., Sailani, M. R., Halling, J. F., Plomgaard, P., ... & Regenberg, B. (2018). Circular DNA elements of chromosomal origin are common in healthy human somatic tissue. Nature communications, 9(1), 1069.
- Dos Santos, C. R., Hansen, L. B., Rojas-Triana, M., Johansen,A. Z., Perez-Moreno, M., & Regenberg, B. (2023). Variation of extrachromosomal circular DNA in cancer cell lines. Computational and Structural Biotechnology Journal, 21, 4207-4214.
- Jahr, S., Hentze, H., Englisch, S., Hardt, D., Fackelmayer,F. O., Hesch, R. D., & Knippers, R. (2001). DNA fragments in the blood plasma of cancer patients: quantitations and evidence for their origin from apoptotic and necrotic cells.Cancer research, 61(4), 1659-1665.
- Zhong, Y., Fan, Q., Zhou, Z., Wang, Y., He, K., & Lu, J. (2020). Plasma cfDNA as a potential biomarker to evaluate the efficacy of chemotherapy in gastric cancer. Cancer Management and Research, 3099-3106.
- Mathios, D., Johansen, J. S., Cristiano, S., Medina, J. E., Phallen, J., Larsen, K. R., ... & Velculescu, V. E. (2021). Detection and characterization of lung cancer using cell-free DNA fragmentomes. Nature communications, 12(1), 5060.
- Mouliere, F., Smith, C. G., Heider, K., Su, J., van der Pol, Y., Thompson, M., ... & Mair, R. (2021). Fragmentation patterns and personalized sequencing of cell-free DNA in urine and plasma of glioma patients. EMBO molecular medicine, 13(8), e12881.
- Raman, L., Van der Linden, M., Van der Eecken, K., Vermaelen, K., Demedts, I., Surmont, V., ... & Van Dorpe, J. (2020). Shallow whole-genome sequencing of plasma cell-free DNA accurately differentiates small from non-small cell lung carcinoma. Genome Medicine, 12, 1-12.
- Ben-David, U., & Amon, A. (2020). Context is everything: aneuploidy in cancer. Nature Reviews Genetics, 21(1), 44-62.
- Sanchez-Vega, F., Mina, M., Armenia, J., Chatila, W. K., Luna, A., La, K. C., ... & Marra, M. A. (2018). Oncogenic signaling pathways in the cancer genome atlas. Cell, 173(2), 321-337.
- Lu, Q., Lanford, G. W., Hong, H., & Chen, Y. H. (2014).δ-Catenin as potential cancer biomarker. Pathology international, 64(5), 243.
- Segers, V. F., Dugaucquier, L., Feyen, E., Shakeri, H., & De Keulenaer, G. W. (2020). The role of ErbB4 in cance r. Cellular oncology, 43(3), 335-352.
- Wang, C., Yu, G., Liu, J., Wang, J., Zhang, Y., Zhang, X.,... & Huang, Z. (2012). Downregulation of PCDH9 predicts prognosis for patients with glioma. Journal of Clinical Neuroscience, 19(4), 541-545.
- Yang, B., Zhou, Z. H., Chen, L., Cui, X., Hou, J. Y., Fan, K.J., ... & Liu, Y. (2018). Prognostic significance of NFIA and NFIB in esophageal squamous carcinoma and esophagogastric junction adenocarcinoma. Cancer Medicine, 7(5), 1756-1765.
- Jiawei, Z., Min, M., Yingru, X., Xin, Z., Danting, L., Yafeng, L., ... & Dong, H. (2020). Identification of key genes in lung adenocarcinoma and establishment of prognostic mode. Frontiers in Molecular Biosciences, 7, 561456.
- Kan, C. F. K., Unis, G. D., Li, L. Z., Gunn, S., Li, L., Soyer,H. P., & Stark, M. S. (2021). Circulating Biomarkers for Early Stage Non-Small Cell Lung Carcinoma Detection: Supplementation to Low-Dose Computed Tomography. Frontiers in Oncology, 11, 555331.
- Maharjan, M., Tanvir, R. B., Chowdhury, K., Duan, W., & Mondal, A. M. (2020). Computational identification of biomarker genes for lung cancer considering treatment and non-treatment studies. BMC bioinformatics, 21, 1-19.
- Patel, J. N., Ersek, J. L., & Kim, E. S. (2015). Lung cancer biomarkers, targeted therapies and clinical assays. Translational Lung Cancer Research, 4(5), 503.
- Yang, Y., Yang, Y., Huang, H., Song, T., Mao, S., Liu, D., ... & Li, W. (2023). PLCG2 can exist in eccDNA and contribute to the metastasis of non-small cell lung cancer by regulating mitochondrial respiration. Cell Death & Disease, 14(4), 257.
- Sanchez, C., Roch, B., Mazard, T., Blache, P., Dache, Z. A. A., Pastor, B., ... & Thierry, A. R. (2021). Circulating nuclear DNA structural features, origins, and complete size profile revealed by fragmentomics. JCI insight, 6(7).
- Wang, R. A., Li, Q. L., Li, Z. S., Zheng, P. J., Zhang, H. Z.,Huang, X. F., ... & Cui, R. (2013). Apoptosis drives cancer cells proliferate and metastasize. Journal of cellular and molecular medicine, 17(1), 205-211.
- Van Der Vaart, M., & Pretorius, P. J. (2008). Circulating DNA: its origin and fluctuation. Annals of the New York Academy of Sciences, 1137(1), 18-26.
Supplementary Figure Legends:
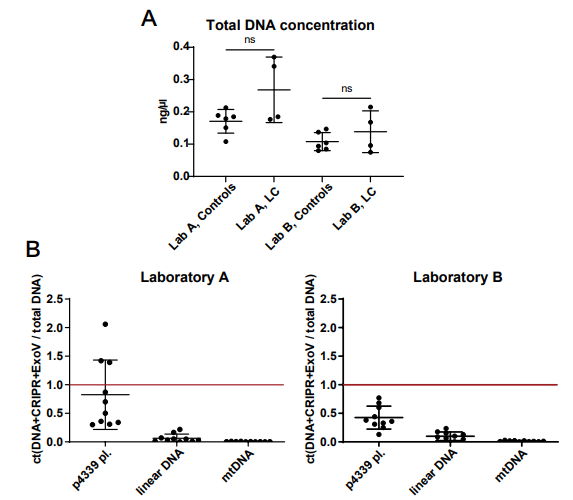
Figure S1: (A) Total DNA concentration measured by Qubit after DNA extraction from plasma samples. (B) Quality tests for the extracted circular DNA measured by qPCR. The red bar indicates the total amount of DNA before MssI and Exonuclease V (ExoV) treatment. Ct, cycle threshold; LC, lung cancer, p4339, iner control plasmid; ns, not significant.
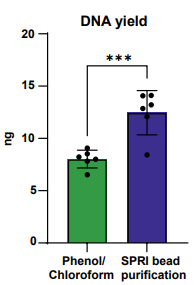
Figure S2: Comparison of circular DNA yields from plasma from 6 technical replicates of healthy commercially available plasma. Circular DNA was purified with the Solid-Phase Reversible Immobilization (SPRI) bead purification and phenol/chloroform-based salt precipitation method.
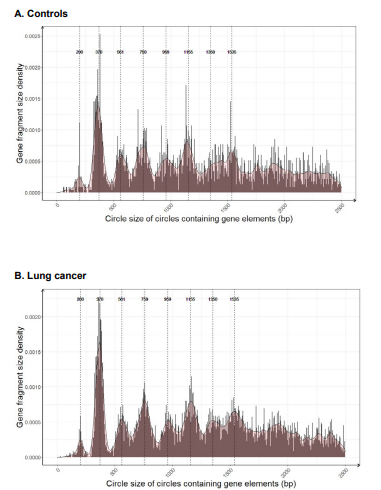
Figure S3: eccDNA size density distributions of circles containing gene segments for (A) control samples (B) samples from patients with lung cancer (adenocarcinomas). Dashed lines highlight peak density tips at 170-200 bp intervals observed in the plotted data.
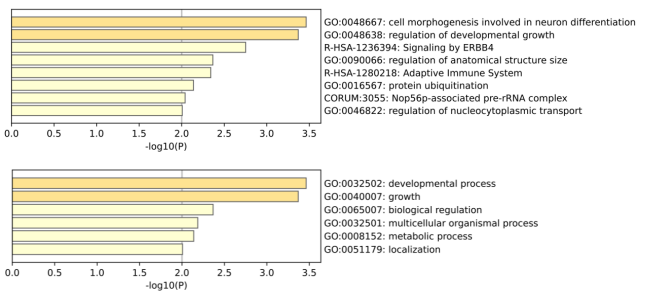
Figure S4: Gene ontology analysis for the significantly overrepresented gene segments present on lung cancer eccDNA (Figure 7E, Table S2). https://metascape.org.
|
Gene |
Primer sequence |
Fragment length, bp |
|
GNP1 |
F - GGTTCAAAGGTGTCGTTGCC |
337 |
|
R - GCACCGTTAGCAACGGAAAG |
||
|
AGP1 |
F - GTTTTGGGTTTGCAGTCGCT |
820 |
|
R - GCACAGAAGGCAATAACGGC |
||
|
ACT1 |
F - TGGATTCTGGTATGTTCTAGC |
1409 |
|
R - GAACGACGTGAGTAACACC |
||
|
BCP1 |
F - TCAGTACAGTTGCGGTGGAC |
2716 |
|
R - TCGGATAGCCTCTGGTTAGG |
||
|
qPCR mtDNA |
F - GCCCACTTCCACTATGTCCT |
92 |
|
R GATTTTGGCGTAGGTTTGGTCT |
||
|
qPCR BCP1 |
F - CGGTGGTAACCCAGAAGTTGA |
130 |
|
R - TGTGGTGGTTGGGGAACCTA |
||
|
qPCR p4339 |
F - TGCCCTGCCCCTAATCAGTA |
60 |
|
R - CTGGGCAGATGATGTCGAGG |
Table S1: Description of primers for linear DNA fragment synthesis and qPCR reactions.
Laboratory A
|
A samples |
eccDNA numbers |
Mean eccDNA Size, bp* |
Median eccDNA Size, bp* |
Z- score |
Designation |
Age, years |
Days to Patient`s Death |
|
A1, A1.2, A1.3 |
536 |
1911.7 |
1041 |
-0.37 |
- |
60-65 |
- |
|
A2 |
367 |
4048.9 |
2327 |
-0.82 |
- |
55-60 |
- |
|
A3 |
1223 |
2371.7 |
1199 |
1.46 |
- |
55-60 |
- |
|
A4, A4.2, A4.3 |
576 |
4098.2 |
2365 |
-0.26 |
- |
50-55 |
- |
|
A5 |
3373 |
2084.5 |
1317 |
7.17 |
Lung cancer stage IV (adenocarcinoma) |
60 |
98 |
|
A6 |
2546 |
3500.2 |
2193 |
4.97 |
Lung cancer stage IV (adenocarcinoma) |
63 |
102 |
|
A7 |
1757 |
1737.9 |
1221 |
2.88 |
Lung cancer stage IV (adenocarcinoma) |
72 |
1795 |
|
A8 |
1343 |
2799.3 |
1518 |
1.77 |
Lung cancer stage IV (adenocarcinoma) |
75 |
1492 |
|
A Laboratory Water |
3 |
1893.3 |
2054 |
-1.79 |
- |
- |
- |
Laboratory B
|
B samples |
eccDNA numbers |
Mean eccDNA Size, bp** |
Median eccDNA Size, bp** |
Z- score |
Designation |
Age, years |
Days to Patient`s Death |
|
B1 |
188 |
6288.5 |
3402.5 |
-0.94 |
- |
60-65 |
- |
|
B2, B2.2, B2.1 |
244 |
3651.5 |
1743.5 |
-0.57 |
- |
55-60 |
- |
|
B3 |
355 |
6754.3 |
4308 |
0.17 |
- |
55-60 |
- |
|
B4, B4.2, B4.3 |
531 |
4949.3 |
2184 |
1.33 |
- |
50-55 |
- |
|
B5 |
3120 |
3936.4 |
1725.5 |
18.47 |
Lung cancer stage IV (adenocarcinoma) |
60 |
98 |
|
B6 |
12 |
13508.6 |
11668 |
-2.1 |
Lung cancer stage IV (adenocarcinoma) |
63 |
102 |
|
B7 |
1187 |
3147.6 |
1897 |
5.68 |
Lung cancer stage IV (adenocarcinoma) |
72 |
1795 |
|
B8 |
1069 |
1847.4 |
1203 |
4.9 |
Lung cancer stage IV (adenocarcinoma) |
75 |
1492 |
|
B Laboratory Water |
4 |
2897.3 |
3179.5 |
-2.15 |
- |
- |
- |
*Laboratory A: t-test for controls vs lung cancer samples – mean size p=0.4337, median size p=0.6968
**Laboratory B: t-test for controls vs lung cancer samples – mean size p=0.9448, median size p=0.6553
Table S2: eccDNA numbers and size differences among the samples and laboratories. Sample characterization of eccDNA counts, sizes and Z-score relative to the mean control eccDNA counts of each laboratory. Library duplicates are not included.
|
Groups |
Count of overlapping genes or gene fragments |
Percentage |
|||
|
Average, range |
Average, range % |
||||
|
Controls |
Lung cancer |
Controls |
Lung cancer |
||
|
Individuals within in a group |
Lab A |
11.2 0-45 |
64.8 17-193 |
0.7 0-3% |
1.3 0-5% |
|
Lab B |
3.3 0-12 |
65.8 26-108 |
0.5 0-2% |
2.5 1-4% |
|
|
Individuals between the two laboratories |
Lab A/Lab B |
13.5 2-29 |
136 4-364 |
1.9 0.6-3.7% |
6.6 0.4-13.1% |
|
Within the same individual |
Lab A |
14.5 1-25 |
- |
1.3 0-2% |
- |
|
Lab B |
10.5 4-16 |
- |
1 0-2% |
- |
|
|
Within the same eccDNA purification |
Lab A |
10.5 2-17 |
- |
1.3 0-2% |
- |
|
Lab B |
3.3 0-9 |
- |
0.8 0-2% |
- |
|
|
Within library preparation |
Lab A |
252 170-352 |
929 626-1123 |
56.7 49.1-64.4% |
60.1 55.8-67.9% |
Table S3: Frequencies of co-occurring whole genes or gene fragments on eccDNA among samples.
|
Gene Name |
Nr. of eccDNA |
Gene Length, bp |
Nr. of eccDNA /gene length |
Quantile 0.025 |
Quantile 0.05 |
Quantile 0.5 |
Quantile 0.95 |
Quantile 0.975 |
Relative 0.975 |
|
TP73-AS1 |
2 |
11862 |
0.000169 |
0.999885 |
0.999977 |
0.99831 |
2.005558 |
1.991819 |
0.008181 |
|
ANGPTL7 |
2 |
6626 |
0.000302 |
0.999912 |
0.999982 |
0.99864 |
1.997788 |
1.983032 |
0.016968 |
|
RNF19B |
3 |
28364 |
0.000106 |
0.999942 |
0.999989 |
1.00148 |
1.996486 |
2.218852 |
0.781148 |
|
AZIN2 |
3 |
42388 |
7.08E-05 |
1 |
1 |
1.00371 |
2.00939 |
2.497417 |
0.502583 |
|
TRABD2B |
5 |
236857 |
2.11E-05 |
0.999738 |
0.999645 |
1.5519 |
4.028497 |
4.436887 |
0.563113 |
|
ELAVL4 |
4 |
179743 |
2.23E-05 |
0.999885 |
1.000008 |
1.26272 |
3.520618 |
3.808382 |
0.191618 |
|
NFIA |
11 |
597529 |
1.84E-05 |
0.98902 |
1.005049 |
3.42687 |
7.356415 |
8.226029 |
2.773971 |
|
RAVER2 |
3 |
88137 |
3.40E-05 |
0.999507 |
0.999898 |
0.99691 |
2.476833 |
2.999315 |
0.000685 |
|
PHTF1 |
3 |
62658 |
4.79E-05 |
0.999861 |
0.999969 |
0.99917 |
2.153909 |
2.787848 |
0.212152 |
|
PRRC2C |
4 |
107981 |
3.70E-05 |
0.999338 |
0.999876 |
1.01508 |
2.749794 |
3.135055 |
0.864945 |
|
PTPN14 |
6 |
203749 |
2.94E-05 |
1.000012 |
0.999952 |
1.38197 |
3.735408 |
4.071009 |
1.928991 |
|
LINC02632 |
2 |
10441 |
0.000192 |
0.999889 |
0.999978 |
0.9983 |
2.004341 |
1.985456 |
0.014544 |
|
PRKG1 |
17 |
1307535 |
1.30E-05 |
1.407526 |
1.486773 |
6.88765 |
12.9899 |
13.57549 |
3.424513 |
|
LINC01374 |
7 |
371848 |
1.88E-05 |
0.994454 |
0.997202 |
2.25087 |
5.254932 |
5.903844 |
1.096156 |
|
LINC01435 |
8 |
502876 |
1.59E-05 |
0.98889 |
0.998272 |
2.9339 |
6.473715 |
7.276075 |
0.723925 |
|
GPAM |
4 |
65512 |
6.11E-05 |
0.999825 |
0.999961 |
0.99829 |
2.184482 |
2.817766 |
1.182234 |
|
SHTN1 |
6 |
245109 |
2.45E-05 |
0.999583 |
0.999528 |
1.59438 |
4.102089 |
4.527774 |
1.472226 |
|
LINC02755 |
9 |
653450 |
1.38E-05 |
0.992093 |
1.012619 |
3.71694 |
7.874157 |
8.767994 |
0.232006 |
|
PAMR1 |
4 |
98477 |
4.06E-05 |
0.999393 |
0.99988 |
1.0032 |
2.621791 |
3.068017 |
0.931983 |
|
AHNAK |
4 |
122693 |
3.26E-05 |
0.999348 |
0.999894 |
1.04527 |
2.933164 |
3.251393 |
0.748607 |
|
MMP10 |
2 |
10126 |
0.000198 |
0.99989 |
0.999978 |
0.99831 |
2.003989 |
1.984427 |
0.015573 |
|
BARX2 |
3 |
76431 |
3.93E-05 |
0.999671 |
0.99993 |
0.99585 |
2.317115 |
2.915032 |
0.084968 |
|
ERC1 |
8 |
505424 |
1.58E-05 |
0.98883 |
0.998373 |
2.94719 |
6.497514 |
7.302141 |
0.697859 |
|
BCAT1 |
4 |
139077 |
2.88E-05 |
0.999458 |
0.999933 |
1.09361 |
3.119061 |
3.396578 |
0.603422 |
|
SCYL2 |
3 |
74575 |
4.02E-05 |
0.999698 |
0.999935 |
0.9961 |
2.293117 |
2.900116 |
0.099884 |
|
SPPL3 |
4 |
141848 |
2.82E-05 |
0.999484 |
0.999941 |
1.10312 |
3.148847 |
3.422548 |
0.577452 |
|
PCDH9 |
12 |
927611 |
1.29E-05 |
1.061394 |
1.107487 |
5.11026 |
10.29671 |
11.16975 |
0.830253 |
|
DAAM1 |
4 |
182759 |
2.19E-05 |
0.999911 |
1.000007 |
1.27721 |
3.54812 |
3.840908 |
0.159092 |
|
ADCK1 |
5 |
134905 |
3.71E-05 |
0.999423 |
0.999922 |
1.07998 |
3.073361 |
3.358208 |
1.641792 |
|
SPATA7 |
3 |
85426 |
3.51E-05 |
0.999543 |
0.999905 |
0.99618 |
2.438955 |
2.980896 |
0.019104 |
|
NPAP1 |
2 |
7618 |
0.000263 |
0.999905 |
0.999981 |
0.9985 |
2 |
1.981489 |
0.018511 |
|
FTO |
7 |
456820 |
1.53E-05 |
0.990401 |
0.997075 |
2.69366 |
6.043821 |
6.80062 |
0.19938 |
|
HAS3 |
2 |
13066 |
0.000153 |
0.999883 |
0.999976 |
0.99836 |
2.006149 |
1.999328 |
0.000672 |
|
NEUROD2 |
2 |
6241 |
0.00032 |
0.999916 |
0.999983 |
0.99871 |
1.996824 |
1.984065 |
0.015935 |
|
CA10 |
9 |
529704 |
1.70E-05 |
0.988408 |
0.999536 |
3.07378 |
6.724274 |
7.549207 |
1.450793 |
|
DCAF7 |
3 |
43802 |
6.85E-05 |
1 |
1 |
1.00366 |
2.014477 |
2.522993 |
0.477007 |
|
RNF152 |
3 |
86180 |
3.48E-05 |
0.999533 |
0.999903 |
0.99635 |
2.449457 |
2.986063 |
0.013937 |
|
ZNF160 |
3 |
36828 |
8.15E-05 |
0.999988 |
0.999998 |
1.0033 |
1.997352 |
2.389249 |
0.610751 |
|
LINC01376 |
6 |
361616 |
1.66E-05 |
0.994974 |
0.997353 |
2.19765 |
5.160579 |
5.794318 |
0.205682 |
|
R3HDM1 |
4 |
193815 |
2.06E-05 |
0.999984 |
0.999989 |
1.33169 |
3.647448 |
3.961478 |
0.038522 |
|
PDE11A |
8 |
449533 |
1.78E-05 |
0.990701 |
0.996982 |
2.65566 |
5.975892 |
6.724672 |
1.275328 |
|
RAPH1 |
4 |
140990 |
2.84E-05 |
0.999476 |
0.999939 |
1.10014 |
3.139671 |
3.414466 |
0.585534 |
|
ERBB4 |
16 |
1163124 |
1.38E-05 |
1.231792 |
1.299922 |
6.24036 |
12.09106 |
12.80907 |
3.19093 |
|
CROCC2 |
4 |
86981 |
4.60E-05 |
0.999522 |
0.999901 |
0.99656 |
2.460644 |
2.991513 |
1.008487 |
|
KIZ |
4 |
120639 |
3.32E-05 |
0.999341 |
0.99989 |
1.04026 |
2.908565 |
3.234296 |
0.765704 |
|
CXADR |
3 |
80536 |
3.73E-05 |
0.999612 |
0.999918 |
0.99565 |
2.371759 |
2.946228 |
0.053772 |
Table S4: A list of the recurring genetic fragments among eccDNAs found to be significantly overrepresented among cancer samples relative to the genetic length (identified through quantitative regression analysis, n=126, Figure 7E).