



Research Article - (2019) Volume 4, Issue 2
Genotype X Environment Interaction for Quality Traits in Bread Wheat Genotype Tested At Six Environments
Received Date: Mar 18, 2019 / Accepted Date: Apr 25, 2019 / Published Date: Mar 14, 2019
Copyright: ©Gadisa Alemu. This is an open-access article distributed under the terms of the Creative Commons Attribution License, which permits unrestricted use, distribution, and reproduction in any medium, provided the original author and source are credited.
Abstract
The study was conducted to evaluate the effect of GEI and its magnitude on the grain quality of bread wheat genotypes in Ethiopia. 15 bread wheat genotypes were evaluated using RCBD with four replications at six different locations in Ethiopia during 2017/18 cropping season. Combine Analysis of variance showed highly significant (P<0.001) differences among genotype, environment and GEI for investigated quality traits except GEI shows non-significant difference in dry gluten and gluten index. The environment contributed more than 50% only in PC (83.6%) and HLW (56.1%). The three components, G, E and GxE made almost similar contribution to most of the quality traits (WG, DG and GI), although the contribution of the environment was a little higher. Hardness index was determined mainly by the genotype (69.3%). The contribution of GxE was higher than that of genotype in all quality traits except in HDI and GI, again indicating the important role of GxE in the determination of wheat quality traits. Genotype ETBW9045 and ETBW8065 gave the best value of protein in the favorable means (15.05% and 14.75%) respectively. The Hidase had the highest value of wet gluten (58.2%) and dry gluten (24.38%) in average for all investigated locations (58.2%). GGE biplot declared ETBW9045 (#10) and ETBW8065 (#6) genotypes as stable in all quality. These two genotypes ETBW9045 (#10) and ETBW8065 (#6) are recommended for wide adaptation and for crossing. This study demonstrates success in wheat breeding for improved quality in bread wheat. The study also provides information on the combined stability of improved quality of the nationally important bread wheat genotypes. Therefore, the results of this study could be valuable for national bread wheat breeding programs to develop new varieties with high stable grain quality.
Keywords
Dry Gluten, Protein Content, Wet Gluten
Introduction
Knowledge of the relative contributions of genotype, environment and genotype by environment interaction effects on wheat (Triticum aestivum L.) quality leads to more effective selection in breeding programs and segregation of more uniform parcels of grain better suited to the needs of customers. Grain quality is a complex character that depends on a number of traits, and the individual contribution of each trait varies depending on specific reaction to environmental conditions [1]. Improvement of end-use quality in bread wheat depends on a thorough understanding of current wheat quality and the influences of genotype, environment and genotype by environment interaction on quality traits. The successful process of wheat breeding is based on the knowledge of characteristics of genotypes, environment and its interaction. Evaluation of genotypes across diverse environments and over several years is needed in order to identify spatially and temporally stable genotypes that could be recommended for release as new cultivars and/or for use in the breeding programs [2].
More information about GE interaction for grain quality characters of bread wheat is needed. It is important to determine and quantify the extent to which factors like the genotypes, environment and genotype x environment interaction contribute to variations in each wheat quality parameter [3]. The performance of many quality characteristics depends greatly on environmental conditions, which result in differential expression of grain quality from site to site. The effects of genotype, environment, and their interaction on wheat quality, determined using multiplication trials have been used to enhance wheat breeding for quality [4,5]. Numerous investigations have been conducted on the influence of environmental conditions on particular quality traits [1,6]. The results of these investigations showed that environments have an influence on quality traits, and, in some environmental conditions the direction of influence on the trait is known. However, it is the cultivar that responds to the growing conditions and several researches have shown evidence for variation in genetic responses to environments for the various measures of end-use quality [7,8]. Several studies have generally shown that environment, genotype and G × E interactions are all significant factors contributing to different expression of quality [9,10].
There is a lack of information on the effect of GE interaction on the quality of bread wheat in Ethiopia. In order to develop bread wheat genotypes acceptable to farmers, the stability of the grain quality traits must be determined. In Ethiopia, many studies have been carried out on bread wheat to evaluate effects of genotype, environment and their interaction. However no information is available on the GEI, stability in grain yield performance of bread wheat genotypes and information is limited on the relative importance of the effects of genotype, environment and GEI on the quality characteristics of wheat grown in Ethiopia. Now a day’s emphasis has been given to the quality analysis of bread wheat. This showed the importance of developing a research activity to investigate the differential expression in different quality traits among the bread wheat varieties developed by the national wheat-breeding program. Keeping in view the importance of GEI in reference to its application for identifying stable genotypes, the present experiment was conducted with the objective to evaluate the effect of genotype x environment interaction and its magnitude on the grain quality of bread wheat genotypes in Ethiopia.
Material and methods
Thirteen advanced bread wheat genotype and two recently released varieties were evaluated across six locations in 2017 / 2018 main cropping seasons. Description of test locations and wheat genotype is provided in Table 1 and Table 2, respectively.
Table 1: Location and descriptions of weather condition for six locations
|
Loc |
Annual Temp (oc) |
Annual RF(mm) |
pH |
Soil type |
Altitude |
Geographic position |
||
|
Latitude |
Longitude |
|||||||
|
Holeta |
6.2 |
22.1 |
1044 |
5 |
clay loam |
2400 |
- |
- |
|
Dhera |
14 |
27.8 |
680 |
7 |
silt loam |
1650 |
08°19'10"N |
39°19'13"E |
|
A. Robe |
6 |
21.1 |
890 |
5.6 |
vertisol |
2420 |
07°53'02"N |
39°37'40"E |
|
Kulumsa |
10.5 |
22.8 |
820 |
6 |
clay soil |
2200 |
08°01'10"N |
39°09'11"E |
|
Bekoji |
7.9 |
18.6 |
1020 |
5 |
clay loam |
2780 |
07°32'37"N |
39°15'21"E |
|
Asasa |
5.8 |
24 |
620 |
6.5 |
clay loam |
2000 |
07°07'09"N |
39°11'50"E |
The field experiment was laid out in RCBD with four replications. The experimental field plot was 6 rows of 2.5 m long with a 0.2 m inter-row spacing. Each plot was planted at a rate of 150 kg ha-1. The fertilizer application and other crop management practices were done as per recommendations of each test locations. Weeds grown in the plots were removed manually starting from two weeks after sowing.
Table 2: The names, pedigree and selection history of the genotypes were evaluated in the experiment in 2017/18 cropping season at six locations
|
Name |
Pedigree |
|
Lemu |
WAXWING*2/HEILO |
|
ETBW8070 |
Line 1 Singh/ETBW4919 |
|
ETBW8078 |
Line 1 Singh/(Cham6/WW1402) |
|
ETBW8084 |
Line 3 Singh/(Cham6/WW1402) |
|
ETBW8311 |
ND643/2*WBLL1/3/KIRITATI//PRL/2*PASTOR/4/KIRITATI//PBW65/2*SERI.1B |
|
ETBW8065 |
Line 1 Singh/ETBW4919 |
|
ETBW8427 |
SERI.1B//KAUZ/HEVO/3/AMAD/4/PYN/BAU//MILAN/5/ICARDA-SRRL-1 |
|
ETBW8459 |
CHIL-1//VEE'S'/SAKER'S' |
|
ETBW9037 |
SWSR22T.B./2*BLOUK #1//WBLL1*2/KURUKU |
|
ETBW9045 |
KINDE/4/CMH75A.66//H567.71/5*PVN/3/SERI |
|
ETBW8075 |
Line 1 Singh/(Cham6/WW1402) |
|
ETBW9464 |
MARCHOUCH*4/SAADA/3/2*FRET2/KUKUNA//FRET2*2/4/TRCH/SRTU//KACHU |
|
ETBW9466 |
ATTILA/3*BCN//BAV92/3/TILHI/5/BAV92/3/PRL/SARA//TSI/VEE#5/4/CROC_1/AE.SQUARROSA(224)//2*OPATA*2/6/ HUW234+LR34/PRINIA//UP2338*2/VIVITSI |
|
ETBW9470 |
BAVIS#1/5/W15.92/4/PASTOR//HXL7573/2*BAU/3/WBLL1 |
|
Hidasse |
YANAC/3/PRL/SARA//TSI/VEE#5/4/CROC-1/AE.SQUAROSA(224)//OPATTA |
Quality Assessment
Wheat samples was uniformly divided through Boerner Divider and analyzed for quality characteristics such as HLW, hardness index, protein and gluten according to standard procedures as described in AACC [11].
Protein Content (PC)
PC in grain was determined Near Infra-Red Spectroscopy [11].
Hectoliter weight (HLW)
HLW was determined using the approved method of the American Association of Cereal Chemists 55-10 and the results were reported in kg/hL [11]. Whereas TKW was taken on analytical balance after counting wheat kernels on seed counter.
Gluten content:
The gluten quality was evaluated by the standard methods of AACC test procedure [11].
Statistical Analysis
The grain quality data for fifteen bread wheat from six environments were used to combine analysis of variance (ANOVA) to determine the effects of environment, genotype and GEI. Before combine the data Bartlett’s test was used to determine the homogeneity of variances between environments to determine the validity of the combined ANOVA on the data and the data collected was homogenous The GGE biplot is a biplot that displays the GGE part of MET data. The basic model for a GGE biplot is:

where Yij is the mean for the ith genotype in the jth environment, μ is the grand mean βj is the main effect of environment j, λ1 and λ2 are the singular values of the 1st and 2nd principal components (PC1 and PC2), ξi1 and ξi2 are the PC1 and PC2 scores, respectively, for genotypei^th, ηj1 and ηj2 are the eigenvectors for the jth environment for PC1 and PC2 and €ij is the residual error term.
Result and Discussion
Combined ANOVA depicted very highly significant differences among environments and among genotypes for all quality traits. The GxE interaction was also very highly significant for all traits except for dry gluten content and gluten index.
Table 3: ANOVA for grain quality of 15 bread wheat genotypes over six locations
|
Traits |
Source of variation |
|||||
|
Env't(5) |
Rep(evn't)(18) |
Genotype(14) |
GEI (70) |
Error(267) |
CV% |
|
|
HLW |
609.51*** |
8.29 |
76.49*** |
20.02*** |
2.57 |
2.26 |
|
TKW |
505.65*** |
11.38 |
295.2 *** |
60.4*** |
2174.36 |
8.06 |
|
HDI |
955.77*** |
35.47 |
1899.35*** |
99.85*** |
12.84 |
4.88 |
|
PC |
182.75*** |
2.38 |
2.32*** |
2.1*** |
0.5 |
4.96 |
|
WG |
3464.92*** |
105.2 |
523.25*** |
155.78*** |
95.89 |
21.69 |
|
DG |
560.07*** |
21.55 |
159.03*** |
36.69ns |
34.37 |
33.95 |
|
GI |
2752.13*** |
83.61 |
959.46*** |
146.93ns |
114.92 |
14.91 |
*** Highly significant at P<0.001
Where HLW=hectoliter weight, TKW=thousand kernel weight, HDI=hardiness index, PC=protein content, WG=wet gluten content, DG=dry gluten content, GI=gluten content, CV=coefficient of variations.
This indicated that quality traits of bread wheat were highly influenced by environmental factors. This significance of environment on quality traits of wheat is in agreement with results of previous investigations those reported that environment had significant effect on grain quality of bread wheat genotypes [12,13,10]. The greater significance of environmental variation for protein content in bread wheat, in this study, is in agreement with the results of Drezner et al. and Bilgin et al., those stated strong environmental impact on bread wheat protein content [12,14]. Many other studies demonstrated that environmental conditions have a larger effect on protein content than the genotype [15,16]. The greater significance of environmental variation for wet gluten content in bread, in this study, is in agreed with the results of Drezner et al., and Bilgin et al., stating that strong environmental impact on bread wheat wet gluten content and also in line with other finding of Mikulíková et al., and Zecevic et al., those reported that wet gluten content significantly depended on environment, cultivar, year and their interactions [12-14,17]. In this result genotype as source variation was least important than environmental and GEI. Significant genotype x environment interaction was found for all quality traits studied (except for dry gluten and gluten index). This would mean that evaluation of bread wheat genotype of several environments would give a more accurate estimate of their quality potential.
The relative contribution of genotype, environment and their interaction to the total variation of 10 quality traits is shown in Table 4. For all the traits investigated in this study, the component of variation due to environment was larger than the component of variation due to the genotype and genotype by environments interaction and varied from 12.5–83.8%.
Table 4: Proportion of Total Treatment (G+E+GEI) contributed by G, E and GxE Interaction In quality traits
|
Traits |
GENOTYPE |
ENVIRONMET |
G XE interaction |
|
Hardness index |
69.3 |
12.5 |
18.2 |
|
Protein content |
3.0 |
83.6 |
13.5 |
|
Wet gluten content |
20.6 |
48.7 |
30.7 |
|
Dry gluten content |
29.3 |
36.9 |
33.8 |
|
Gluten index |
35.8 |
36.7 |
27.4 |
|
Hectolitre weight |
20.4 |
56.1 |
23.5 |
|
Thousand kernel weight |
38.0 |
23.2 |
38.8 |
The variances associated with environment effects were larger than the variances associated with genotypes effects for all quality traits (except thousand kernel weight and hardiness index) indicating the relatively greater influence of environment factors and less influence by genotypic effects. The environment contributed more than 50% only in PC (83.6%) and HLW (56.1%). The dominant contribution of environment over that of the genotype and GEI was detected for protein content, accounting for 83.6% of sum of squares. According to Williams et al., protein content was one of the most responsive traits since it was predominantly affected by environment and GEI [13]. The greater significance of environmental variation for protein content in bread wheat, in this study, is in agreed with the results of Drezner et al., and Bilgin et al., stating strong environmental impact on bread wheat protein content [12,14]. Many other studies demonstrated that environmental conditions have a larger effect on protein content than the genotype [15,16]. The three components, G, E and GxE made almost similar contribution to most of the quality traits (WG, DG and GI), although the contribution of the environment was a little higher. Hardness index was determined mainly by the genotype (69.3%). Strong genotype effects for hardness should be expected when cultivars of different hardness have been tested because hardness is relatively simply inherited [13]. The contribution of GxE was higher than that of genotype in all quality traits except in HDI and GI, again indicating the important role of GxE in the determination of wheat quality traits. Panozzo and Eagles found that the relative influence of GEI was greater than that of genotype on the variability of some quality traits but this was always less than the influence of environment [18].
Mean Comparison of the Genotypes for Grain Quality
The differences among the genotype were important. The HLW of the genotypes ranged from 66.58 to 73.56 kg/hl and TKW ranged from 27.32 to 40.89g) (Table 5). The result of this finding was in line with finding of Zhang et al., who reported that the range in thousand kernel weight and hectoliter weight among environments (29.3–39.6 g and 74.1–78.8 kg/hL) was somewhat larger than that measured across genotypes (31.0–38.0g and 75.5–77.4 kg/hL) [19]. The highest mean values of HLW were observed from genotype ETBW9045 (73.56 kg/ hl) while the lowest mean values of HLW were obtained from genotype ETBW9464 (66.58 kg/hl) (Table 5). The highest mean value of TKW was obtained from ETBW9470 (40.89g), while the lowest was that of ETBW8075 (27.32g) (Table 5). Generally, the results of the HLW and TKW demonstrated that the environmental and wheat genotypes could affect the grain physical characteristic and hence the flour yield and enduse quality. Previous reports showed that environmental conditions and fertilizers application had a significant impact on the HLW and TKW of various wheat genotypes [20-22]. The highest mean values of hardness index was observed from genotype ETBW9466 (#13), while the lowest hardiness index from Hiddase (#15).
Wheat grain protein is of primary importance in determining the end use quality of the flour and variations in both protein content and composition could significantly affect the flour quality. In this result protein content varied from 13.93 to 15.05 %. This result was in agreed with finding of Taghouti et al., who reported that the protein content of the genotypes varied from 12.52 to 16.28% with an average value of 14.58% [23]. This result also was in line with the finding of Brankovic et al., who reported that protein content was varied from 12.4 to 15.4% in bread wheat [24]. The differences among the genotype were important. Genotype ETBW8065, ETBW8484 and ETBW9464 gave the best value of protein in the favorable means (15.05%, 14.76% and 14.64% respectively (Table 5).
The genotypes used in the study gave rise to significant differences in wet gluten values. In this result the wet gluten ranged from 36 to 58% which is larger range of variation compared to variation of 24–40.5% for wet gluten content reported in bread wheat by Bilgin et al., [14]. Similarly higher and wider range in comparison to results Brankovic et al., who reported that the wet gluten content ranged from 22.8% to 30.3% for bread wheat genotypes [24]. The highest mean value for wet gluten was obtained for Hidasse (58.82%), while the lowest value was recorded for genotype ETBW8427 (36.49%) (Table 5). The highest mean for dry gluten was obtained for variety Hiddase 24.38% while the lowest value was obtained for genotype ETBW8427 (12.81%) (Table 5). The determination of the gluten index is a widely used method for analyzing the gluten strength of bread wheat and durum wheat genotypes. The gluten index (GI) is a predictive method of gluten strength and thus it is a good indicator for gluten quality and quantity [25]. Among genotypes, the results showed that genotype ETBW9037 had the highest (82.23%) mean value of gluten index while genotype Hidase had the lowest (58.55%) mean value (Table 5). The released variety Hidasse (#15) had low hardiness index, protein content, and gluten index and high wet and dry gluten contents when compared with advanced genotypes (Table 5).
Table 5: Mean values of quality traits of bread wheat genotypes tested at six locations
|
SN |
Genotype |
HLW |
TKW |
HDI |
PC |
W G |
DG |
GI |
|
1 |
Lemu |
69.62d-f |
31.93e |
68.92ed |
14.3 c-f |
44.11cb |
16.82c |
73.33cde |
|
2 |
ETBW8070 |
73.38ab |
35.45b-e |
68.63ed |
14.27 c-f |
45.37cb |
17.13c |
65.20g |
|
3 |
ETBW8078 |
69.75de |
33.82de |
66.28gf |
14.36b-d |
44.7cb |
17.60cb |
71.44def |
|
4 |
ETBW8084 |
70.18c-e |
35.71b-e |
72.45cb |
14.3c-f |
45.43cb |
17.71cb |
67.16fg |
|
5 |
ETBW8311 |
70.62b-e |
31.4ef |
71.97cb |
14.29d-f |
44.57cb |
15.99cd |
72.60def |
|
6 |
ETBW8065 |
73.02ab |
34.56e |
71.94cb |
14.75ab |
46.12cb |
16.83c |
69.28efg |
|
7 |
ETBW8427 |
72.69a-c |
39.22ab |
71.78cb |
14.07 d-f |
36.49d |
12.81d |
78.97abc |
|
8 |
ETBW8459 |
71.13a-e |
33.18e |
79.62a |
14.51bc |
42.61c |
15.59cd |
76.43abcd |
|
9 |
ETBW9037 |
72.04a-d |
35.32b-e |
70.99cb |
14.63bc |
42.69c |
16.35c |
82.23a |
|
10 |
ETBW9045 |
73.56a |
38.66a-c |
70.52cd |
15.04a |
45.39cb |
17.85cb |
70.55defg |
|
11 |
ETBW8075 |
67.06ef |
27.32f |
67.68ef |
14.37c-e |
46.72cb |
17.66cb |
74.48cde |
|
12 |
ETBW9464 |
66.58f |
34.7c-e |
72.75b |
13.96ef |
44.46cb |
16.54c |
76.10bcd |
|
13 |
ETBW9466 |
69.73de |
31.93e |
80.43a |
14.27 c-f |
41.26cd |
15.18cd |
80.69ab |
|
14 |
ETBW9470 |
70.31a-e |
40.89a |
65.07g |
13.92 f |
48.35b |
20.56b |
79.17fg |
|
15 |
Hidasse |
69.76 |
38.21a-c |
41.0h |
13.94ef |
58.82a |
24.38a |
58.55h |
|
|
Mean |
70.56 |
35.07 |
69.66 |
14.34 |
45.23 |
17.29 |
73.79 |
|
LSD0.5 |
2.71 |
4.47 |
1.29 |
0.4 |
3.52 |
2.11 |
6.59 |
Values with the same letter in a column are not significantly different
Where: HLW= hectoliter weight, TKW= thousand kernel weight, HDI= hardiness index, PC= protein content, WG=, wet gluten content, DG=dry gluten content, GI=gluten index, LSD=Least significance difference.
Difference between Environments for Grain Quality
Wide ranges in all quality parameters and significant differences among samples collected from the various locations were observed. When locations were compared, the highest hectoliter weight was obtained from Holeta, while lowest from Asasa. Kulumsa, Arsi Robe and Holeta had greater than over all mean of HLW and Asasa, Dhera and Bekoji had low HLW less than over all mean. There the difference in TKW between all six locations. Arsi Robe had high TKW when compared to other location followed by Kulumsa and Asasa had low TKW. The highest hardiness index was obtained from Holeta while the lowest hardness index obtained from Dhera.
Wheat samples from Dhera are characterized by high protein content (16.43%) and wet gluten(52.2%) when compared with other locations., while the lowest protein content and wet gluten content obtained from Arsi Robe. According to locations means the wet gluten contents of all wheat genotypes in the current study are more than 32.27%. Recently, in a multi-environment trial for Turkish wheat genotypes the wet gluten content was varied from 28 to 37% depending on the variation in the environment, genotype, and their interaction [22]. Concerning growing area, dry gluten content was higher at Asasa (19.54%) followed by Dhera (19.23%) and Kulumsa (18.87%), while the lowest mean value of dry gluten content was obtained from Arsi Robe (11.79%) (Table 4). Throughout the six growing environments, the highest mean value for gluten index obtained were 78.18% and 78.06% at Asasa and Arsi Robe respectively, while the lowest value (60.36%) was observed at Holeta (Table 4).
Table 6: Mean values of quality traits of bread wheat at six locations
|
Loc |
HLW |
TKW |
HDI |
PC |
WG |
DG |
GI |
|
KUL |
70.76c |
36.64b |
68.98c |
15.31b |
48.83a |
18.865a |
69.25c |
|
ASA |
66.42e |
30.89e |
66.78d |
15.36b |
51.63a |
19.538a |
78.18a |
|
DHE |
69.57d |
35.14c |
62.85e |
16.43a |
52.2a |
19.238a |
75.41ab |
|
BKJ |
68.97cd |
34.89c |
72.77ab |
13.52c |
40.99c |
15.507b |
72.26b |
|
ARO |
72.44b |
38.97a |
71.55b |
11.53d |
32.27d |
11.788c |
78.06a |
|
HOL |
75.68a |
32.37d |
73.10a |
13.85c |
44.93b |
18.667a |
60.36d |
|
Mean |
70.67 |
34.82 |
69.34 |
14.33 |
45.14 |
17.27 |
72.25 |
|
CV |
2.26 |
8.20 |
5.17 |
5.02 |
21.69 |
33.95 |
25.08 |
|
LSD% |
2.72 |
1.29 |
1.29 |
0.26 |
3.5 |
2.1 |
3.8 |
Values with the same letter in a column are not significantly different
ARO= Arsi Robe, ASA= Asasa, BKJ= Bekoji, DHE= Dhera, HOL= Holeta and KUL=Kulumsa
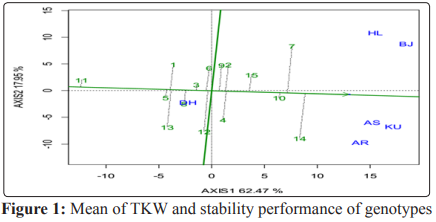
GGE biplot analysis demonstrated that ETBW9470 (G14), ETBW8427 (G7) and ETBW9045 (G9) were the most superior genotypes for TWT (Figure 1). A longer projection to the AEC ordinate, regardless of the direction, represents a greater tendency of the GE interaction of a genotype, which means it is more variable and less stable across environments or vice versa. For instance, genotype G3 (ETBW8078) and G8 (ETBW8459) were more stable as well as low TKW. Considering simultaneously high mean and stability, Genotype G9 (ETBW9037), G2 (ETBW8070) and G15 (Hiddase) showed the best performances (Figure 1), suggesting their adaptation to a wide range of environments. Conversely genotype G7 (ETBW8427) and G14 (ETBW9470) both had high TKW, but were less stable. Genotype G11 (ETBW8075) was the least stable with low TKW and had a large contribution to the GEI, having the longest distance from the average environment (Figure 1).
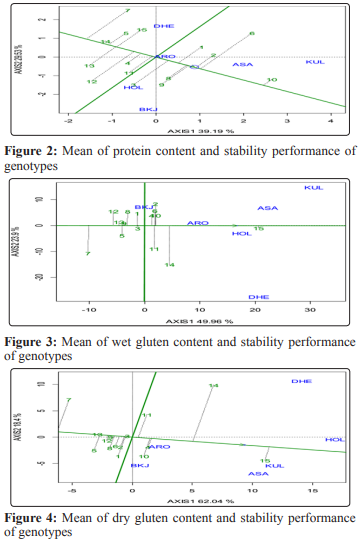
The genotype ETBW9045 (G10), ETBW8065 (G6) and ETBW9037 (G9) had high protein content when compared with other genotypes (Table 5). GGE biplot analysis demonstrated ETBW9045 (G10), ETBW8065 (G6) and ETBW9037 (G9) were the most superior genotypes for TWT (Figure 2). The genotype G4 (ETBW8084) and G11 (ETBW8075) were more stable. The genotype G4 (ETBW8084) has low protein content(less than over all mean) but, G11 (ETBW8075) high protein content which is greater than mean. The genotype G6 (ETBW8065) has high protein content, but was less stable. Genotype G7 (ETBW8427) was the least stable with low protein content and had a large contribution to the GEI, having the longest distance from the average environment (Figure 2).
Based on the GGE biplot analysis Hidasse (G15), ETBW9470 (G14) and ETBW8065 (G6) were the most superior for wet gluten content (Figure3). The genotype ETBW8078 (G3), ETBE9037 (G9), ETBE8084 (G4) and ETBW9045 (G10) were the most stable. The genotype ETBW8078 (G3) and ETBE9037 (G9), had low wet gluten content. Genotype ETBE8084 (G4) and ETBW9045 (G10) had high wet gluten content. Genotype ETBW9470 (G14) has high wet gluten content and less stable (Figure 3). Genotype ETBW8427 (G7) was least stable and has low wet gluten content (Figure 3). The GGE biplot analysis of the dry gluten content also identified Hidasse (G15), ETBW9470 (G1) and ETBW9045 (G10) as the most superior genotypes (Figure 4). The genotype ETBW8078 (G3) and ETBE8084 (G4) were the most stable. The genotype ETBW8078 (G3) has low dry gluten content. Genotype ETBW8084 (G4) has high dry gluten content. Genotype ETBW9470 (G14) has high dry.
Gluten content and less stable (Figure 4). Genotype ETBW8427 (G7) was least stable and has low dry gluten content (Figure 4). GGE biplot declared ETBW9045 and ETBW8065 as stable genotypes for quality traits across locations. The GGE biplot analysis allowed identification of superior genotypes for quality-related traits. However, genotypic superiority based on the GGE biplot analysis, as shown by GGE rank, differed for quality traits among the genotypes. The superior genotypes were not the same for the individual quality traits. However, a few genotypes were stable for quality-related traits. This is in agreement with the results published by Grausgruber et al., who reported the possibility of identifying wheat genotypes stable for multiple quality traits [7, 26-29].
Conclusion
A quality trait of grain was affected by genotype, location and their interactions. Growing location had significant effect on quality traits. Significant differences among wheat genotype according to analyzed quality parameters were established. This difference was based on genetic specificity of wheat genotype according to expression of quality characteristics and genotype reaction to environmental factors which were different in year of investigation. The results showed that the genotype ETBW9045 had excellent HLW and genotype ETBW9470 had excellent TKW. Genotype ETBW9045 (15.05%) and ETBW8065 (14.75%) gave the best value of protein content. The Hidase had the highest value of wet gluten (58.2%) and dry gluten (24.38%) in average for all investigated locations (58.2%). According to locations means, both protein and wet gluten content was measured at location Dhera.
Acknowledgements
The authors would like to acknowledge the financial support provided by Delivering Genetic Gain in Wheat (DGGW) Project and Ethiopian Agricultural Research Institute for conducting the field trials. The authors also would like to acknowledge Kulumsa Agricultural Research Centre for the support in facilitating the field work and allocating the required labor and materials for field work and National wheat breeding program staff for all the assistance. Finally I acknowledge Kulumsa Agricultural and Nutritional Research quality laboratory.
References
- Peterson CJ, Graybosch RA, Shelton DR, Baenziger PS (1998) Baking quality of hard red winter wheat: Response of cultivars to environments in the Great Plains. Euphytica 100: 157-162.
- Sharma RC, AI Morgounov, HJ Braun, B Akin, M Keser, et al. (2010) Identifying high yielding stable winter wheat genotypes for irrigated environments in Central and West Asia. Euphytica 171: 53-64.
- Abugalieva A, Peña RJ (2010) Grain quality of spring and winter wheat of Kazakhstan. Asian Austral. J. Plant Sci. Biotechnol 4: 87-90.
- Mikhaylenko GG, Z Czuchajowska, BK Baik, KK Kidwell (2000) Environmental influences on flour composition, dough rheology, and baking quality of spring wheat. Cereal Chem 77: 507-511.
- Collaku A, SA Harrison, PL Finney, DA Van Sanford (2002) Clustering of environments of southern soft red winter wheat region for milling and baking quality attributes. Crop Sci 42: 58-63.
- Guttieri MJ, Jeffrey CS, O’Brien K, Souza E (2001) Relative sensitivity of spring wheat grain yield and quality parameters to moisture deficit. Crop Sci 41: 327-335.
- Grausgruber H, M Oberforster, M Werteker, P Ruckenbauer, J Vollmann (2000) Stability of quality traits in Austrian-grown winter wheats. Field Crops Res 66: 257-267.
- Baric M, Sarcevic H, Keresa S (2001) Genetic diversity of winter wheat varieties (Triticum aestivum L.) for quality stability. Book Abstr. 3rd Croatian Congr. Cereal technologists, Int. Particip. Flour-Bread 01. Opatija.
- Finlay GJ, Bullock PR, Sapirstein HD, Naeem HA, Hussain A, et al. (2007) Genotypic and environmental variation in grain, flour, dough and bread-making characteristics of western Canadian spring wheat. Can. J. Plant Sci 87: 679-690.
- Williams RM, O’Brien L, Eagles HA, Solah VA, Jayasena V (2008) The influences of genotype, environment, and genotype environment interaction on wheat quality. Australian Journal of Agricultural Research 59: 95-111.
- AACC (2000) Approved Methods of the American Association of Cereal Chemists. AACC, St. Paul, MN.
- Drezner G, Dvojkovic K, Horvat D, Novoselovic D, Lalic A (2007) Environmental impacts on wheat agronomic and quality traits. Cereal Res Comm 35: 357-360.
- Zecevic V, Knezevic D, Boskovic J, Micanovic D, Dozet G (2010) Effect of nitrogen fertilization on winter wheat quality. Cereal Res. Commun 38: 244-250.
- Bilgin O, Korkut KZ, Baser I, Daglioglu O, Ozturk I, et al. (2010) Variation and heritability for some semolina characteristics and grain yield relations in durum wheat (Triticum durum Desf). World Journal of Agricultural Sciences 6: 301-308.
- Mut Z, Aydin N, Bayramoglu HO, Ozcan H (2010) Stability of some quality traits in bread wheat (Triticum aestivum) genotypes. J. Environ. Biology 31: 489-495.
- Surma M, Adamski T, Banaszak Z, Kaczmarek Z, Kuczynska H, et al. (2012) Effect of genotype, environment and their interaction on quality parameters of wheat breeding lines of diverse grain hardness. Plant Production Science 15: 192-203.
- Mikulíková D, Masár S, Horváthová V, Kraic J (2009) Stability of quality traits in winter wheat cultivars. Czech J. Food Sci 27: 403-417.
- Panozzo JF, Eagles HA (2000) Cultivar and environmental effects on quality characters in wheat 2. Protein. Australian Journal of Agricultural Research 51: 629-636.
- Zhang Yong, He Zhonghu, Guoyou Ye, Zhang Aimin, Maarten Van Ginkel (2004) Effect of environment and genotype on bread-making quality of spring-sown spring wheat cultivars in China. Euphytica 139: 75-83.
- Li Y, Y Wu, N Hernandez Espinoza, RJ Pena (2013) The influence of drought and heat stress on the expression of end-use quality parameters of common wheat. J. Cereal Sci 57: 73-78.
- Bouacha OD, S Nouaigui, S Rezgui (2014) Effects of N and K fertilizers on durum wheat quality in different environments.J. Cereal Sci 59: 09-14.
- Kaya Y, Akcura M (2014) Effects of genotype and environment on grain yield and quality traits in bread wheat (T. aestivumL.). Food Sci. Technol, Campinas 34: 386-393.
- Taghouti M, Gaboun F, Nsarellah N, Rhrib R, El Haila M, et al. (2010). African Journal of Biotechnology 9: 3054-3062.
- Brankovic G, Dodig D, Pajic V, Kandic V, Knezevic D, et al.(2018) Genetic parameters of bread wheat and durum wheat genotypes for technological quality properties in Serbia. Zemdirbyste-Agriculture 105: 39-48.
- Gyula Vida, László Szunics, Ottó Veisz, Zoltán Bedo, László Láng, et al. (2014) Effect of genotypic, meteorological and agronomic factors on the gluten index of winter durum wheat. Euphytica 197: 61-71.
- Crossa J, Gauch HG, Zobel RW (1990) Additive main effects and multiplicative interaction analysis of two international maize cultivar trials. Crop science 30: 493-500.
- Fister R, Petricevic S (1999) Quality of most represented wheat varieties of Koprivnica region in the period 1993–1999. Book Abstr. 2nd Croatian Congr. Cereal technologists, Int. Particip. Flour-Bread 99.Opatija.
- Makawi AB, AI Mustafa, IA Mohamed Ahmed (2013) Characterization and improvement of flours of three Sudanese wheat cultivars for loaf breadmaking. Innov. Roman Food Biotechnol 13: 30-44.
- Rharrabti Y, Villegas D, Royo C, Martos-Núñez V, García del Moral LF (2003) Durum wheat quality in Mediterranean environments: II. Influence of climatic variables and relationships between quality parameters. Field Crop Res 80: 133-140.