


Research Article - (2024) Volume 9, Issue 2
Establishing the Anti-Hyperglycemic Potency of Ethanol Extract of Moringa Oleifera Leaf on albino rat: Focusing on Optimization of Biomarkers of Type 2 Diabetes
2Department of Food Science and Technology, Michael Okpara University of Agriculture, Umudike, Abia State. ORCID. Philippa C. Ojimelukwe: 0000-0002-0263-0597, Nigeria
Received Date: Feb 01, 2024 / Accepted Date: Feb 23, 2024 / Published Date: Mar 14, 2024
Copyright: ©Â©2024 Patrick Udofia, et al. This is an open-access article distributed under the terms of the Creative Commons Attribution License, which permits unrestricted use, distribution, and reproduction in any medium, provided the original author and source are credited.
Citation: Udofia, P., Ojimelukwe, P. C., Ukom, A., Olaoye, O., Ekanem, M. (2024). Establishing the Anti-Hyperglycemic Poten-cy of Ethanol Extract of Moringa Oleifera Leaf on albino rat: Focusing on Optimization of Biomarkers of Type 2 Diabetes. Adv Nutr Food Sci, 9(2), 1-9.
Abstract
In this study, the antihyperglycemic activity of ethanol extract of the leaf of Moringa oleifera (MO) was investigated. It was aimed at ascertaining the efficacy of MO ethanolic extract as an antihyperglycemic agent. To achieve the aims, streptozotocin (STZ) induced type 2 diabetic rats were treated with iterative levels of the plant ethanolic extract (X1). The time of exposure (X2) of the rats to the extract and time of storage of the leaf sample before extraction (X3) were monitored. Handling and the treatment of the rats followed strict adherence to the guidelines of the Committee for the Purpose of Control and Supervision of Experiments on Animals. The biomarkers of type 2 diabetes in the rats were esti- mated using standard methods. Optimization analysis on the data revealed that 100% of the plant extract would require 41.84 days of exposure of the rats to the plant extract to reverse streptozotocin induced diabetes. The potency of the shade dried leaves would be retained up to 50days of storage and would produce 106.76mg/dl of blood glucose, 158.49 g of body weight, 6.85% (as red blood count), 166.64 mg/mL, 20.00 mg/mL of MDA, 0.556 g of kidney at 53.0% desirability. It was observed that the extract exhibited ameliorative effect on the diabetic biomarkers of the rats. From the results, it could be concluded that ethanol extract of the M. oleifera can retain the anti-hyperglycemic activity and safety claims. However, more work needs to be carried out with higher doses and longer exposure time of the extract in animal models and possibly human volunteers, to extend the research to clinical studies.
Keywords
Hyperglycaemic, Biomarkers, Haematological Parameters, Polyphenolic Compounds, Moringa Oleifera Leaves
Introduction
Traditionally, the deployment of edible plants in nutrition is as old as mankind [1]. The treatment and management of many health problems with plants is a common and varied practice the worldwide Welz and especially in developing economies [2]. Availability, affordability, renewability of plant products and the perception of the consumers that most natural products are safe endear many people to the plant and plant products [3]. According to lowering standards of orthodox medical products and services and the inefficacy of many synthetic drugs have further increased the prevalence of consumption of botanicals [4]. These situations have compromised effective orthodox treatment of many diseases because consumption of the botanicals is done without professional advice and supervision . Supervision determines the type, dosage of new substances, and period of exposure of the animal to the product. Therefore, absence of supervision does lead to toxicity, morbidity, low level of economic productivity and even deaths. The experience has called for in-depth investigations into the claims of efficacy and safety of many plant edibles.
M. oleifera Lam. is one of the underutilized edible plants in the study area [5-7]. Generally, the leaf of M. oleifera is deployed to fight against malnutrition in children and nursing mothers . The plant is of the Moringaceae family, consisting of up to 13 species . It can tolerate the poor agronomical conditions of the tropics, it is drought resistant. There are some perceptive, and scientific claims that the leaf has some disease-healing and nutritional properties; and management of diabetes . Therefore, the leaf of Moringa is claimed to treat nervous debility, malaria, paralysis, asthma, ulcer, infection, cough, fever, high blood pressure, inflammation because it is a rich source of saponins, flavonoids, phenols, alkaloids, tannins, phytates, steroids and terpenoid [8,9]. Since there is split opinion on the matter, an investigation on the claim of anti-hyperglycemic power and safety of ethanol extract of the leaf of M. oleifera using the response surface methodology (RSM) focusing on the optimization of some biomarkers of the streptozotocin (STZ)-induced Type-2 diabetic albino rats to determine the optimal concentration of the plant extract, exposure time of the rats to the extract, and period of storage of the leaf before extraction have become imperative. The design optimizes a response (output variable) which is influenced by several independent variables concentration of plant extract (X1), time of exposure (X2), and sex (X3) of the rats assuming the relationship in equ. 1.
Yn = β0+β1X1 + β2X2 + β3X3 + β 12X1X2 + β13X1X3
+ β23X2X3 + β11X12 + β22X22 + β33X32 1
where Yn is any predicted value, β0 is offset term, β1 is linear effect, β12 is p effect, and β11 is quadratic effect, the main effects, X1, X2, and X3 represent average response of iterative change of predictor variables at a time from its lowest to highest levels. The interaction terms (X1X2, X1X3, and X2X3) represent the response when all the factors simultaneously change, the polynomial term X12, X22, X32 are to investigate nonlinearity. The aim of this study was to estimate the antihyperglycemic power of ethanolic extract of M. oleifera leaf on STZ-induced diabetic rats using the rotatable central composite design of the response surface methodology.
Materials and Methods
Material
Fresh leaf of M. oleifera was obtained from mature plants in Utu Ikpe Village, Ikot Ekpene Local Government Area of Akwa Ibom State, Nigeria. The plant was identified by the Herbarium Unit of the School of Applied Sciences, Department of Science Laboratory Technology, Akwa Ibom State Polytechnic, Ikot Ekpene.
Animal Models and Management.
Animal management, gathering, grouping, was carried out with strict compliance of the guidelines of the Committee for the Purpose of Control and Supervision of Experiment on Animals (CSCSEA, 2012). Sixty (60) healthy, mature Albino rats (Rattus norvegicus) with weight range of 201±5.0g were obtained from the Animal House, Department of Pharmacy and Pharmacognosy, University of Uyo, Nigeria. The rats were quarantined and acclimatized for two (2) weeks, during which they were fed with rodent mash and water ad libitum (Grand Bendel Ltd, Edo State). They were maintained under standard conditions of 12 h light/dark cycles at about 27.0±2.0oC. The rats were randomly selected and assigned to different cages for treatment.
Determination of Acute Toxicity of Ethanol Extract of Leaf of m. Oleifera
The LD50 of the extracts was estimated on mature rats. They were injected intraperitoneally using the modified method of Sevda et al. (2017). The LD50 experiment was carried out in phases as follows:
Phase 1
The animals were fasted for 18 hours, thereafter they were weighed and grouped into 4 rats per group of 200±5 g. Each group of 4 rats received arbitrary dosage of the ethanol extract at 250, 500, 750, 1000 and 1250 mg/kg body weight (ip) and was observed for physical signs of toxicity and mortality within 24 hours. LD50 was calculated according to equation 3.
![]()
Phase 2
For maximum dosage, of the extract, the rats were equally fasted for 18 hours before they were weighed and grouped into 3 of 200±5 g. Each group of 3 rats were dosed 1500, 1750, 2000 and 2250 mg/kg of the extract (ip) and was observed for physical signs of toxicity and mortality within 24 hours. Based on these observations LD50 of the extract on the mice was calculated according to equation 3.
![]()
where, A = maximum dose which produced 0% mortality; B = minimum dose which produced 100% mortality
Induction of Experimental Type-2 Diabetes
Type 2 diabetes was induced in the rats according to the method of Mohamed and Laurence (2011). After 18-hour fasting, the rats were intraperitoneally injected 120 mg/kg (body weight) with freshly prepared streptozotocin (STZ) in distilled water solution. After 48 h post-streptozotocin injection, fasting blood glucose concentration of the animals was determined using the Oxidase-based Commercial Glucometer (Accuchck axtive, Roche Diagnostic) according to the manufacturer’s instructions. Rats which exhibited fasting blood glucose of ≤ 250 mg/dl were considered diabetic and included in the experiment.
Determination of Biomarkers In Albino Rats
Haematological and diabetic biomarkers of the animals were determined according to the method adopted by using the Automatic Haematologic Analyzer (Sysmex KX-21).
Optimization of Biomarkers of Diabetic Albino Rats
Optimization of the biomarkers and other health parameters of the rats was carried out by the Central Composite Design (RCCD) (Table 1) in order to estimate parameters of full second-degree models and building a quadratic model for accurate estimation of responses [11]. The small option of the design with twenty (20) experimental runs was generated with the Design-Expert Version 12 of Stat-Ease, Inc., 2021 East Hennepin Avenue Suite 480 Minneapolis, MN 55413, USA using concentration of the leaf’ extract (X1), exposure time of animals to the extract (X2) and sex of the animal models (X3). The experimental design is shown in Table1.
|
Independent variables |
Unit |
-α |
-1 |
0 |
1 |
+α |
|
Conc. (X1) |
% |
12 |
0 |
50 |
100 |
72 |
|
Exposure time (X2) |
day |
20 |
0 |
50 |
100 |
120 |
|
Storage time of plant sample (X3) |
Day |
0.79 |
0 |
25 |
50 |
2.21 |
Table 1: Layout of Rotatable Central Composite Design (Rccd)
Each factor was varied over 5 levels: -plus, and minus α (axial point), plus minus 1 (factorial point) and the center point. The design used the small option with 10 center point, 15 runs and α of 1.414. (Rotatable design), no replication and 1 star point
In this study, the 2nd-order coefficients were generated by regression analysis with stepwise and backward elimination. Responses were initially fitted for the individual factors by the partial least squares’ regression analysis. The fit of the models was assessed by the coefficient of determination (R2) and analysis of variance (ANOVA). The insignificant factors and the terms were eliminated from evaluation and the models were finally defined.
Calculation of the Middle Level in RCCD
Given the minimum and maximum levels, middle, and alpha levels of the variables in RCCD were calculated from equ. 2 and 3.
Xi-real = Xreal+1 + Xreal. -1
+ Xreal+1 - Xreal-1 - Xi.code 4
Xi.real is the real value of any coded value, Xi.code, Xreal.+1, and Xreal.-1 are the upper and lower real levels corresponding to coded levels + and -1.
Calculation of the Α Values
Xpq = [-1] integer [2|p-1|] (5)
Where p: 1,2, ..., n is the row number in the coded 2n factorial design q: 1, 2 …, 2n is the column number (trial number) in the coded 2n factorial design. Table 2 presents set factors levels and responses of the experiments for the biomarkers.
Administration of Ethanol Extract of Leaf of m. Oleifera on Diabetic Rats
Concentration of 0 to 100% of ethanol extract of leaf of M. oleifera was administered orally to the rats for thirty (30) days using graded concentration of the extract and gender of the animal models as independent variables according to the experimental design in Tables 1 and 2 and according to the method of).
Blood Collection and Determination of Hematological Parameters
At the end of each experimental run, blood samples were taken through the ear vein of the rat with sterile syringes each into a labeled, sterile bottle. Ethyl diamine tetra acetic acid (EDTA) powder was the anti-coagulant in use. The samples were stored and used for determination of red blood cell count (RBC) and diabetic markers [12].
Results
Table 2 presents experimental runs, blocks, graded values of independent variables (X1 to X3) and dependent variables (Y1 to Y7).
|
Runs |
Block |
X1 |
X2 |
X3 |
Y1 |
Y2 |
Y3 |
Y4 |
Y5 |
Y6 |
Y7 |
|
4 |
1st |
100 |
100 |
0 |
98 |
220 |
7.45 |
300 |
21.71 |
300 |
0.501 |
|
6 |
1st |
100 |
0 |
50 |
245 |
107 |
6.23 |
170 |
12.45 |
298 |
0.605 |
|
11 |
1st |
50 |
50 |
25 |
83 |
111 |
6.01 |
75 |
21.09 |
300 |
0.506 |
|
12 |
1st |
50 |
50 |
25 |
79 |
116 |
6.5 |
71 |
20.11 |
298 |
0.506 |
|
9 |
1st |
50 |
50 |
25 |
91 |
120 |
6.91 |
89 |
19.9 |
287 |
0.576 |
|
3 |
1st |
0 |
100 |
0 |
213 |
90 |
4.99 |
201 |
12.13 |
180 |
0.561 |
|
5 |
1st |
0 |
0 |
50 |
213 |
80 |
4.12 |
200 |
12.89 |
178 |
0.506 |
|
1 |
1st |
0 |
0 |
0 |
220 |
79 |
7.79 |
287 |
11.89 |
173 |
0.581 |
|
10 |
1st |
50 |
50 |
25 |
89 |
115 |
5.11 |
102 |
19.98 |
289 |
0.419 |
|
8 |
1st |
100 |
100 |
50 |
69 |
226 |
7.9 |
301 |
22.11 |
321 |
0.509 |
|
2 |
1st |
100 |
0 |
0 |
220 |
90 |
6.01 |
298 |
12.9 |
162 |
0.605 |
|
7 |
1st |
0 |
100 |
50 |
221 |
89 |
4.76 |
276 |
11.94 |
168 |
0.657 |
|
19 |
2nd |
50 |
50 |
25 |
82 |
122 |
4.23 |
100 |
20.21 |
300 |
0.512 |
|
18 |
2nd |
50 |
50 |
68 |
80 |
123 |
5.33 |
98 |
20.21 |
298 |
0.634 |
|
16 |
2nd |
50 |
134 |
25 |
93 |
200 |
6.9 |
254 |
19.21 |
162 |
0.566 |
|
15 |
2nd |
50 |
34 |
25 |
223 |
92 |
5.79 |
289 |
11.98 |
165 |
0.56 |
|
17 |
2nd |
50 |
50 |
17 |
84 |
100 |
5 |
170 |
12.16 |
170 |
0.569 |
|
13 |
2nd |
34 |
50 |
25 |
213 |
98 |
5.41 |
288 |
11.23 |
166 |
0.5 |
|
14 |
2nd |
134 |
50 |
25 |
100 |
229 |
7.5 |
297 |
22.12 |
298 |
0.51 |
|
20 |
2nd |
50 |
50 |
25 |
77 |
115 |
5.64 |
167 |
16.32 |
176 |
0.65 |
|
X = Independent variables: X1 = % concentration of ethanolic extract of M. oleifera, X2 = Exposure (in days), X3 = Sex of animal model (male=1, female=2). (Yn) = Responses: Y1 = Blood glucose (mmol/l), , Y2 = Body weight (g) , Y3 = Red blood cell concentration (%) , Y4 = Glutathione (GSH) , Y5 = Malonaldehyde (MDA) Umol/g , Y6 = Superoxide dismutase (mmol/ml) , Y7 = Weight of kidney (g). |
|||||||||||
Table 2: Independent and Dependent Variables
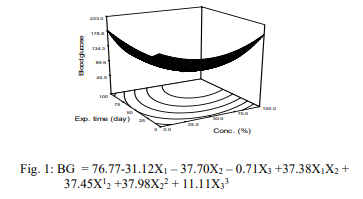
Blood Glucose Level
Figure 1 presents variation of blood glucose level in the diabetic rat at subnormal and normal treatment. The blood glucose levels decreased in the diabetic rats (≤220 mg/mL) to sub-normal (120 mg/mL), and normal (95 mg/mL) rats with an increase in the concentration of the extract and period of exposure of the rats to the extracts. Analysis of variance on the data revealed that the model of blood glucose was significant (p<0.05), predictable R2=0.9962,with a mean value of 139.65 mg/mL (Fig. 1). Equ. 3 shows strong contribution of the variables to the model to the parameter. The observation in the work agrees with the trend reported by Ewis and on ‘effect of metformin on glutathione and magnesium in normal and STZ-induced diabetic rats. The slight differences could be attributed to nutritional status, and age of the rats.
Body Weight
Figure 2 presents the relationship between body weight of diabetic rat to dose of extract and exposure time. The Figure shows that the weight of diabetic rats increased with doses and exposure time of rats to the extract. Body weight of the diabetic rats were lower than that of normal rats. The trend is elucidated by Fig. 2, equ. 7
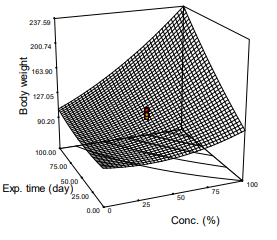
Figure 2: Response Surface Plot of Body Weight Against Exposure Time and Concentration of the m. Oleifera extract
Body weight (g) = 84.11 - 0.297X1 + 0.159X2 + 0.011X1X2 + 0.004X 2 - 0.0067X 2 (7)
According to Figure 2, rats gained weight as treatment progressed according to the dose administered and time of exposure to the extract. Analysis of variance on the body weight data revealed that the model was significant (p< 0.05), R2 = 0.8895, and mean body weight of 241.95 g was observed (Fig. 2 and Eq. 5). Stunting and death were observed in rats which did not receive the treatment. Rats treated with low dose of the extract at any exposure time exhibited low recovery from the effect of STZ. The result of the work was like the one reported by on safety of Moring products.
Red Blood Cell Count
Response of red blood count of STZ-induced diabetic rats to treatment with extract leaf of M. oleifera is presented in Figure 3. The result revealed that red blood cell count increased from the diabetic state (value of ≥11.25 to 15.88 mmol/L) to normal value as the dose of the extract and time increased (Fig. 3, Equ. 6). Analysis of variance on the data showed that the model appeared significant (p<0.05) with the coefficient of coefficient, R2 = 0.5663. The mean value of the parameter was observed to be 5.98 mg/mL. The observation in the work agrees with that of who reported a rapid increase in red blood cell count and packed cell volume in diabetic rat treated with extract of M. oleifera. There were reports of variations in some haematological parameters in the blood samples of STZ-induced diabetic rats treated with Teucrium orientale extract according to [13]. The differences in the observations could be attributed to the differences in age, season, extraction solvent and methodology deployed.
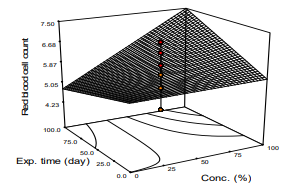
Figure 3: Response Surface Plot of Red Blood Cell Count Against Concentration and Exposure Time of m. Oleifera extract on the Animal Models.
Red blood cell count = 6.46 - 011X1 - 0.0091X2 - 0.030X3 + 0.006X1X2 - 0.00048X1X3 (8)
Glutathione
Effect of concentration of glutathione in the blood serum samples of the STZ-induced diabetic rats is presented in Figure 4. The values ranged from 75 mg/mL to 300 mg/mL in diabetic and rats fully treated with the extract, respectively. The result revealed that all the diabetic rats at the beginning of the experiment exhibited glutathione deficiency of approximately 70-98 mg/mL, the level increased with the increase in the dose, period of exposure of the rats to the extract. Mathematical model of the glutathione was significant (p<0.05), regression analysis, forward elimination method showed a linearity coefficient of (R2 = 0.8880), the mean of the parameter was 166.25 mmol/L and standard deviation of 30.61 (Fig. 4; eq. 6) showed steady increase of the value of the parameter at a dose- and exposure time-response trend. The period of storage of the leaf did not show any effect on the parameter (Fig. 4, Equ. 9). The observation agreed with the observation of who reported on the effect of M. oleifera on antioxidant status of diabetic rats.
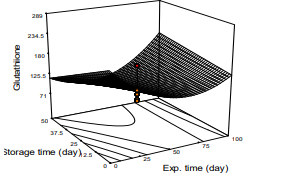
Figure 4: Response Surface Plot of Glutathione Count Against Concentration and Exposure Time of M. Oleifera Extract on Diabetic Rat.
Glutathione = 285.58 - 2.59X1 - 3.10X2 – 2.216X 3 + 0.029X1X2 +
0.027X 2 + 0.024X X2 (9)
Malondialdehyde (MDA)
Effect of dose of Moringa leaf extract and exposure of diabetic the rats to the extract showed significant effect on the level of MDA levels in STZ-induced diabetic rats (Figure 5). According to the Figure, MDA level was reduced significantly (p<0.05) from 0.50 to 0.94 mg/mL in the diabetic rats and the fully treated normal rats respectively. The model of MDA was significant (p<0.05), the coefficient of linearity was R2=0.8930, and mean of 16.63 mg/mL, the model also showed that the differences of the parameter values 1 2 among the rats was not wide (standard deviation of 0.0780. Fig. 5 and Equ. 7 show trends of the variation with changing value and contribution of each independent variable to the parameter. The observation in the work is like the report of) that SOD and MDA were increasing in STZ-induced diabetic Wister rat as treatment with extract of leaf of Moringa continued. Also reported that grape and black rice anthocyanins could effectively limit oxidation stress in vitro and in vivo due to increased levels of antioxidant.
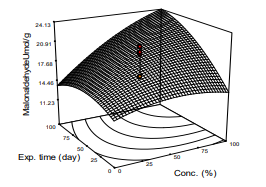
Figure 5: Response Surface Plot of MDA Against Exposure Time and Concentration of M. Oleifera Extract Administered on the Animal Models.
MDA =11.58 + 0.060X1 + 0.0627X2 + 0.002x3 + 0.00095X1X2 –0.00051X 2 - 0.00067X 2 + 0.00023X 2 (10)
Superoxide Dismutase (SOD)
Serum concentration of SOD of STZ-induced type 2 diabetic Albino rats which were treated with ethanolic extract of leaf of M. oleifera increased from 170 to 300 mmol/mL in diabetic to normal (fully treated rats) respectively. Mathematical model of the parameter was significant (p<0.05), R2=0.682, Adj. R2=0.5918). the analysis of variance showed the mean of 234.0 mg/mL, the increment of SOD concentration exhibited steady increment towards normal value of ≤300 mmol/ml as treatment with the plant extract progressed. Fig. 6 and Eq. 8 are pictorial and mathematical responses respectively of the interaction between the parameter and the extract. The equation further shows the magnitude of influence of the independent variables on the parameter. The observation agreed with the values which were reported by on ‘increased SOD levels in STZ-Nicotinic-induced diabetic Albino rats to normal within a week of treatment with Moringa extract’. on ‘effect of Egyptian M. oleifera Lam. on blood haematology, serum biochemical parameters and lipid profile with special reference to kidney function in Albino rats’ reported a stable value of SOD of about 220 mmol/ml of the parameter. The slight variations observed among the results could be attributed to experimental design, source of plant materials, and solvents of extraction.
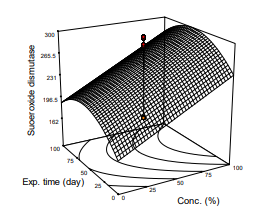
Figure 6: Response Surface Plot of Kidney Weight Against Exposure Time and Concentration of M. Oleifera Extract Administered on the Animal Models
SOD =138.864 + 0.88X1+ 1.563X2+ 1.069X3- 0.13X 2 (11)
Weight of Kidney
Influence of weight of kidney of diabetic and fully treated, non-diabetic rats is presented in Table 2(Y7). The table shows that the diabetic organ was 0.553 and 0.501 g for the treated rat. ANOVA on the data revealed that the model was not significant (p>0.05) R2=22.03%. The observation is similar to the reports of Zafar and Naqvi (2010) who reported on effects of STZ-induced diabetes on the relative weights of kidney, liver and pancreas in Albino Rats.Differences in finding could be attributed to the breed and strain of the animal models, exposure time of the animal models could be too short to achieve total restoration.
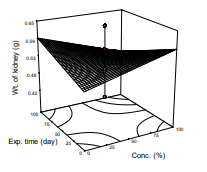
Figure 7: Response surface plot of weight of kidney against exposure and concentration of the test substance
Wt. of kidney (g) = 0.521 + 0.00072X1 + 0.00072X2 - 0.0000105X3 (12)
Discussions
Blood Glucose Concentration
Normal blood glucose level is an important biomarker in the diagnosis, treatment and management of diabetic and pre-diabetic conditions in human subjects. In our study, blood glucose concentration of STZ-induced diabetic rats on treatment decreased significantly (p<0.05) from ≤220 mg/dL to normal level of 70-90 mg/dl. The process showed concentration-exposure-time trend. Diabetes is a function of insulin resistance, insulin deficiency, and glucose toxicity, all due to malfunctioning of the pancreas apparatus. Any substance which can restore the factors is antidiabetic . In this study, rats treated with zero concentration of the extract retained higher blood glucose level ≤250 mg/dl, exhibited low body weight, high liver and kidney weight, and low antioxidants. The report of on significant contribution to the attenuation of nicotinic-induced pancreatic pathology by moringa product testifies to the potency of moringa to restore injured pancreas. Hypoglycemic potency of moringa leaf have been reported by reported the restoration of biological enzymes to normal levels by aqueous extract of Moringa leaf.
Body weight
Body weight of rats increased significantly (p<0.05) as treatment progressed at rates proportional to days of exposure and concentration of the extracts administered. Untreated animals continued to lose weight to states of morbidity. The observation was not surprising because diabetic state is accompanied with increased lipolysis, glycogenolysis, gluconeogenesis and decreased important biochemical activities which together waste tissue muscle protein[14]. The extract of the leaf of M. oleifera was implicated in the restoration and healing health state of the animals. This finding was similar to previous studies involving the use of M. oleifera in the treatment of diabetes. reported that ethanolic extract of M. oleifera leaf increased body weight of STZ-induced type 2 diabetes Albino rats. contributed the activity of Moringa to the content of polyphenolic compounds which are antioxidants [15].
Superoxide Dismutase and Glutathione
Superoxide dismutase (SOD) of the STZ-induced type 2 diabetes rats treated with 0 to 80% ethanolic extract of shade-dried leaf of M. oleifera for 40 days varied significantly (p<0.05). Reduction in the levels of SOD enzymes in the animals treated with low doses of the extract were not significant (p>0.05). Untreated animals did not exhibit good health throughout the period of exposure to the test substance. SOD is protective antioxidants enzymes against the formation of free radical in mammalian tissues. Issue integrity of antioxidants that determines development of diabetic complications was reported by [16]. Enzymatic antioxidant, SOD, is one of the primary enzymes that directly eliminates reactive oxygen species (ROS). It is an important defense enzyme and scavengers of O2 from H2O2, the intervention diminishes the toxic effects due to free radical injury from secondary reaction [17]. Besides, SOD inhibits diabetes mellitus due to non- enzymatic glycosylation and oxidation. In the present study, the reduction of SOD in the diabetic rats could be attributed to inactivation caused by STZ-generated ROS enhanced by the bioactive components in the plant extract.
Glutathione (GSH)
GSH plays an important synergistic role in defense against oxidative stress in mammalian models. The synthesis of GSH starts with the formation of α-glutamyl-cystine-cysteine, the reaction is catalyzed by α-glutamyl-cystine-synthase and addition of the glycerin moiety by glutamyl synthase. In normal blood plasma, the parameter was quoted as 10 mmol/L. The value of the parameter in this work varied between 106-220 Umol/g and was significantly (p<0.05) different among the animal models. The range of values are at variance with that reported by on ‘beneficial effect of the methanolic leaf extract of Allium hookeri on stimulating glutathione biosynthesis and preventing impaired glucose metabolism in type 2 diabetes’ [18]. Depletion of glutathione could arise from its utilization in diabetes[19]. The level of the parameter in the animals could be attributed to the high content of vitamin C in moringa leaf extract.
Malonaldehyde
Lipid peroxidation has a high positive association with hyperglycemia. Hyperglycemic subjects cannot secret insulin because beta-cells of the pancreas are not functional Under diabetic conditions tissue of animals turn to the use of fatty acid and acetyl-CoA . In this study, there was significant (p<0.05) reduction in the MDA. The content of oleic acid could enhance the release of insulin and early attainment of normalcy in insulin secretion and hence the ability to prevent peroxidation. The reduction of MDA in the animals exhibited dose- and concentration-response trend. The results suggest that the treatment with ethanol extract of M. oleifera leaf led to reduction in the MDA in diabetic rats reducing lipid peroxidation. which was also in agreement with reported similar result. The observation could be attributed to the healing property of M. oleifera on oxidative stress of ROS and endothelial cell dysfunction. respectively also reported healing of target organs of tested animal models. The slight differences may be attributed to the design of the work, experimental materials, and reagents. The above situation could explain the low-level MDA in the blood of treated animal models. The observation agrees with the findings of that Moringa product can protect tissue damage in the kidney and liver, hence lipid peroxidation [20].
Red Blood Cell
Low hemoglobin concentration is associated with low postprandial peptide concentration and low β-cell responsiveness. demonstrated that for each CKD stage, hemoglobin is 1 g/dL lower in patients with diabetes than in the non-diabetic population. In this work, red blood cell level was about 5.66 g/dL in all diabetic rats. The level increased to up to 7.5g/dL at the end of the experiment. Animals that received zero and low concentration of the plant extract retained low level of the parameter including weakness and stunting of the animal models. Since diabetic progression is a function of β-cell dysfunction as result of hypoxic damage to pancreatic islet cells, the increase levels in the red blood cell could be a function of the ameliorating effect of the phytochemicals in M. oleifera leaf. Restoration of the biomarkers of the Wister rat by the ethanolic extract of the M. oleifera suggests that the plant organ could be useful in the management of antihyperglycemic in the mammalian systems. Further works will be carried out in man when it is possible.
Author Contributions
Philippa C Ojimelukwe, originated the concept and supervised the work, she also edited the final manuscript; Olaoye O.A was the minor supervisor; Udofia, P. G., Ukom, A. N. Ekanem, M. C. carried out the experiments, collected, collated and analyzed the data. Every author proofread the work before it was sent for publication.
Funding
The work was partly sponsored by the Tertiary Education Trust Fund (TetFund).
Acknowledgements
We acknowledge all the establishments who permitted us to use their facilities to carry out the work: Department of Pharmaceutical Chemistry, University of Uyo, Nigeria, IITA, Ibadan, Ministry of Science and Technology, Akwa Ibom State. Nigeria, the typist, Miss Sandra Thompson.
Conflicts of Interest
Authors agreed there was no conflict of interest.
References
- Sharma, N., Gupta, P. C., & Rao, C. V. (2012). Nutrient content, mineral content and antioxidant activity of Amaranthus viridis and Moringa oleifera leaves. Research Journal of medicinal plant.
- Abalaka, M. E., Daniyan, S. Y., Oyeleke, S. B., & Adeyemo,S. O. (2012). The antibacterial evaluation of Moringa oleifera leaf extracts on selected bacterial pathogens. Journal of Microbiology research, 2(2), 1-4.
- Fahey, J. W. (2005). Moringa oleifera: a review of the medical evidence for its nutritional, therapeutic, and prophylactic properties. Part 1. Trees for life Journal, 1(5), 1-15.
- Debebe, M., Afework, M. E., Makonneen, E., Debella, Geleta,B. (2017) Evaluation of biochemical, hematologivcal and histopathological parameters of sub-chronic administration of ethanol extraction of Albizia gunmifera seed in albino Wistar rat. J. Clin Toxicol 7:337. doi: 10.4172/2161-0495.1000337.
- Iqbal, S., & Bhanger, M. I. (2006). Effect of season and production location on antioxidant activity of Moringa oleifera leaves grown in Pakistan. Journal of food Composition and Analysis, 19(6-7), 544-551.
- Zaku, S. G., Emmanuel, S., Tukur, A. A., & Kabir, A. (2015). Moringa oleifera: An underutilized tree in Nigeria with amazing versatility: A review. African Journal of Food Science, 9(9), 456-461.
- Zhou, K., Wang, H., Mei, W., Li, X., Luo, Y., & Dai, H. (2011).Antioxidant activity of papaya seed extracts. Molecules, 16(8), 6179-6192.
- Jongrungruangchok, S., Bunrathep, S., & Songsak, T. (2010). Nutrients and minerals content of eleven different samples of Moringa oleifera cultivated in Thailand. Journal of Health Research, 24(3), 123-127.
- Mutiara, T., Titi, E. S., & Estiasih, W. (2013). Effect lactagogue moringa leaves (Moringa oleifera Lam) powder in rats. J. Basic Appl. Sci. Res, 3(4), 430-434.
- Sevda, G., Khosrow, K., Asgjar. G. (2017) A practical guide for induction of type-2 diabetes in rat: Incorporating ahigh-fat diet and streptozotocin. Journal of Biomedicine and Pharmacotherapy, (95): 605-613.
- Hu, R. (2017). Food product design: a computer-aided statistical approach. Routledge.
- Adedapo, A. A., Mogbojuri, O. M., & Emikpe, B. O. (2009). Safety evaluations of the aqueous extract of the leaves of Moringa oleifera in rats. Journal of medicinal plants Research, 3(8), 586-591.
- Veerasamy, S., Vijayam, B., Arunachalam, P., and Madhuri,S. B. (2008). Abnormal” Fasting Plasma Glucose during Pregnancy. Diabetes Care,31(12): e92-e92.doi.org/10.2337/ dc08-1553.
- Tahmasebpour, N., Dehghan, G., Feizi, M. A. H., & Esmaeili,H. A. (2013). Variation in body weight and some hematological parameters in streptozotocin-induced diabetic rats, treated with Teucrium orientale. Pharmacology online, 3, 32-6.
- Adeeyo, A. O., Adefule, A. K., Ofusori, D. A., Aderinola, A. A., & Caxton-Martins, E. A. (2013). Antihyperglycemic effects of aqueous leaf extracts of mistletoe and Moringa oleifera in streptozotocin-induced diabetes Wistar rats. Diabetologia Croatica, 42(3).
- Dachana, K. B., Rajiv, J., Indrani, D., & Prakash, J. (2010). Effect of dried moringa (Moringa oleifera lam) leaves on rheological, microstructural, nutritional, textural and organoleptic characteristics of cookies. Journal of Food Quality, 33(5), 660-677.
- Dachana, K. B., Rajiv, J., Indrani, D., & Prakash, J. (2010). Effect of dried moringa (Moringa oleifera lam) leaves on rheological, microstructural, nutritional, textural and organoleptic characteristics of cookies. Journal of Food Quality, 33(5), 660-677.
- Darmaun, D., Smith, S. D., Sweeten, S., Sager, B. K., Welch, S., & Mauras, N. (2005). Evidence for accelerated rates of glutathione utilization and glutathione depletion in adolescents with poorly controlled type 1 diabetes. Diabetes, 54(1), 190-196.
- Barsha, D., .Sagar, R. B. , Simanta, B., Bhaswati, K., Prasenjit,M. , Jagat, C. B. , Narayan, C. T. (2021). Beneficial effect of the methanolic leaf extract of Allium hookeri on stimulating glutathione biosynthesis and preventing impaired glucose metabolism in type 2 diabetes. Arch Biochem Biophys. doi: 10.1016/j.abb.2021.108961.
- Verma, A. R., Vijayakumar, M., Mathela, C. S., Rao,C.V. (2009). Phyto-chemistry of Moringa oleifera. Food Chemistry and Toxicology, 47(9): 2196-3001, doi: 10.4236/ ajps.2021.123021
- Dorcely, B., Katz, K., Jagannathan, R., Chiang, S. S., Oluwadare, B., Goldberg, I. J., & Bergman, M. (2017). Novel biomarkers for prediabetes, diabetes, and associated complications. Diabetes, metabolic syndrome and obesity: targets and therapy, 345-361.
- Garima Mishra, G. M., Pradeep Singh, P. S., Ramesh Verma R. V., Sunil Kumar, S. K., Saurabh Srivastav, S. S., Jha, K. K., & Khosa, R. L. (2011). Traditional uses, phytochemistry and pharmacological properties of Moringa oleifera plant: an overview.
- Ijarotimi, O. S., Adeoti, O. A., & Ariyo, O. (2013). Comparative study on nutrient composition, phytochemical, and functional characteristics of raw, germinated, and fermented Moringa oleifera seed flour. Food science & nutrition, 1(6), 452-463.
- Mahmood, Khawaja Tahir, Tahira Mugal, and Ikram Ul Haq. "Moringa oleifera: a natural gift-A review." Journal of Pharmaceutical Sciences and Research 2, no. 11 (2010): 775.
- Lal, M. A., Körner, A., Matsuo, Y., Zelenin, S., Cheng, S. X., Jaremko, G., ... & Aperia, A. (2000). Combined antioxidant and COMT inhibitor treatment reverses renal abnormalities in diabetic rats. Diabetes, 49(8), 1381-1389.
- Mishra, G., Singh, P., Verma, R., Kumar, S., Srivastav, S., Jha,K. K., & Khosa, R. L. (2011). Traditional uses, phytochemistry and pharmacological properties of Moringa oleifera plant: An overview. Der Pharmacia Lettre, 3(2), 141-164.
- Omodanisi, E. I., Aboua, Y. G., & Oguntibeju, O. O. (2017). Assessment of the anti-hyperglycaemic, anti-inflammatory and antioxidant activities of the methanol extract of Moringa oleifera in diabetes-induced nephrotoxic male wistar rats. Molecules, 22(4), 439.
- Sharifudin, S. A., Fakurazi, S., Hidayat, M. T., Hairuszah, I., Aris Mohd Moklas, M., & Arulselvan, P. (2013). Therapeutic potential of Moringa oleifera extracts against acetaminophen-induced hepatotoxicity in rats. Pharmaceutical Biology, 51(3), 279-288.
- Shunmugapriya, K., Vennila, P., Thirukkumar, S., & Ilamaran,M. (2017). Identification of bioactive components in Moringa oleifera fruit by GC-MS. Journal of Pharmacognosy and Phytochemistry, 6(3), 748-751.
- Thurber, M. D., & Fahey, J. W. (2009). Adoption of Moringa oleifera to combat under-nutrition viewed through the lens of the “Diffusion of Innovations” theory. Ecology of food and nutrition, 48(3), 212-225.
- Trigo, C., Castello, M. L., Ortola, M. D., Garcia-Mares, F. J., & Desamparados Soriano, M. (2020). Moringa oleifera: An unknown crop in developed countries with great potential for industry and adapted to climate change. Foods, 10(1), 31.
- Udofia, P. G., Udoudoh, P. J., Okon, A. A., & Ekanem, M. L. (2008). Synergistic effect of temperature of acetone extraction of Piper guineense on maize weevil (Stitophylus zea mays) by mixture experimental design. Advances in Natural and applied Sciences, 2(2), 43-49.
- Veerasamy, S., Vijayam, B., Arunachalam, P., and Madhuri,S. B. (2008). Abnormal Fasting Plasma Glucose during Pregnancy. Diabetes Care,31(12): e92-e92.doi.org/10.2337/ dc08-1553.
- Welz, A. N., Emberger-Klein, A., & Menrad, K. (2019). The importance of herbal medicine use in the German health-care system: prevalence, usage pattern, and influencing factors. BMC health services research, 19, 1-11.
- West, I. C. (2000). Radicals and oxidative stress in diabetes.Diabetic medicine, 17(3), 171-180.