Journal of Applied Language Learning(JALL)
ISSN: 3068-1332 | DOI: 10.33140/JALL


Research Article - (2026) Volume 3, Issue 1
Education and Skilled Labour Market in Rapid Economic Growth
2Research Centre, Economic Department, University of Oxford, United Kingdom
Received Date: Jan 05, 2026 / Accepted Date: Feb 04, 2026 / Published Date: Feb 13, 2026
Copyright: ©2026 Walid Y Alali, et al. This is an open-access article distributed under the terms of the Creative Commons Attribution License, which permits unrestricted use, distribution, and reproduction in any medium, provided the original author and source are credited.
Citation: Knight, J., Alali, W. Y. (2026). Education and Skilled Labour Market in Rapid Economic Growth. J App Lang Lea, 3(1), 01-33.
Abstract
China had a seven million increase from one million in college admissions between 1998 and 2009; this growth is related to a decrease in the young workers' premium for college. On the other hand, older workers' college premiums went up throughout that time. We demonstrate that the driving cause is the growing need for trained labour. We develop a general equilibrium theory that lets the supply of skilled labour be determined endogenously and takes into account two aspects of human capital: education and labour market experience. Although the availability of education is flexible, gaining experience in the workforce requires time. Young workers' college premiums will drop due to a demand shock that causes a rapid expansion of colleges; nevertheless, experienced college graduates are in high demand and will see a temporary increase in premiums. Young people continue to pour money into institutions despite a low upfront cost because they believe education will pay off greatly in the long run.
Keywords
Economic Growth, Demand and Supply of Labor, Human Capital, Skills, Labor Markets
Introduction
Universities enrollments in China increased to seven from one million between 1998 and 2009, a 17.5% annual growth rate (Figure 3). This growth is associated with an increase in the number of university graduates entering the job market and a bonuses decrease for young workers (Figures 1 and 4, Results). According to have shown that the decline in university supply can be explained by supply shocks caused by university expansion policies [1-4]. University capacity has increased rapidly since 1999, despite the Chinese government limits. While training costs for older workers have increased over the same period, this proposal ignores the fact that (First row, Figure 1). These changes to training allowances for junior and experienced workers suggest that: As highlighted in the seminal study by Card and Lemieux, why should tuition costs increase for experienced workers when they are not ideal replacements? is unknown [5]. It remains. Additionally, other fast-growing countries such as South Korea, Taiwan, and Thailand do not have strict quota systems.
The proportion of students enrolled in university and the labour market shows a similar trend. During the period of high economic growth from 1980 to 2000, university enrollments soared, and tuition fees for young workers similarly fell, as did tuition fees for experienced workers. pink [6-8]. These papers’ Proof from these economies implies that variables apart from supply at work, with a demand shock to skilled worker candidate being the most plausible choice.
In this paper, we develop a theory that demonstrates how a surge in demand for skilled workers can be the main factor driving the labour market trends in rapidly growing economies. In this article, we develop a theory of general equilibrium to demonstrate that the observed labour market trends in quickly developing economies may be primarily attributed to a surge in demand for qualified people. Following previous studies, we assume a competitive labour market, however, we supply and model labour demand differently. For labour supply, we analyze human capital from two perspectives: education and labour market experience. We also consider skilled labour supply as being driven by natural factors.
Human capital is not only developed in schools but also through workplace training and job experience. Since the fundamental work of Mincer and Becker, economists have recognised that labour market experience can be a significant predictor of salaries [9,10]. The literature on diffusion and technological development highlights the significance of operational experience and experiential learning, rather than formal education, in the progress, integration, and technology adoption [11,12]. Empirical evidence indicates that companies give preference to employees with experience rather than those without [13,14].
For labour supply, we consider her two dimensions of human capital: education and labour market experience, allowing us to endogenously determine the availability of skilled labour. Gaining experience takes more time in the job market than getting an education. This means that the supply of semi-skilled labour is more flexible than the supply of highly skilled labour. Our approach is different modelling from, for labour demand [15]. Companies produce products which are unique in an environmental competitive and each company's productivity depends on whether it employs the same types of workers or whether the market is considered competitive. We recognize that it varies depending on the Our approach to modelling labour supply and demand differs from previous studies. This means that the productivity gap between different types of workers within a firm may not be the same as the wage gap in the market. Therefore, although workers are considered ideal replacements in each firm's production process, they cannot be substituted in equilibrium. In our proposal, we propose that for young and experienced workers a rise in college premiums for individuals may follow distinct patterns following a demand shock.
Meantime this paper shows that demand shock is lacking, the net supply shock associated with university enrollment cannot cause the labour market dynamics in China. Supply shocks would result in reduced salaries for medium- and high-skilled workers even though they might increase the number of highly educated workers. Stated differently, a supply shock lowers the experience premium and the tuition premium in the absence of a demand shock, lowering the lifetime returns on education.
Our study complements as there is an increasing amount of research that investigates the variations in the wage premium for university graduates and wage disparity over time in the USA [16,17]. The primary factor driving pay dynamics in the US is the rising demand for skills, especially driven by skill-oriented technological change [18-22]. Delivery of university graduates in the employment market; Reflective of labour markets revised the quality of university graduates [15,23-28].
We differ from previous studies in the following ways. First, whereas previous studies have generally focused on one aspect of skill, namely education, We study how experience and education have changed over time. The concept that the availability of experience is typically unresponsive to changes, while the availability of education is adaptable, results in a fascinating interaction. Second, we assume that supply reacts endogenously to demand shocks, in contrast to earlier research that either assumes a fixed number of college graduates or an exogenously variable supply. found that experience or investment and job learning are endogenous [29]. Our model is essentially the same as theirs, with the exception that we do away with endogenous experience selection and concentrate on how labour market dynamics can be explained by the inelasticity of experience supply.
The following policy implications result from our findings. Considering the recent decline in wages, university graduates' salaries have become contentious. The question of whether China has too many university graduates and whether the government should limit the higher education expansion topics discussed in the Republic of China [21,30,31]. Indeed, during the rapid expansion of higher education, comparable issues in non-Ejes Graduates and excessive education have led to other East Asian countries, such as South Korea and Taiwan [2,32]. According to our view, the significant advantages of lifelong learning fully justify individual choice, and this expansion is a response to the rising demand for human capital Our data also demonstrates the need for long-term thinking in human capital development programmes. As we've seen, in the early phases of economic development, education can grow quickly, but gaining experience in the workforce takes time. In certain ways, even while they can temporarily boost college enrollment, emerging nations cannot match the optimal levels of human capital found in established economies. According to Nelson and Pack, the unavoidably protracted process of gathering enough expertise to integrate or assimilate current technologies is the reason why some Asian economies' growth slows down [33]. Raising educational and material standards are vital but by no means adequate, prerequisites for assimilation. Only in the long run do the biggest advantages of educational progress become apparent. China's mainland, Taiwan and South Korea are excellent models. Since the 1980s, enrollment at South Korean and Taiwanese institutions has grown quickly, raising the standard of education and producing a workforce of highly skilled individuals. According to Nelson et al., these two economies are now imitations of innovation [33]. Section 2%'s empirical observations on wages, human capital, and potential economic demand shocks with rapid growth economics comprise the test of the remaining portion. The theoretical model in Section 3 is established, and numerical simulations simulating the reported facts are carried out in Section 4. Section 5 our conclusions.
Fast-Growing Countries: Human Capital - Wages
This section presents empirical data on the development in China of human capital and wages. We next examine the potential presence of demand shocks that are linked to fluctuations in the labour market, specifically the growth of foreign direct investment (FDI), which has led to an increasing need for highly skilled workers. Lastly, we will now demonstrate comparable discoveries from other rapidly developing economies like Taiwan, Korea, and Thailand.
Republic of China: Human Capital - Wages
The Chinese labour market has a focus on human capital development and long-term returns. We utilize data obtained from the NBSC (National Bureau of China Statistics) annual (UHS), Urban Household Survey, which was conducted from 1990 to 2009. Following the modification of the survey instrument UHS in 1992, most of the analysis began in 1992 rather than 1990. The RHS (Rural Household Survey) is currently not available.
UHS obtains demographic and basic employment data for each member of the sample household. This is a rotating panel, (1/3) of the sample that is replaced annually, and the entire sample is refreshed every three years. All states, save Tibet, are accessible. The study focuses on salary patterns for workers aged 16 to 60 and hence excludes the self-employed. The sample size remains at 943,753, with an annual average of 57,683. Table A1 shows the mean values for each year's most important variables. In addition to this home dataset, we employ various statistical yearbooks to offer macro-level data, such as the China Educational Statistics Yearbook 1980–2013, China Business Yearbook 1980–2013, and the Statistical Yearbook 1980–2013 of China.
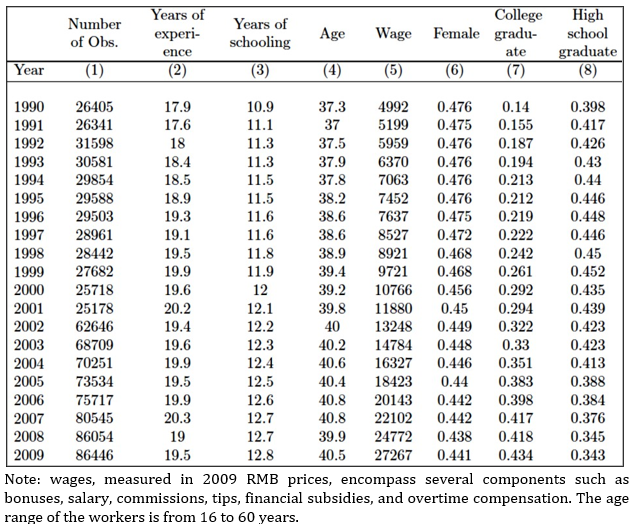
Table A1: Summary of Worker Statistics in Urban China: An Analysis of the Urban Household Survey
i. College Premium
Note: In this research, the log wage serves as the dependent variable. Its estimation is conducted through cross-sectional regressions for every age group and year. The fixed effects of province, college dummy, and gender are the independent variables.
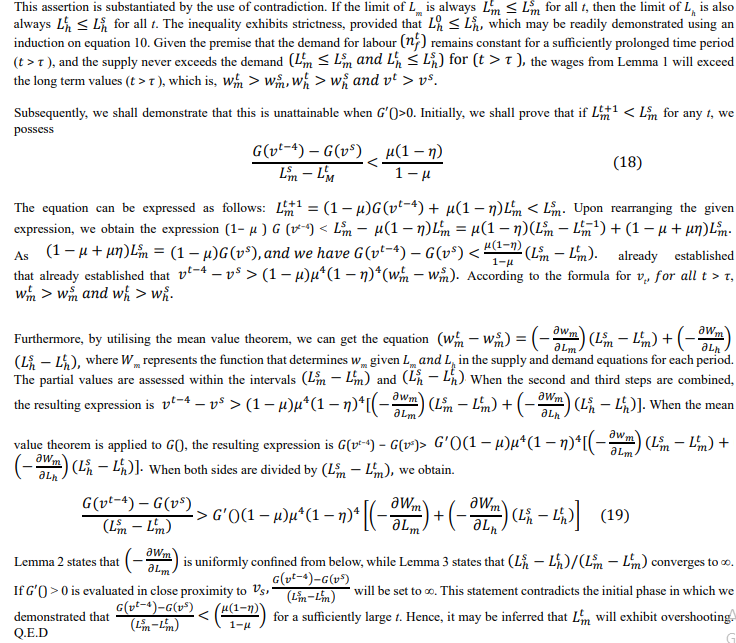
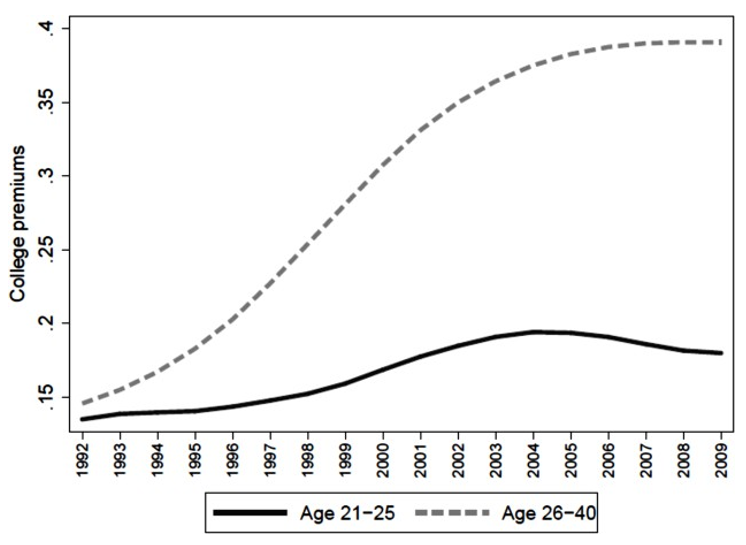
Figure 1: Displays the Disparity in College Premiums Between Inexperienced Workers (aged 21-25) and Experienced Workers (aged 26-40) in Urban China
The concept of the "college premium" refers to the financial advantage that individuals with a college education tend to have over those without one. In our analysis, we use the Mincer equation to estimate the differences in college premiums between two age groups: Novice workers, aged 21 to 25, and seasoned workers, aged 26 to 40. In addition, we consider gender and province fixed effects to mitigate their impact on the outcomes. Based on Figure 1, the premium college wage for inexperienced workers showed a steady increase, starting at 5.4% and reaching its peak at 23.4% between 1992 and 2004, after which it started to decline. By 2009, the percentage had declined to 15.2%, representing an almost 35% fall from the peak in 2004. Nevertheless, there was a notable discrepancy in the rate of growth in the college pay advantage for seasoned employees in comparison to those with little experience. The former experienced a significantly (mid-1990s) faster increase, and this expansion continued even after 2004, while the latter experienced a fall in the college premium during this period. By 2009, it had reached a level of 39.6%. We employ a sample of people who possess a minimum of a high school diploma to calculate the college premium. We utilize a sample of persons who possess a minimum of a high school diploma in order to calculate the premium for the college. The projected figures for each year are documented in Table A2. The anticipated statistics for each year are documented in Table A2. The general patterns for the remaining age groups, notably those aged, age group 26–50, age group 31–40, age group 41–50, and age group 51–60, display similarities. The results remain constant when experience is measured in terms of the duration of work experience instead of age. Similarly, the examination of the college premiums is carried out using a sample that encompasses all individuals, rather than solely those who possess a high school diploma. Refer to Table A2.
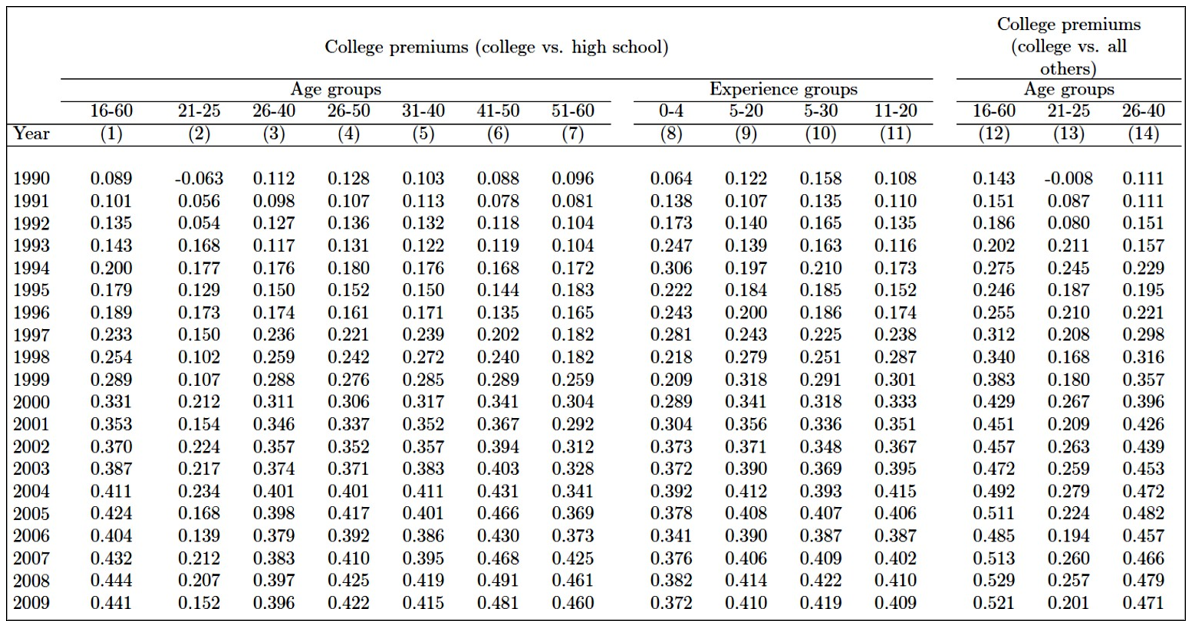
Notes: Cross-sectional regressions are employed to estimate the college premiums for each age group or experience group in each year. The independent variables considered in this analysis are a college dummy variable, gender, and provincial fixed effects. The sample of individuals with a minimum of a high school degree is utilised in columns 1-11. The variable representing the number of years of experience is defined as the disparity between the present year and the year in which the individual commenced their employment.
Table A2: Wage Premiums in College Based on Age or Years of Experience
These findings indicate that the calculation of the college premium for the entire workforce may be deceptive in the China context. In order to incorporate the impact of age on college premiums, it is essential to adjust the equation of Mincer to incorporate an interaction term that considers both education and age. Furthermore, the disparity in college premiums between individuals with experience and those without experience undergoes significant adjustments as time progresses. Consequently, the interaction term changes as time passes, which implies that the anticipated college premium value at a certain point in time may vary from the college premium all through an individual's entire existence. The latter is more significant for an individual who is deciding to invest in education.
ii. Ten-Year Return to Education
The aforementioned findings indicate that cross-sectional projections of educational premiums are deceptive. To exemplify this, we calculate the ten-year college premium duration of an individual's life, which serves as a more accurate representation of the actual lifetime benefit. For every group, we select a subset of persons between the ages of 22 and 31 as our sample. The age of 22 represents the year when a college graduate begins participating in the labour market. We used their salary data for ten years. Consider the birth cohort of 1970 as an illustration. This group, assuming they attended college, joined the workforce in 1992. We select individuals who were born in 1970 and who have completed either a college or high school education from the data collected between 1992 and 2001. By utilising this combined sample, we do a Mincer regression analysis to get the mean college premium for the initial decade following graduation for the group born in 1970. Refer to Refer to Table A3 for predicted figures, the patterns seen in the age group 26-50, as compared to the age group 21-25, exhibit a high degree of similarity. We may calculate for each cohort the average premium.
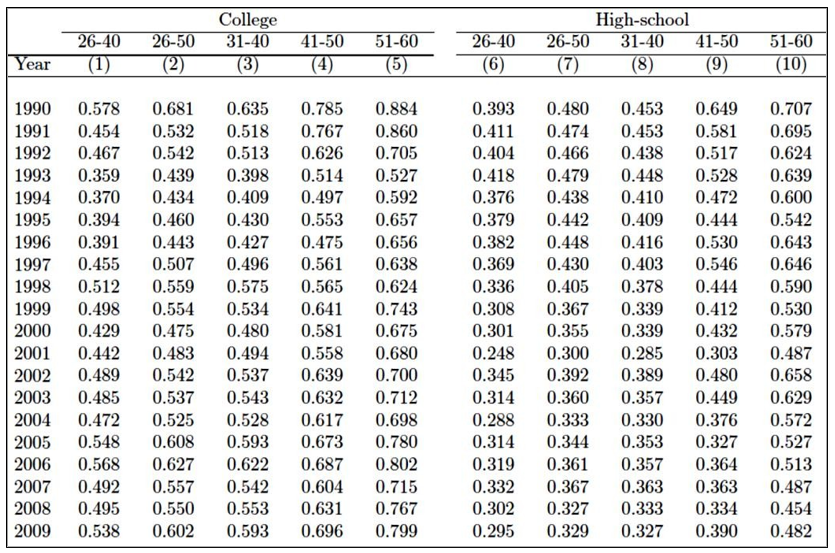
Notes: For each year, cross−sectional regressions are utilised to estimate the experience premiums for high school graduates (columns 6−10) and college graduates (columns 1−5) using the experience dummy, gender, and province fixed effects as independent variables. The experience dummy in each column is assigned the value 1 if the individual in question belongs to the specified age cohort (e.g., 26−40 in column 1), and 0 otherwise (e.g., 21−25 in column 2).
Table A3: An Analysis of Experience Premiums Across Various Age Groups
Note: The estimated college premium for a 10-year lifespan is calculated for cohort t, where t denotes the year in which a cohort of college graduates joins the labour market at the age of 22. Consider the year 1990 as an illustration. If the birth cohort of 1968 chooses to pursue higher education, they will join the workforce in 1990. The sample for this study consists of individuals born in 1968, encompassing both college graduates and high school graduates. The data collection period spans from 1990 to 1999. Utilising this combined sample, we do a Mincer regression analysis to calculate the mean college premium over the initial decade following college graduation, specifically for the cohort born in 1968 or the cohort entering college in 1990. The Mincer equation is utilised to estimate the cross- sectional (average) college premium within a given year. The estimation of the college premium for individuals aged 21-25 is conducted based on a sample of workers within this age range.
Figure 2: The 10-Year Lifespan of College Premiums in Urban China and Compares them with Cross-Sectional College Premiums
Figure 2 illustrates that the projected ten-year college premium is considerably higher than the premiums of the cross-sectional. In 1990, the premium college cross-sectional, which measures the average rise in individual earnings of that year for all ages, was only 8.9% during the calculation of the inaugural year. Nevertheless, the return on investment over the 10 years was much higher, reaching an impressive 29.2%. The discrepancy between the premium of the cross-sectional and the premium of the 10year for those aged 21-25 is substantially larger, with a 29.2% gap compared to almost no returns. The 10-year return showed substantial expansion over the years, increasing from 29.2% to 47.3% between 1990-1997. Subsequently, it encountered a slight decline but still maintained a level above 42%.
iii. Workers’ Education
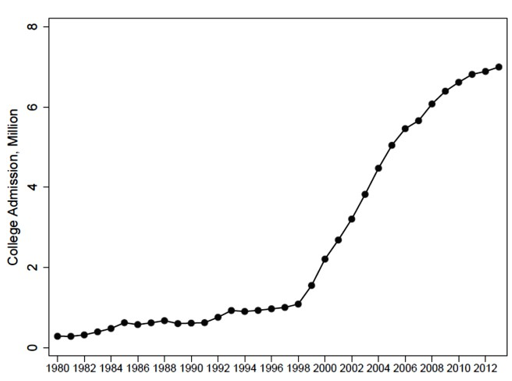
Figure 3: Chinese College Admissions from 1980 to 2013
China's increase in college enrolment has been unparalleled for the past (15) fifteen years. Figure 3 illustrates the college admissions consistent rise, which increased from (0.6 to 1.1) million between the years 1985 and 1998. This growth corresponds to a 4% annual growth. The Chinese government In 1999, the college expansion initiative was launched by raising 43% of the college entrance quota for that year, marking the largest yearly growth rate in 1978 college admissions. Between the years 1999 to 2009, new enrolment increased to 6.4 million, which means a 7.5% yearly growth. The enrolment gross rate for individuals aged 18 to 22 showed a substantial increase, climbing from 3.4% to 9.8% between 1990 and 1998, and further jumping to 30.0% in 2012. Chinese universities In 2012, the total number of enrolled students was 23.9 million.
Note: Yearbooks on Educational Statistics in China from 1980 to 2013.
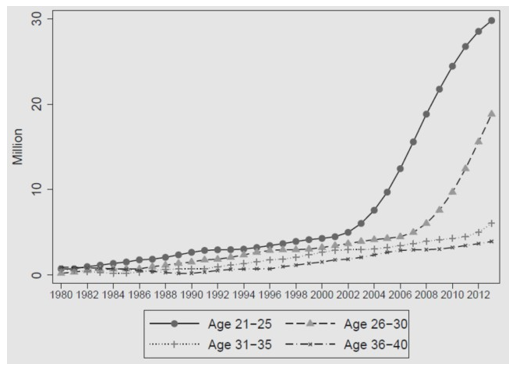
Figure 4: Illustrates the Distribution of College Graduates Across Various Age Groups in China From 1980 to 2013
The increasing enrolment quota signifies a rapid surge in the need for proficient labourers in China. MOE (The Ministry of Education) regulates the allocation of the enrolment quota to each province, taking into account local demand considerations. These criteria encompass the number of individuals applying to colleges in a specific year, the rate of acceptance in the preceding year, and the anticipated need for individuals with advanced skills in each province. Colleges may seek to expand their enrollment capacity by entering into discussions with the MOE (Ministry of Education). The ex-Vice Premier of China underlined the objective of meeting the country's national requirements. According to him, the main goal of the policy expansion for the colleges was to tackle and predict the increasing need for a skilled workforce. As a result of a substantial increase in the number of students enrolling in college, the educational attainment of workers, particularly young workers, has witnessed a huge increase. Figure 4 illustrates the proportion of individuals having a college degree who are now employed, categorized by age. The age groups include young adults with limited work experience (21-25 years) and older individuals with more extensive work experience (26-30 years, 31-35 years, and 36-40 years). The rate of increase for individuals aged 21-25 had the highest velocity, closely resembling the pattern noticed in college enrolment. As anticipated, there was a little lag in the pace of growth among older age cohorts.
iv. The Experience Premium
Next, we analyse the changes in experience premiums over time. The experience premium is the disparity in salaries (measured using logarithmic value) for the age categories between 26–40 and 21–25. In order to ascertain the disparity in earnings between individuals who have completed college and those who have just completed high school, we employ cross-sectional regressions. In these regressions, we analyse the relationship between wages and variables such as experience, gender, and province. Specifically, we consider individuals aged 26–40 as "experienced" (assigned a value of one) and those aged 21–25 as "inexperienced" (assigned a value of zero). We also account for fixed effects related to gender and province.
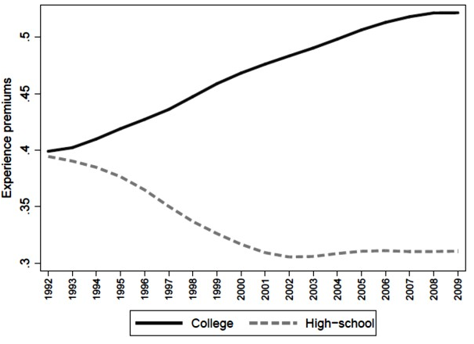
Note: In order to estimate experience premiums for each education category and year, cross-sectional regressions are utilised. In this analysis, the log wage is the dependent variable; the experience dummy variable (1 if age is 26-40, 0 if age is 21-25), gender, and province fixed effects comprise the independent variables. In the figure, the coefficients associated with the experience variable are displayed.
Figure 5: Illustrates the Experience Premiums of College Graduates Compared to High-School Graduates in Urban China
Figure 5 demonstrates that there are variations in the experience premiums between the education groups. The perceived significance of graduates' experience of high school reduced consistently between 1990-2002. Conversely for educated workers is much more distinct. Table A3 is the projected data. The patterns seen in other age groups 26–50, age groups 31–40, and age groups 41–50 (in comparison to the 21–25 age group), demonstrate a significant level of resemblance.

Note: The individuals belonging to the four cohorts were born during the years 1965-1969, 1970-1974, 1975-1979, and 1980-1984. The estimation of college premiums is conducted by cross-sectional regressions for each cohort and year. The dependent variable is the log wage, while the independent variables are the college dummy, gender, and provincial fixed effects.
Figure A1: The Age Profiles of College Premiums for Different Cohorts are Depicted
An issue of concern is that the increasing cost of insurance premiums for older college graduates may be attributed to a decrease in the overall quality of younger college graduates as a result of the expansion of college education. Although this statement is likely accurate, it appears that cohort effects alone do not provide a complete explanation. Prior to the proliferation of colleges, the premium for experience among college graduates began to rise. In addition, when we graph the age distribution of college premiums for various groups (Figure A1), we observe that the rate at which college premiums increase with age is higher for the youngest group.
The Demand for Highly Skilled Labour
Simultaneously with the increase in college enrollment, the Chinese economy experienced substantial changes. From 1990 to 2009, the GDP per capita increased from 799 international dollars adjusted for purchasing power parity (PPP) to 2,884 dollars. The work market undergoes changes as a result of and also due to the acceleration of economic growth. This study primarily examines the theoretical analysis of how the labour market changes in response to demand shocks.
Foreign Direct Investment (FDI) has had a substantial effect on the need for skilled workers in China, with its growth preceding the shifts in the labour market. China adhered to a policy of total seclusion from the global community until 1978. Nevertheless, it then altered its strategy and adopted a series of measures to promote FDI (foreign direct investment) and commerce. Since the early 1980s, a total of five Zones of Special Economic (SEZs), that have been created, which provide advantageous policies to encourage foreign direct investment (FDI). In addition, international investment has been allowed in 14 coastal cities, and two Free Trade Areas have been established. Furthermore, multinational corporations were granted favourable tax incentives and enjoyed decreased expenses for acquiring land throughout the entire country. Foreign-funded firms (FFEs) commonly enjoy an income tax exemption of a two-year and are eligible for three years following a 50% discount. In Special Economic Zones (SEZs), the five-year income tax was 18%. In contrast, in the open coastal cities and regions, the income tax rate was 27%. Meanwhile, local enterprises were imposed a tax rate of 33%. The advantageous tax conditions were eliminated in 2008.
The favourable measures for FDI started to provide favourable outcomes in the 1990s. In the regions of the southern coast in 1992, there was a notable surge in FDI. The figure rose from a humble $3 billion in 1990, equivalent to 1% of the country's GDP, to a significant $38 billion in 1995, making up 5% of the GDP. The Asian financial crisis had momentarily halted FDI development, but it resumed in 2001 in tandem with China's admission to the World Trade Organization (WTO). In 2003, China overtook the United States and became the leading recipient of FDI. The proportion of FDI in the industrial sector has experienced significant expansion, rising from 2.3% to 35.9% between 19902003. However, there has been a small decrease in recent years, with a drop to 26% in 2011. Currently, joint ventures and fully foreign-owned companies account for the majority of FDI.
FDI can be categorized into four distinct forms:
• contractual JVs' (joint ventures),
• equity JVs, totally owned foreign enterprises, and
• joint explorations, mostly focused on offshore oil activities.
• FDI mostly consists of joint ventures (JV) and foreign enterprises that are held outright.
During the initial stages of the reform process, China exclusively permitted joint ventures. Starting in 1990, foreign enterprises that were fully owned demonstrated the most significant growth rate, representing over 50% of the FDI in 1999 [34].
Note: This study examines the China Commerce Yearbooks and Chinese Statistical Yearbooks from 1980 to 2013.
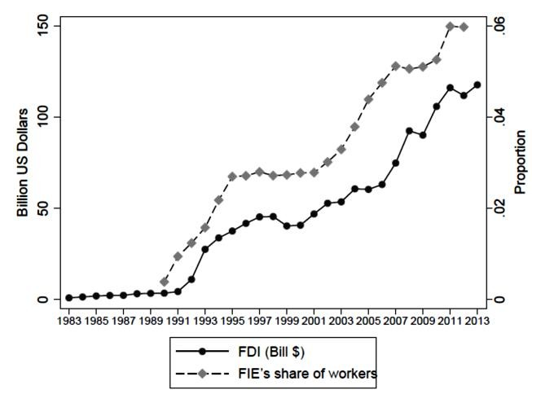
Figure 6: FDI and Employees in FIE (Foreign-Invested Enterprises) in China
Foreign firms made significant alterations to the local workforce. In 1990, the aggregate number of individuals employed by foreign corporations amounted to 0.7 million, it constituted less than 0.5% of the total workforce. While in 2012, had increased to 6.0% (over 22 million) of the workforce. Figure 6 displays the information. Foreign firms employ sophisticated manufacturing technology and managerial strategies, resulting in much higher labour productivity compared to local companies and [35-39]. The China Family Panel Studies (CFPS) were conducted in 2010, and a comprehensive household survey conducted in China found that 31% of individuals with a college degree were employed by international corporations. Conversely, the percentage of individuals holding a college degree who were employed in domestic private enterprises was 22%. In a separate study known as CHIP, it was shown that 37% of employees in international corporations possessed a college degree, whereas just 22% of employees in local private companies had the same level of education. Foreign firms also employed a higher proportion of highly skilled individuals, with 81% of their workforce consisting of individuals aged 25 years or older. In contrast, just 70% of employees in national private firms were within this age range.
Foreign companies undeniably enhance the worth of skilled persons by generating a robust demand for their services. Consequently, the considerable return on investment will greatly influence the development of human resources in China. In the following section, we will illustrate this concept in a theoretical manner, after presenting empirical evidence from different countries.
Other Developing Countries with Rapidly Growing
Similarly, other advancing economic countries like Korea, Thailand, and Taiwan have the same pattern Taiwan, Korea and Thailand [7,8,16]. All three economies experienced substantial and consistent growth rates, exceeding 7%, from 1980 to 2010. In 1980, 1982, and 1991, Taiwan, Korea, and Thailand respectively achieved a Gross Domestic Product (Purchasing Power Parity) per capita of $3,000. In Taiwan and Korea, after shifting workers to industrial from the agricultural sector in the 1960s, both economies experienced growth by concentrating on exporting industries that demanded advanced expertise and substantial capital investment. Their governments aggressively promoted the growth of enterprises with high value-added by implementing strategies such as establishing high-tech parks and offering financial assistance for private research and development. Through the effective development of these businesses that had high value-added, both economies witnessed substantial expansion in the 1980s [33,40-42]. Thailand's status can be likened to a 15-year lag behind Korea and a 5-year lead over China.

Note: The World Economic Outlook Database.
Figure 7: Illustrates the Rates of College Enrollment in Economies Experiencing Rapid Growth
Like China, the swift expansion of FDI and exports in Taiwan, Taiwan, Korea, and Thailand resulted in a substantial increase in the need for skilled labour. Figure 7 demonstrates a substantial rise in college enrolment rates for all three economies in the 5 to 10 years following the initial demand shock. In Korea, the college enrolment rate had a substantial rise during the 1980s, expanding from 13% to 37% between 1980 and 1990. Similarly, in Taiwan, the rate rose from 12% to 25% between 1983 and 1993. Around a decade later, Thailand also witnessed a similar pattern, with the enrolment rate increasing from 16% to 37% between 1990 and 2000.
Note: The studies conducted by Choi and Jeong in Korea, Baraka in Taiwan, and Mehta et al. in Thailand are as follows [6-8].
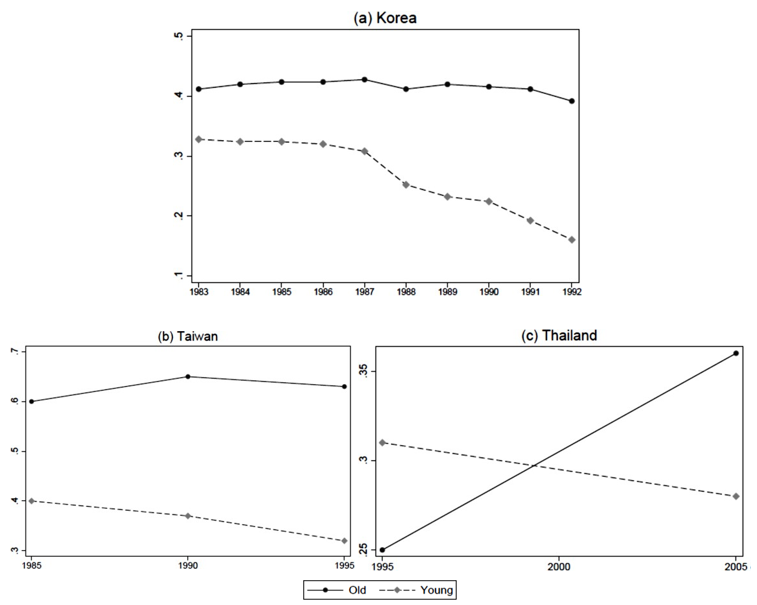
Figure 8: Comparative Analysis of College Premiums among Young and Old Workers in Economies Experienced Rapid Growth
The college wage premiums for both experienced and young workers have undergone similar shifts in the three economies, mirroring the changes observed in China. Significantly, the substantial rise in college enrollments has led to reduced college costs for young employees (as depicted in Figure 8). Nevertheless, the premium for skilled labour either stayed the same or increased. While these economies exhibited a comparable pattern to that of China, the disparity in college premiums was insignificant. This phenomenon can be ascribed to a deceleration in the growth of demand for skilled labour in these economies, which in turn has led to an increase in college enrolment.
A Synopsis of Observational Discoveries
Within this part, We have conducted an analysis of the growth of human resources and wage levels in China, as well as in many other quickly emerging economies. The results of our investigation are as follows:
i. The students' college enrollment and the number of individuals who have completed their college education and entered the workforce experienced significant and rapid growth following a big increase in foreign direct investment (FDI).
ii. The college wage advantage for young workers decreased, whereas it grew for older workers due to a significant rise in college enrollment.
iii. The college graduates' experience premium grew significantly simultaneously.
iv. The model failed to anticipate the enduring advantages of education using the Mincer cross-sectional college premium estimation. Next, we will create a theoretical structure and conduct simulations to correspond with these observed events.
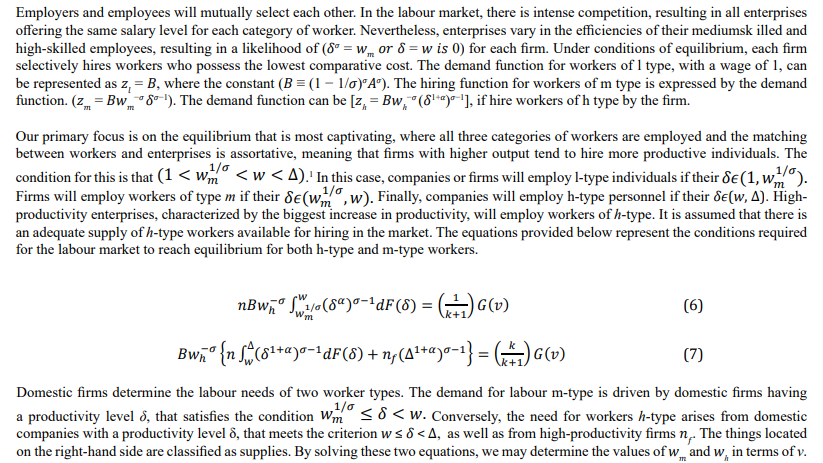
The Theory Concept
The model failed to anticipate the enduring advantages of education using the Mincer Our company offers This section presents a conceptual framework capable of producing predictions that align with the findings discussed in the previous part. In a general equilibrium model, a hypothetical consumer chooses different types of manufactured products by multiple firms. The only factor that affects production is labour, the efficiency of which depends on both education and experience. We first establish the model and deduce the criterion for equilibrium. Afterwards, we utilize numerical techniques to solve the problem and model the subsequent dynamics that arise when a demand shock impacts the system.
Our initial model assumes that The college enrollment quota surpasses the demand for higher education, ensuring that anyone who wishes to attend college. By assuming this, we can ignore any restrictions on the number of college graduates and instead focus on how worker's choices to enrol in college are affected by a rapid shift in demand. Next, we examine the effects of enrolment quotas on the dynamics of the labour market, either on their own or in combination with a demand shock.
The Configuration of the Model
In this economy, there are two distinct markets: the products market and the labour market. The goods market operates under monopolistic competition, while the labour market functions under perfect competition. We utilize the Dixit-Stiglitz framework to examine monopolistic competition. A consumer, who acts as a representation for others, selects from a collection of distinct products
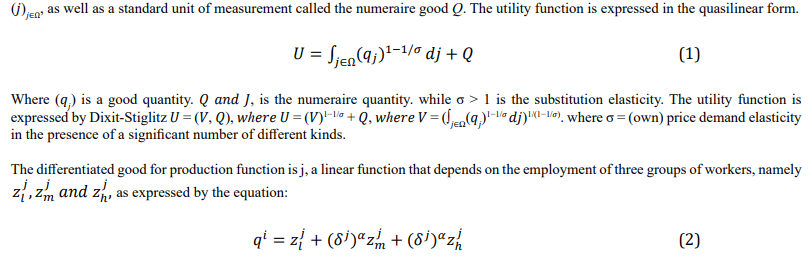
Where Low - skilled is l,medium-skilled is m and high-skilled is h. Linear production function does not only simplify computations but also illustrates that workers of different types are not equilibrium interchangeably, Regardless of whether they are perfect alternatives in the production function. The core findings of our research remain consistent even when alternative production functions, like the CES, are employed.
The productivity of workers varies depending on their degrees of education and experience:
1. Workers with relevant experience and college education are High-skilled (h).
2. Workers with no experience and college education are Medium-skilled (m).
3. Workers with a high school diploma or lower are Low-skilled (l).
To optimize the model's efficiency without compromising its overall usefulness, we assume that the growth in expertise and knowledge acquired via experience does not impact the income of those who have not finished college.
The simpler assumption is corroborated by empirical evidence presented in the previous section, indicating that the rate of return to experience for workers with limited skills has remained consistent since 2002. This suggests that skilled persons with prior experience might be viewed as direct substitutes for unskilled workers without experience. Moreover, our results remain analytically unaffected by changing the assumption. Little abilities experienced worker, for example, can be thought of as 1 + a (where a > 0 is an external constant) novice worker. The low-skilled experienced workers' salary is directly correlated with the low-skilled workers' salary without experience, represented as (1 + aw) . It is expected that all of our theoretical findings should align analytically.
The parameter ![]() j is a measure of the productivity difference The gap in productivity between workers with medium and high skill levels is determined by the difference in productivity between people classified as "type m" m-type and “type l" l-type. (
j is a measure of the productivity difference The gap in productivity between workers with medium and high skill levels is determined by the difference in productivity between people classified as "type m" m-type and “type l" l-type. (![]() )a where α is considered constant. The value
)a where α is considered constant. The value ![]() j is is randomly distributed. To simplify the explanation, the index j will no longer be used from now on. The functional form is a simplifying assumption that does not have an analytical impact on the results.
j is is randomly distributed. To simplify the explanation, the index j will no longer be used from now on. The functional form is a simplifying assumption that does not have an analytical impact on the results.
With two categories of firms: local and high-productivity (which possess higher productivity). A group of nd local enterprises exhibits productivity δ, which is distributed according to a cumulative distribution function (c.d.f.) ![]() ) within the range (1,
) within the range (1, ![]() )(where 0
)(where 0
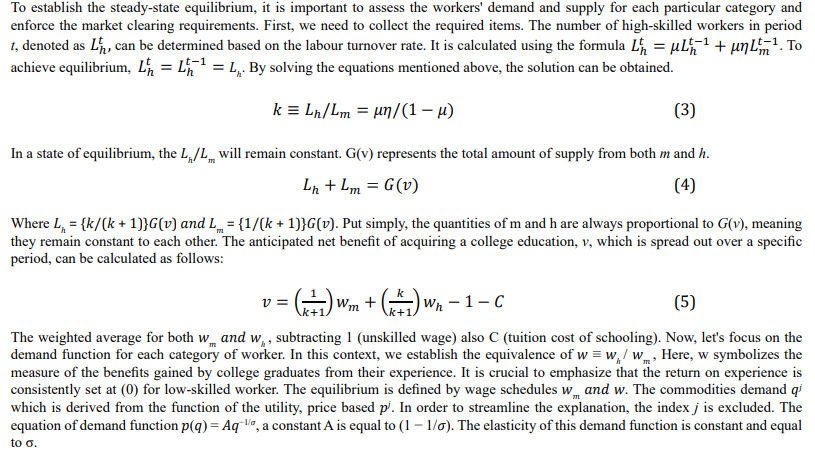
Workers are able to progress to higher level skills. Workers can move to type m workers by getting a college degree of education (4 years of studying). Same way as the type m workers if they getting experience (working for some time) moving to type l workers. This fraction is determined externally and is not influenced by any internal factors. On average, it takes 1/η years for a worker of type m to transition into a worker of type h. This fraction is determined externally and is not influenced by any internal factors. On average, it takes 1/η years for a worker of type m to transition into a worker of type h. Additionally, during each period, a fraction of 1 − µ workers withdraw from the labour force. To simplify the issue, our assumption is the likelihood of leaving is equal for all categories of workers. Simultaneously, a number of 1 − µ individuals (namely young people) join the labour force, maintaining the whole labour force at a steady level. We standardize the labour force to a value of 1 (The qualitative outcomes of our findings will not be affected by any changes in the size of the labour force).
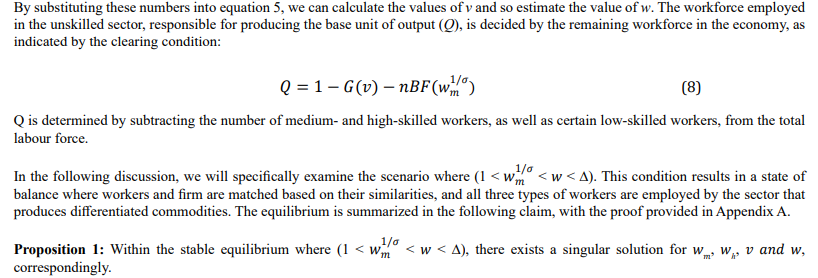
To streamline the model, we use the assumption that individuals' labour supply choices are not considered and instead concentrate solely on their options regarding schooling. The numeraire has the lowest level of output and exclusively hires individuals of type l. In simple terms, the numeraire Given the high level of competition in the job market, all workers receive the same earnings based on market conditions, resulting in equivalent benefits from schooling. To obtain a higher education, workers must shoulder the financial responsibility of tuition fees, shown as C, Additionally, there are personal effort costs that vary based on individuals' inherent skills. The net lifetime return to education, denoted by the variable v, is the anticipated rise in lifetime wages minus the expense of tuition. Given the net return of obtaining a college degree exceeds the effort cost, an individual will opt to pursue it.
By drive the college graduates supply function, G(v) is the individual number receiving college education which is a function of the education net return v. G(v) equal the part can bears college education cost less than v (the reward lifetime). Our assumption of G(.)>0, the function G(v) represents the distribution of the effort cost associated with obtaining a college education. Consumers are assumed to have no preference for risk and no preference for receiving benefits at different points in time. Additionally, we make the assumption that all enterprises have no expenses that are not dependent on the level of production, all revenues are allocated towards the standard units of currency, and there is no lack of employment. In the following subsection.
The State of Equilibrium
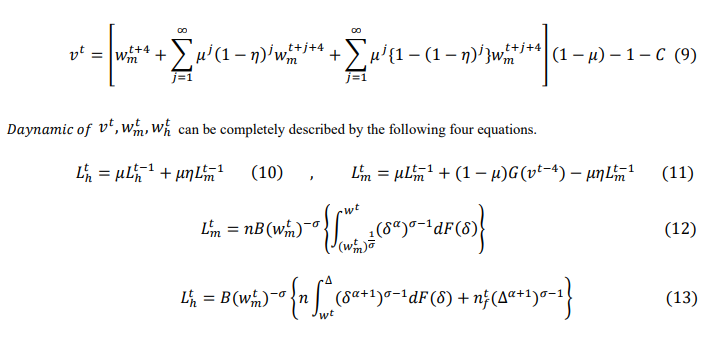
Post-Demand Shock Dynamics
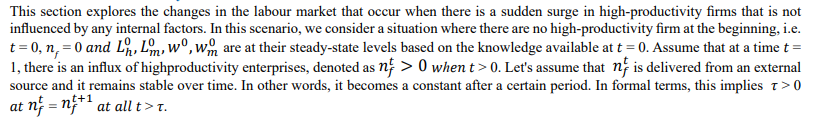
It is assumed that only young individuals with the potential to work can decide to pursue a college education in each period, and it requires four years to get the degree. The dynamic equilibrium, also known as the wage path (Wtm) is determined by individuals Wth making optimal decisions about attending college based on rational expectations of the lifetime return on education. (Heckman, et al.,1998) discovered that when individuals have short-sighted expectations, their model may not reach a new stable state but instead display a pattern of rapid fluctuations known as explosive cobweb behaviour.
An individual's only decision pertains to college enrollment. Assuming that in each period, a fraction of young individuals (1 − µ) enter the labour force, they have the option to either work or pursue higher education. The quantity of individuals attending college at a given period is determined by the expression (1 − u¡), which (vt) represents the anticipated net benefit of pursuing higher education at time t, divided by the number of periods. (vt) can be expressed as
Proposition 4: Whenever nf rises WM it will increase in equilibrium if Gº′( ) is small enough, and WM will fall in equilibrium if º′( ) is large enough.
Impact supply on h-type workers, although to a lesser extent at a later time, as only a fraction η of the workers' m-type transition into workers h-type in each period. Essentially, transitioning from being of worker m-type to a worker h-type requires a significant time commitment.
ii. Rapid Expansion of the College
The transition dynamics involve a significant increase in the m-type workers' number, leading to an excess supply of m-type workers above the long-term equilibrium level. The fundamental idea is as follows. The shortage of h-type personnel will persist for a significant duration, as individuals with middling talents require a large amount of time to acquire expertise. Consequently, the short-term prospects for WH and the anticipated lifetime return on education are greater compared to the long-term outlook. In order to capitalize on this opportunity, a greater number of individuals (who possess rational expectations) will pursue higher education, this led to a large number of m-type workers entering the job market. As a result, there will be a surplus of workers with m-type skills in the medium future. We encapsulate this information in the subsequent proposition, accompanied by the evidence provided in Appendix A.
Proposition 5: If Gº′( . ) is more than zero on the equilibrium path, there is a period τ where LTM is greater than LSM
Simulation Analysing the Chinas Dynamics Labor Market
This part utilizes our theory to analyze the impact of a demand shock for highly skilled workers on the changes in salaries, the value of education, the value of experience, and the composition of skills and conducting numerical simulation in the China Republic.
The Parameters and Procedure of the Simulation
To analyse the dynamics of China's labour market, we conducted numerical simulations after an external increase in the number of enterprises that require highly skilled workers (an increase in nf), such as firms with advanced technology or productivity. Initially, we compute the numerical solutions for equations 9 to 13. Subsequently, we iteratively apply the mapping, similar to the demonstration of Proposition 2.
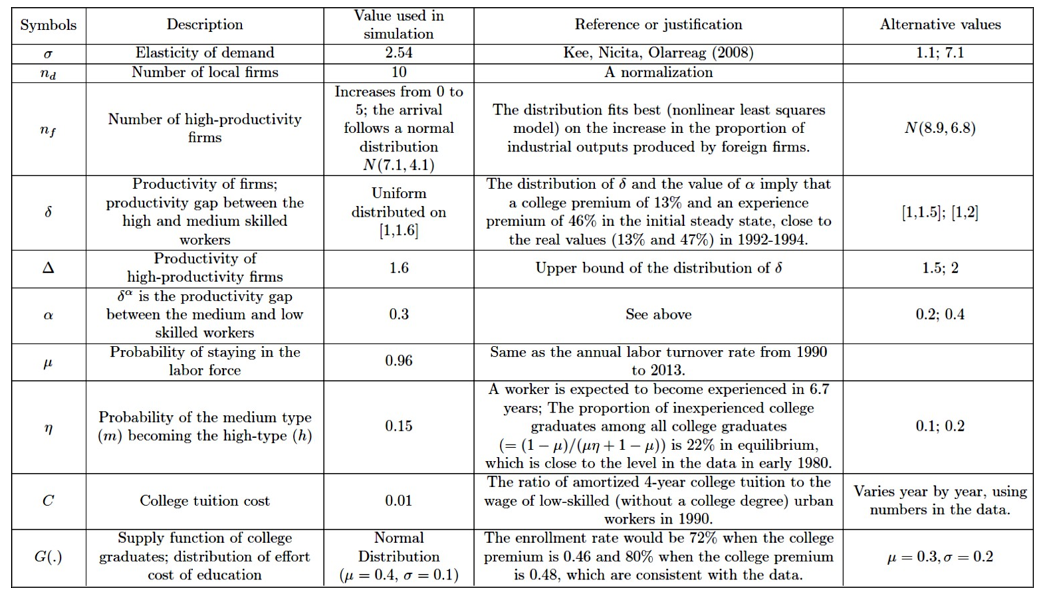
Table A4: Simulation Parameter Values
It is important to note that the iteration begins with the sequence (vt) at the initial equilibrium state. By utilizing equations 10 and 11, we may ascertain the college enrolment rate denoted as [G(vt)] and track the changes in Lmt Lhh over time, based on the given parameters and initial sequence of (vt). Next, we adopt the dichotomy approach to calculate the wages values each time wt and wt by using equations 12 and 13. Afterwards, we compute a new set of (vt) by utilizing equation 9 and utilize this revised sequence of (vt) for the following iteration. Until the variations in weight, weight, and volume are less than the tolerance level of 0.00001, the process is repeated. The theory guarantees that the iteration will converge and that the solution will be singular. (table A4 represent the data between 1980-1990.
Firm Compositions for nf & nd
Initially, we assign values to the parameters nd and nf, which represent the demand shock in firm compositions. We standardize the quantity of local enterprises, represented by nd, to a fixed value of 10. The starting number is (0) of high-productivity firms defined as nf, and gradually rises (1/3) of firms' total number at a new steady state or 5. Without a doubt, the share of industrial production contributed by foreign companies rose from zero to 36% in 2003. In addition to determining the initial and equilibrium levels, it is also necessary to establish the influx rate for high-performing companies in the procedure. The arrival of enterprises with high productivity is typically represented by a normal distribution, Which is the theory outlined. By employing nonlinear least squares, we were able to analyze the time series data of foreign firms' production and determine the parameters of this distribution. Specifically, we found a mean of 7.1 with a standard deviation of 4.1. Under this distribution, enterprises with high productivity had rapid growth initially, but eventually reached a stable state after 20 years.
The Substitution Elasticity (σ).
To ascertain the elasticity of substitution value in China (σ), we adopted the paper of methodologies utilized, which is determined to be 2.54, very close to 2.9 (the baseline value).utilized in the study conducted by Broda et al., for the United States [42,43]. In order to assess the impact of other parameters on the results, We evaluate two alternative values: 1.1 and 7.1 [43,44]. Despite these variations, the primary pattern of labour market dynamics remains the same.
Productivity parameters (α) and (δ)
In order to appropriately depict the increased value of going to college and gaining experience, as found in the data, we assign values to the productivity variables δ and α. A larger value of δ signifies an experienced premium and a greater degree of college, whereas a higher value of α signifies a premium associated with more college education for young college graduates and a premium associated with lower work experience. To be more exact, it is hypothesized that the variable δ conforms to a uniform distribution spanning from 1 to 1.6, whereas the value of α remains constant at 0.3. The provided parameters suggest that young individuals who have recently graduated from college have a 13% increase in earnings compared to those without a college degree {log(wm)}. Additionally, they enjoy a 46% increase in earnings as they get more work experience {log(wh/wm)}. These findings closely match the data observed in the early years. Specifically, the college premium 13% for group 21-25 is 13%, and the experience premium was 47% for college graduates in 1992-1994.
Education parameters C and v
College tuition (C) and the net education return (v) have an impact on the education demand, specifically the rates of college enrolment. In the article, the lowskilled workers' wage is used as a benchmark for C, and it is standardized to a value of 1. Actually, the amortized cost of a 4-year college education is approximately 1% of the total earnings during a person's lifetime for those with limited skills living in urban areas. In 1990, we established C to be equivalent to 1% of the wage earned by lowskilled workers. To determine the college education demand, it is necessary to assign a parameter to the variable v, which is distributed according to the normal distribution. Hence, it is crucial to parameterize v in order to precisely characterize the demand in the first stable condition. Nevertheless, the true magnitude of the need for higher education cannot be observed because of the presence of an admission quota. Consequently, by using the rate of enrolment of years earlier of the large-scale college expansion in place of the education college demand in the first steady situation. More precisely, we determine that the mean and standard deviation of v are respectively 0.4 and 0.1. The enrolment rate is 72% for high school graduates and increases to 80% this is based on the parameters, Meantime the premium of college wage is 0.46 increases to 0.48. These values align with the available statistics. (10-year college premium In 1999 was 0.46 and 64% was the enrolment rate. while In 2001 was 0.48 and 79% respectively).
The parameters of the labour market (η) and (µ)
The worker retained rate, represented by the symbol µ, was determined to be 96%. This indicates that the annual rate of labour turnover in urban China (between 19902013) was around 4%. The chance η, of junior college graduates transitioning into highskilled workers is 0.15. This implies that, on average, it takes a worker approximately 6.7 years to gain sufficient experience. The η and µ values indicate the inexperienced skilled worker percentage among all skilled workers at steady state (1/(1 + k)) is approximately 22%, which closely matches the ratio observed in the 1980s data.
Results from Simulations
The Premium of College
The concept of the College Premium refers to the financial advantage or benefit that Individuals with a college education generally experience greater benefits in contrast to those without a college degree. Figure 10 (wage schedules evolution). The compensation for recent university graduates experiences a temporary increase in the short term as There is an increase in the demand for their services, though this trend rapidly changes direction. With the anticipated rise in college enrolment, it is likely that the incomes of college graduates for the young will initially lag behind the new steady level in comparison to low-skilled jobs. Over time, the young college graduates' salary gradually stabilises at a new level, which is slightly more than the previous value before the sudden change. (The college premium refers to the disparity in income between individuals who have completed college and those who have just completed high school. During the period from 1999 to 2001, the college premium was measured at 0.46 and 0.48).
Professional Experience and Academic Education
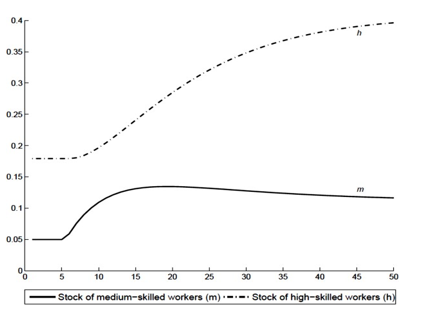
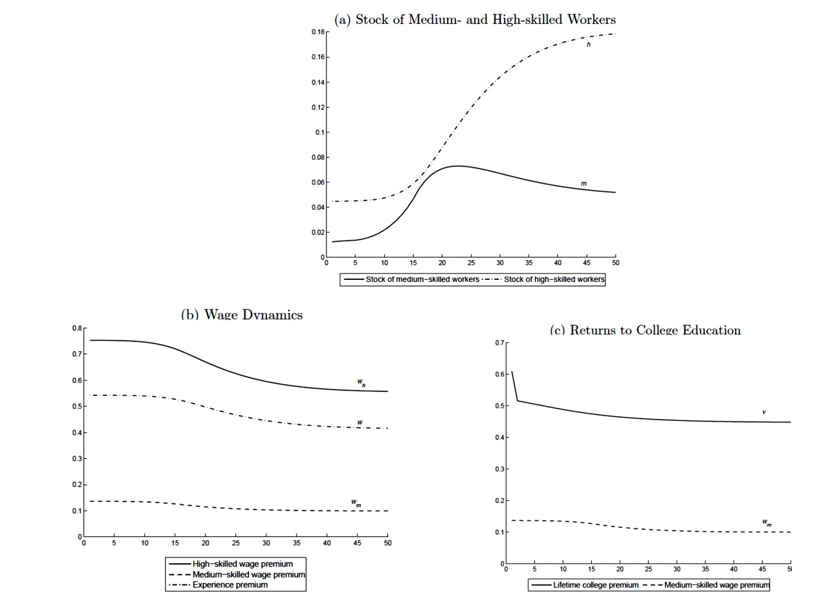
Figure 9: Illustrates the Dynamics Observed in the Stock of Medium- and High-Skilled Workers Subsequent to Demand Shocks
Figure 9 demonstrates that there is a significant increase in the educated young workers supply, namely those with medium-level skills (in our theory referred to as mtype workers), in response to the skills demand increase. It rapidly reaches the maximum point and then gradually drops to the long-term equilibrium. On the other hand, the rate of increase in the number of h-type (highly skilled) workers is less steep compared to that of moderately skilled workers during the early stages, there is a prolonged period for workers to gain experience. The highly skilled number of workers will steadily expand until it reaches the point of equilibrium. It is important to observe that the quantities of workers with moderate and advanced skills in a state of balance are greater than those prior to the sudden increase in demand.
College Education Return for Lifetime
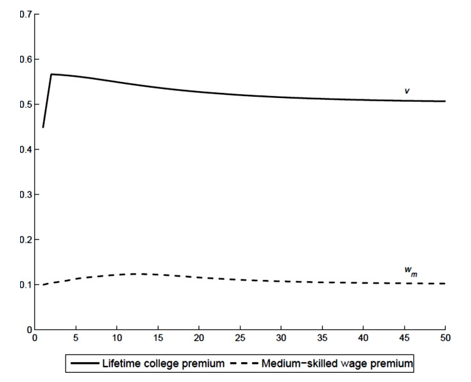
Note: The expected lifetime college premium, denoted as v, is the anticipated lifetime return on investment in college education for a cohort of individuals who have reached the age of 18 and are eligible to attend college during period t. The calculation involves utilising equation 9, which is a linear amalgamation of the projected incomes of highly and moderately skilled individuals, weighted by the likelihood of being classified as such, subtracting the wage for unskilled workers (1) and the cost of education incurred for tuition (C).
Figure 10: Post-Demand Shock Dynamics: Reentry into Higher Education
Figure 10 illustrates the progression of lifetime return on investment for college education for each group, which is determined by the year they started attending college. The lifetime education premium vt experiences an early surge, but subsequently, the rate of growth diminishes rapidly. The value continues to increase for a period of time and then reaches a new stable state, which exceeds the original equilibrium level v0. The rapid ascent and substantial long-term yield of the preceding generations can be attributed to the scarcity of highly skilled labourers in the immediate and intermediate time frames. The lifetime return on investment reduces as the number of young college graduates entering high-skilled professions increases and the additional value of experience diminishes. It is important to observe that the financial benefits of young workers' education wm are consistently far lower than the overall financial benefits during their lifetime.
The Premium of Experience
Note: The wage premium for high-skilled workers is determined by the ratio of the high-skilled wage (wh) to the low-skilled wage (1 in wh â?¦ 1). Likewise, the pay premium for workers with medium skills is equal to (wm â?¦ 1)/1. The calculated value for the experience premium is (wh â?¦ wm)/wm = wh/wm â?¦ 1.
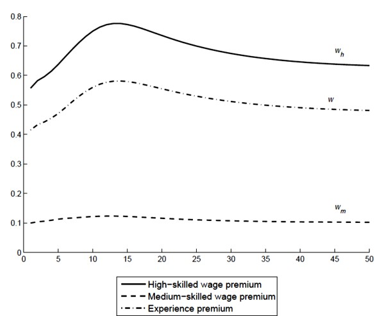
Figure 11: Illustrates the Progression of Wages and Wage Premiums in Response to Demand Shocks
The first increase in the experience premium w is significant, and it continues to rise over several periods until it reaches its highest point (Figure 11). Subsequently, it descends and progressively approaches the new equilibrium value, which surpasses the level prior to the arrival of high-productivity enterprises or firms w0. The time it takes for w to reach its peak is substantially longer since the experience supply is not as responsive as the supply of education. As a result of the increased benefits of education, a significant number of workers with moderate skill levels enter the job market during the first years. However, it takes a considerable amount of time for them to acquire the advanced skills necessary to become highly skilled workers. hence, as wmbegins to decrease, the Lm / Lhratio, and hence w, continues to increase. Similarly, the value of wh increases for a longer duration compared to wm The salaries of seasoned university graduates and the premium for experience will similarly decrease as youthful university graduates eventually transition into experienced professionals.
A Brief Overview of Simulation Findings
To summarize, the changes in the labour market after the sudden change in demand align with the theoretical projections. The demand shock results in a swift surge in college enrolment and the quantity of college graduates. Nevertheless, whereas the financial advantage of attending college for workers with moderate skills first increases following the unexpected event, it subsequently starts to decrease in the intermediate period. Conversely, the cost of acquiring expertise gradually increases over a prolonged period of time. Furthermore, the enduring economic advantage of pursuing higher education surpasses the immediate monetary profit for recent college alumni.
The Supply Limitation and Unexpected Supply Changes
In the preceding analysis, we have disregarded the limitation on the availability of college education. Put simply, we operate under the assumption that anyone has the capacity to attend college if they make the decision to pursue it. However, in actuality, there exists a predetermined limit on college admissions in China and the mandatory potential limit. One significant element that the government's response to the increasing demand for college graduates in the labour market has caused the quota to rise quickly since 1998. However, we will analyze the impact of a quota, particularly one that is externally imposed and subject to change, on the labour market dynamics.
Exclusively Supply Shocks
In our previous research, we have shown that the observed trends in the Chinese labour market can be explained by a sudden surge in the demand for qualified workers. A pertinent inquiry is whether the aforementioned observations in the labour market can be solely accounted for by supply shocks. In order to address this inquiry, we examine a scenario in which there are successive occurrences of supply shocks, while no demand shocks are present. The supply shocks imitate the significant increase in the number of colleges in China after 1999. It is hypothesized that the quantity of individuals who have completed college and the maximum number of students allowed to enrol in college is 25% of the values observed in a stable state where there are no restrictions. Based on this assumption, the total number of college graduates (Lm + Lh) accounts for 5.2% of the total labour force, the proportion of college graduates (Lm) in the overall labour force is 1.1%. The percentages nearly align with the equivalent data from 1990, which were 5.0% and 1.3% respectively. Subsequently, we let the quota increase by 18% per year, mirroring the yearly growth rate observed during the ten years of substantial college expansion.
Note: In the absence of any constraints, it is assumed that the stock of college graduates constitutes 25% of the steady-state level of the stock. The quota for college freshman admission is set at 25% of the stable state level for freshmen admissions. The quota is permitted to increase by an annual rate of 18%. In period t, the expected lifetime return to college (v) refers to the anticipated lifetime return to college education for the cohort of individuals who have reached the age of 18 and are eligible to attend college. Equation 9 is utilised to compute the future wages of high- and medium-skilled workers, taking into account the possibility of being classified as such. This calculation is then combined with the unskilled wage (1) and tuition (C) linearly.
Figure 12: Illustrates the Dynamics That Occur Solely in Response to Supply Shocks, Namely an Increase in Quota
The behaviour of the labour market when faced with supply shocks is distinct from that observed when confronted with demand shocks. To ensure equivalent modifications in the supply curves for workers with medium and high skills, we conduct a series of supply shocks. Panel (a) in Figure 12 as an illustration. While the changes in education and experience may appear comparable to those that occur after demand shocks, workers with intermediate and advanced skills experience a decline in their salaries over time only when there are supply shocks. To put it succinctly, without a sudden change in demand, a supply shock causes both the experience and college premium to decrease gradually. The long-term benefit of schooling also decreases. The results are expected because, in the absence of demand shocks for highly skilled individuals, an increase in the supply of skills leads to a decrease in their price in the overall balance.
In summary, the dynamics of the labour market resulting from supply shocks are distinct from those resulting from demand shocks and do not align with the observed data from China. Therefore, it can be concluded that demand considerations play a crucial role in elucidating human capital growth and the changes in skill premiums in rapidly developing economies.
Implementing a Quota System on College Enrollment
Note: A stringent quota was established, necessitating a reduction in enrollment of 70% compared to the long-term steady state level. The equilibrium was then determined using numerical analysis. The projected lifetime college premium, denoted as v in period t, is the anticipated return on investment for individuals who have reached the age of 18 and are eligible for college education during that period. The calculation involves utilising equation 9, which is a linear amalgamation of the projected wages of highly and moderately skilled workers, weighted by the likelihood of being classified as such, after subtracting the wage for unskilled workers (1) and tuition (C).
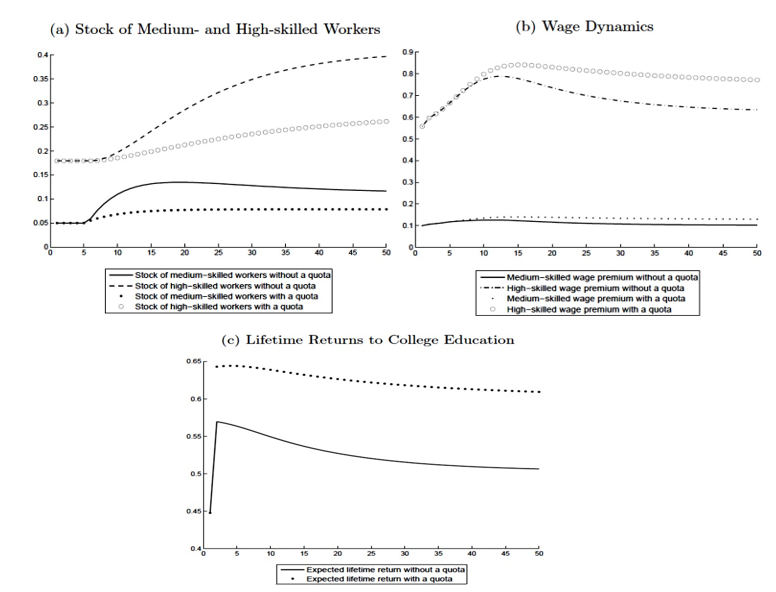
Figure 12: Illustrates the Dynamics Observed After Demand Shocks, Specifically Comparing the Effects of a Quota on College Enrollmen
Assuming the existence of a mandatory quota on college admissions. This implies that the college admission rate is equivalent to the quota Q whenever the value of G(v) is greater than Q. In the present study, we established a value for Q equal to 70% of the long-term steady-state level. The enrollment quota has a substantial influence on the growth of the labour market. The presence of an enrolment quota leads to a decrease in the number of workers with medium and high levels of skills, as illustrated in Panel (a) of Figure 12. Importantly, the implementation of quota results in a steady and regular increase in the number of workers with moderate skills, namely recent college graduates who lack experience. As anticipated, when there is a limit on the availability of education, the salaries of workers with medium and high skills are higher compared to the scenario without a limit (Panel (b)). Additionally, the long-term benefits of education are also greater (Panel (c)).
Aligning Data and Predictions
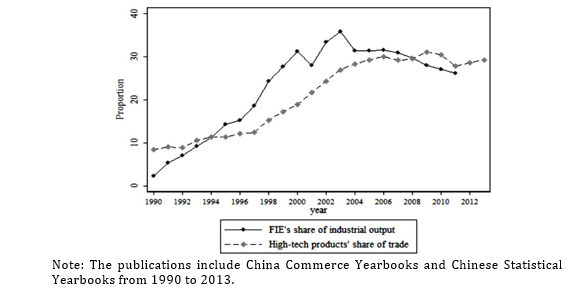
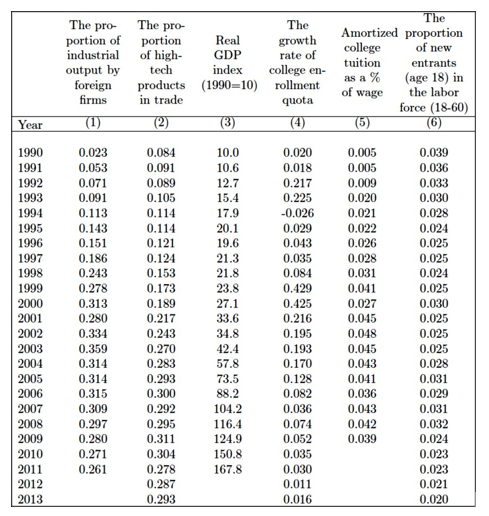
Note: The publications include China Commerce Yearbooks and Chinese Statistical Yearbooks from 1990 to 2013.
Figure 14: Illustrates the Distribution of Output Between Foreign-Invested Enterprises and High-Tech Products in Trade
In order to improve the accuracy of the data fitting, we modify several assumptions of the model. Initially, we modify the assumption of normality about the rate at which highly productive enterprises arrive and instead utilize the actual arrival data from realworld observations. In addition, we use an extra method to account for the impact of changes in demand on highly trained individuals, namely by considering the amount of high-tech items in international trade. In contrast to the previous metric that only accounted for production by foreign firms, this new metric will encompass high-tech production from both foreign and local firms. One limitation does not include a nontrade sector. The data in Figure 14 indicates that the growth rate of the high-tech sector in commerce is marginally lower than the rate of growth for foreign firms' production. We employ a basic arithmetic mean of the two variables as a quantification of the unexpected changes in demand.
Note: The measurement of demand shocks is conducted by calculating the simple average of the production share of foreign-invested firms and the share of high-tech products in trade. The college admission quota is allowed to increase at a rate that aligns with the annual growth rate of college admissions. The proliferation of local firms is expected to align with the rate of growth observed in industrial outputs. The rate of growth in the labour force is equivalent to that of the urban labour force. The rate of tuition growth is observed in the data. It is assumed that all of these factors reached a stable state in January 2013. The temporal progression of these variables is presented in Table A6. The college premium v in period t is the anticipated lifetime return for the cohort of individuals who have reached the age of 18 and are projected to attend college within a 10-year timeframe. Equation 9 is utilised to compute the future wages of high- and medium-skilled workers, taking into account the possibility of being classified as such. This calculation is then combined with the unskilled wage (1) and tuition (C) linearly.
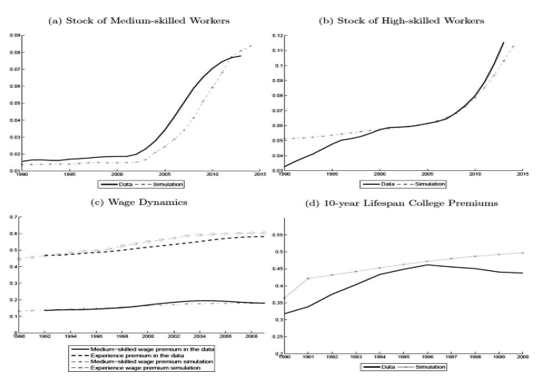
Figure 15: Comparison of Simulated Results with Data
Note: For years beyond 2013 (where certain measurements may begin to be absent earlier), we utilise the numerical value from the most recent year that is accessible.
Table A5: Simulation Time Series Used
Furthermore, Instead of keeping it fixed, we facilitate the expansion of local enterprises. The growth rate is the measure of how fast the real GDP index (based on 1990) is increasing. We also permit the college's enrolment rate to vary according to The rate displayed in the data, as opposed to maintaining it at a constant number. Posteriormente, permitimos que el costo se incremente a la misma tasa que hemos observado en los datos. The workforce turnover rate refers to the percentage of individuals in the workforce who belong to the entry cohort (18 years old) and varies on an annual basis. It is assumed that all these criteria reached a steady state in 2013, which is primarily accurate according to the data. Figure 15 demonstrates that the simulation findings when considering relaxed assumptions, align closely with the data. The simulated numbers of workers with intermediate skills (Panel (a)) and workers with advanced skills (Panel (b)), along with the wage differences based on skill levels (Panel (c)), closely align with the actual data. The most significant disparity between the simulated outcomes and the actual data is observed in the 10-year duration college premium (Panel (d)), while the average deviation is about 10%.
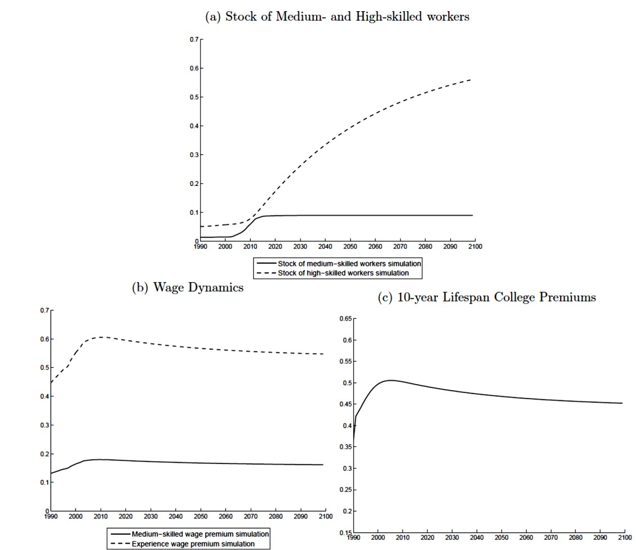
Figure 16: Displays the Long-Run Equilibrium
The program additionally enables us to forecast forthcoming changes in the labour market. To do this, we make the simplistic assumption that all the parameters achieve a condition of stability after the year 2013. Based on the data presented in Figure 16, it is projected that it will take approximately 50 years for the medium-skills to reach a new equilibrium level, they will be up 9.1% of the total labour force. Nevertheless, it will require one hundred years for the quantity of highly skilled people to attain its new equilibrium level, constituting 66.7% of the workforce. The long-term college premium equilibrium level is 15.8%, whereas the experience premium's long-term equilibrium level is 53.5%. These levels are significantly higher than initial levels but lower maximum amounts observed during the transition period. The college premium over ten years will eventually stabilise at 44.3% of the long-term equilibrium, exceeding the initial amount.
Conclusion
This study examines the shared features of labour markets in rapidly developing economies, including mainland China, Korea, Taiwan, and Thailand. Specifically, all of these swiftly developing economies had a quick increase in the number of colleges, which led to a decrease in the financial advantage that young workers with a college education used to have. On the other hand, the economic advantage of possessing a college degree increased for individuals with work experience. In other words, the added worth of job experience for individuals who had completed college also increased. As a result, the groups of people affected will have a noticeably different lifetime benefit from education compared to what was previously projected using a Mincer equation that only considered a single point in time. We present a comprehensive equilibrium theory and utilise it to demonstrate that a sudden surge in FDI, resulting in a demand shock for highly skilled labour, may be attributed as the primary factor behind the observed occurrences in fast-developing countries. The improvements of our model.
We take into account two aspects of human capital, namely education and labour market experience, and we incorporate the supply of human capital as an internal factor. We demonstrate that in the presence of business heterogeneity, workers with varying degrees of human capital cannot be interchanged in the equilibrium state. The simulated results obtained from our theoretical model align closely with the observed empirical data. Furthermore, we prove that without a sudden increase in demand, a single sudden increase in the supply of college graduates is not enough to explain the labour market changes observed in China and other fast-expanding countries.
Our research indicates that in rapidly developing countries, investing in human capital yields significant returns. However, the conventional Mincer equation is insufficient in completely capturing this phenomenon. We demonstrate that it is entirely logical for young individuals to pursue higher education, even if the current financial benefits are minimal and declining since they anticipate a substantial long-term payoff. In order to understand the underlying reasons behind an individual's decision about education, it is necessary to assess the long- term benefits that education can provide throughout their life [45-107].
References
- Yao, X., Fang, X., & Zhang, H. (2013). Changes in economic return to schooling and employment rate with the expansion of higher education. Economic Issues in China, 277(2), 3-11.
- Wang, R. J. (2003). From elitism to mass higher education in Taiwan: The problems faced. Higher education, 46(3), 261-287.
- Appleton, S., Song, L., & Xia, Q. (2014). Understanding urban wage inequality in China 1988–2008: Evidence from quantileanalysis. World Development, 62, 1-13.
- Gao, W., & Smyth, R. (2015). Education expansion and returns to schooling in urban China, 2001–2010: Evidence from three wavesof the China Urban Labor Survey. Journal of the Asia Pacific Economy, 20(2), 178-201.
- Card, D., & Lemieux, T. (2001). Can falling supply explain the rising return to college for younger men? A cohort-based analysis.The quarterly journal of economics, 116(2), 705-746.
- Baraka, J. L. (1999). Returns to Education in Taiwan: A Cross-Sectional and Cohort Analysis (No. 222).
- Choi, K. S. (2004). The Rising Returns to Education and Skill-Biased Technological Change in Korea: 1983-2000. KOKUSAI KEIZAI, 2004(55), 340-360.
- Mehta, A., Felipe, J., Quising, P., & Camingue, S. (2007). Changing patterns in Mincerian returns to education and employment structure in three Asian countries.
- Mincer, J. (1962). On-the-job training: Costs, returns, and some implications. Journal of political Economy, 70(5, Part 2), 50-79.
- Becker, G. S. (1962). Investment in human capital: A theoretical analysis. Journal of political economy, 70(5, Part 2), 9-49.
- Arrow, K. J. (1962). The economic implications of learning by doing. The review of economic studies, 29(3), 155-173.
- Dosi, G., & Nelson, R. R. (2010). Technical change and industrial dynamics as evolutionary processes. Handbook of the Economics of Innovation, 1, 51-127.
- Kotlikoff, L. J., & Gokhale, J. (1992). Estimating a firm's age-productivity profile using the present value of workers' earnings. The Quarterly Journal of Economics, 107(4), 1215-1242.
- Boisjoly, J., Duncan, G. J., & Smeeding, T. (1998). The shifting incidence of involuntary job losses from 1968 to 1992. Industrial Relations: A Journal of Economy and Society, 37(2), 207-231.
- Card, D., & Lemieux, T. (2001). Can falling supply explain the rising return to college for younger men? A cohort-based analysis.The quarterly journal of economics, 116(2), 705-746.
- Juhn, C., Murphy, K. M., & Pierce, B. (1993). Wage inequality and the rise in returns to skill. Journal of political Economy, 101(3), 410-442.
- Katz, L. F., & Murphy, K. M. (1992). Changes in relative wages, 1963–1987: supply and demand factors. The quarterly journal of economics, 107(1), 35-78.
- Autor, D. H., Levy, F., & Murnane, R. J. (2003). The skill content of recent technological change: An empirical exploration. The Quarterly journal of economics, 118(4), 1279-1333.
- Autor, D. H., Levy, F., & Murnane, R. J. (2003). The skill content of recent technological change: An empirical exploration. The Quarterly journal of economics, 118(4), 1279-1333.
- Goldin, C. D., & Katz, L. F. (2008). The race between education and technology. harvard university press.
- Autor, D. H., Katz, L. F., & Kearney, M. S. (2008). Trends in US wage inequality: Revising the revisionists. The Review of economics and statistics, 90(2), 300-323.
- Acemoglu, D., & Autor, D. (2011). Skills, tasks and technologies: Implications for employment and earnings. In Handbook of labor economics (Vol. 4, pp. 1043-1171). Elsevier.
- Borjas, G. J. (2003). The labor demand curve is downward sloping: Reexamining the impact of immigration on the labor market.The quarterly journal of economics, 118(4), 1335-1374.
- Card, D., & DiNardo, J. E. (2002). Skill-biased technological change and rising wage inequality: Some problems and puzzles.Journal of labor economics, 20(4), 733-783.
- DiNardo, J. E., & Pischke, J. S. (1997). The returns to computer use revisited: Have pencils changed the wage structure too?. The Quarterly journal of economics, 112(1), 291-303.
- DiNardo, J., Fortin, N., & Lemieux, T. (1995). Labor market institutions and the distribution of wages, 1973-1992: A semiparametric approach.
- DiNardo, J., Fortin, N., & Lemieux, T. (1995). Labor market institutions and the distribution of wages, 1973-1992: A semiparametric approach.
- Carneiro, P., & Lee, S. (2011). Trends in quality-adjusted skill premia in the United States, 1960–2000. American Economic Review, 101(6), 2309-2349.
- Heckman, J. J., Lochner, L., & Taber, C. (1998). Explaining rising wage inequality: Explorations with a dynamic general equilibrium model of labor earnings with heterogeneous agents. Review of economic dynamics, 1(1), 1-58.
- Bai, L. (2006). Graduate unemployment: Dilemmas and challenges in China's move to mass higher education. The China Quarterly, 185, 128-144.
- Li, S., Whalley, J., & Xing, C. (2014). China's higher education expansion and unemployment of college graduates. China Economic Review, 30, 567-582.
- Shin, J. C., & Harman, G. (2009). New challenges for higher education: Global and Asia-Pacific perspectives. Asia Pacific EducationReview, 10(1), 1-13.
- Nelson, R. R., & Pack, H. (1999). The Asian miracle and modern growth theory. The Economic Journal, 109(457), 416-436.
- Tseng, M. W., & Zebregs, M. H. (2002). Foreign direct investment in China: Some lessons for other countries. International Monetary Fund.
- Javorcik, B. S. (2004). Does foreign direct investment increase the productivity of domestic firms? In search of spillovers throughbackward linkages. American economic review, 94(3), 605-627.
- Feenstra, R. C., & Hanson, G. H. (2005). Ownership and control in outsourcing to China: Estimating the property-rights theory ofthe firm. The Quarterly Journal of Economics, 120(2), 729-761.
- Liu, Z. (2008). Foreign direct investment and technology spillovers: Theory and evidence. Journal of development economics, 85(1-2), 176-193.
- Blomström, M., & Sjöholm, F. (1999). Technology transfer and spillovers: Does local participation with multinationals matter?.European economic review, 43(4-6), 915-923.
- Brandt, L., Van Biesebroeck, J., Wang, L., & Zhang, Y. (2017). WTO accession and performance of Chinese manufacturing firms.American Economic Review, 107(9), 2784-2820.
- Stiglitz, J. E. (1996). Some lessons from the East Asian miracle. The world Bank research observer, 11(2), 151-177.
- Rodrik, D. (2018). Understanding economic policy reform. In Modern political economy and Latin america (pp. 59-70). Routledge.
- Kee, H. L., Nicita, A., & Olarreaga, M. (2008). Import demand elasticities and trade distortions. The Review of Economics and Statistics, 90(4), 666-682.
- Broda, C., & Weinstein, D. E. (2006). Globalization and the Gains from Variety. The Quarterly journal of economics, 121(2), 541- 585.
- Hering, L., & Poncet, S. (2010). Market access and individual wages: Evidence from China. The Review of Economics and Statistics, 92(1), 145-159.
- Acemoglu, D. (2002). Technical change, inequality, and the labor market. Journal of economic literature, 40(1), 7-72.
- Acemoglu, D. (2015). Technology and the labor market. Journal of Economic.
- Autor, D. H., Katz, L. F., & Krueger, A. B. (1998). Computing inequality: have computers changed the labor market?. The Quarterly journal of economics, 113(4), 1169-1213.
- David, H., Katz, L. F., & Kearney, M. S. (2005). Trends in us wage inequality: Re-assessing the revisionists. NBER working paper,(w11627).
- Autor, D., Katz, L. F., & Kearney, M. S. (2005). Rising wage inequality: The role of composition and prices.
- Autor, D. H., Katz, L. F., & Kearney, M. S. (2006). The polarization of the US labor market. American economic review, 96(2), 189-194.
- Beaudry, P., & Green, D. A. (2000). Cohort patterns in Canadian earnings: assessing the role of skill premia in inequality trends.Canadian Journal of Economics/Revue canadienne d'économique, 33(4), 907-936.
- Benabou, R., & Tirole, J. (2006). Belief in a just world and redistributive politics. The Quarterly journal of economics, 121(2), 699-746.
- Berman, E., Bound, J., & Griliches, Z. (1993). Changes in the demand for skilled labor within US manufacturing industries: evidence from the Annual Survey of Manufactures (Vol. 4010). NBER. National Bureau of Economic Research.
- Berman, E., Bound, J., & Machin, S. (1998). Implications of skill-biased technological change: international evidence. The quarterly journal of economics, 113(4), 1245-1279.
- Blanchard, O. (2002). The economic future of Europe. Journal of Economic Perspectives, 18(4), 3-26.
- Boarini, R., & Strauss, H. (2007). The private internal rates of return to tertiary education: new estimates for 21 OECD countries.OECD Economic Department Working Papers, (591), 0_1.
- Bond, S., & Van Reenen, J. (1999). Microeconomic models of investment and employment. Forthcoming In: JJ Heckman and EELeamer (eds.), Handbook of Econometrics, 5.
- Borjas, G. J. (2006). Immigration in high-skill labor markets: The impact of foreign students on the earnings of doctorates.
- Bound, J., & Johnson, G. (1992). Changes in the structure of wages in th 1980’s: An evaluation in means-tested entitlement programs. American Economic Review, 82, 371-392.
- Bresnahan, T. F., Brynjolfsson, E., & Hitt, L. M. (2002). Information technology, workplace organization, and the demand for skilled labor: Firm-level evidence. The quarterly journal of economics, 117(1), 339-376.
- Buchinsky, M. (1994). Changes in the US wage structure 1963-1987: Application of quantile regression. Econometrica: Journal of the Econometric Society, 405-458.
- Card, D. (1996). The effect of unions on the structure of wages: A longitudinal analysis. Econometrica: journal of the Econometric Society, 957-979.
- Council on Competitiveness. (2005). National summit on competitiveness: Investing in innovation. Washington, DC: National Association of Manufacturers.
- Doms, M. E., & Lewis, E. G. (2006). Labor supply and personal computer adoption.
- Dreher, A., & Poutvaara, P. (2005). Student flows and migration: An empirical analysis (No. 1490). CESifo working paper.
- Duke University, Master of Engineering Management Program. 2005. Framing the engineering outsourcing debate: Placing theUnited States on a level playing field with China and India. Durham, NC: Duke University.
- Edin, P. A., & Topel, R. (1997). Wage policy and restructuring: The Swedish labor market since 1960. In The welfare state in transition: Reforming the Swedish model (pp. 155-202). University of Chicago Press.
- Faggio, G., Van Reenen, J., & Salvanes, K. (2006). Increasing inequality of firm productivity. mimeo.
- Finn, M. G. (2010). Stay rates of foreign doctorate recipients from US universities, 2007 (No. 10-SEP-0168). Oak Ridge Inst. for Science and Education (ORISE), Oak Ridge, TN (United States).
- Freeman, R. B. (2010). What does global expansion of higher education mean for the United States?. In American Universities in a global market (pp. 373-404). University of Chicago Press.
- Freeman, R. B., Jin, E., & Shen, C. Y. (2004). Where do new US-trained science-engineering PhDs come from?.
- Glewwe, P. (2002). Schools and skills in developing countries: education policies and socioeconomic outcomes. Journal of economic literature, 40(2), 436-482.
- Gomory, R. E., & Baumol, W. J. (2001). Global trade and conflicting national interests. MIT Press.
- Gosling, A., Machin, S., & Meghir, C. (2000). The changing distribution of male wages in the UK. The Review of Economic Studies, 67(4), 635-666.
- De Grip, A., Fouarge, D., & Sauermann, J. (2010). What affects international migration of European science and engineeringgraduates?. Economics of Innovation and New Technology, 19(5), 407-421.
- Grossman, G. M., & Rossi-Hansberg, E. (2008). Trading tasks: A simple theory of offshoring. American economic review, 98(5), 1978-1997.
- Heckman, J. J., Lochner, L., & Todd, P. E. (2003). Fifty years of Mincer earnings regressions.
- Hvistendahl, M. (2008). China moves up to fifth as importer of students. Chronicle of higher education, 55(4).
- Hwang, Jung Eun. (2008). MIT or Tsinghua? A panel data analysis of the determinants of domestic higher education and international student mobility. Bachelor’s thesis, Harvard College.
- International Association of Universities. (2008). The international handbook of universities. 20th ed. Hampshire, UK: Palgrave Macmillan.
- Katz, L. F. (1999). Changes in the wage structure and earnings inequality. In Handbook of labor economics (Vol. 3, pp. 1463-1555). Elsevier.
- Katz, L. F., & Murphy, K. M. (1992). Changes in relative wages, 1963–1987: supply and demand factors. The quarterly journal of economics, 107(1), 35-78.
- Kremer, M., & Maskin, E. (2006). Globalization and inequality.
- Krueger, A. B. (1993). How computers have changed the wage structure: evidence from microdata, 1984–1989. The Quarterly Journal of Economics, 108(1), 33-60.
- Lemieux, T. (2006). Increasing residual wage inequality: Composition effects, noisy data, or rising demand for skill?. American economic review, 96(3), 461-498.
- Lemieux, T. (2006). Increasing residual wage inequality: Composition effects, noisy data, or rising demand for skill?. American economic review, 96(3), 461-498.
- Lemieux, T. (2006). The “Mincer equation” thirty years after schooling, experience, and earnings. In Jacob Mincer a pioneer of modern labor economics (pp. 127-145). Boston, MA: Springer US.
- MacGarvie, M., & Khan, S. (2009). How important is US location for research in science. Boston, MA: Boston University Working Paper.
- Machin, S., & Vignoles, A. (2018). What's the Good of Education?: The Economics of Education in the UK.
- Marginson, Simon. 2001. The global market in foreign higher education: The case of Australia. Paper presented at Association for Studies in Higher Education (ASHE) 26th annual conference, Richmond, Virginia.
- McKinsey Global Institute. (2005). The emerging global labor market: Part I. White Paper no. 2005-0601. New York: McKinsey Global Institute.
- National Academy of Sciences (NAS). (2005). Policy implications of international graduate students and postdoctoral scholars in the US. Washington, DC: NAS Press.
- National Science Foundation (NSF). (1993). Human resources for science & technology: The Asian region. NSF no. 93-303. Arlington, VA: NSF.
- Noorbakhsh, F., Paloni, A., & Youssef, A. (2001). Human capital and FDI inflows to developing countries: New empirical evidence.World development, 29(9), 1593-1610.
- Oosterbeek, H., & Webbink, D. (2011). Does studying abroad induce a brain drain?. Economica, 78(310), 347-366.
- Parey, M., & Waldinger, F. (2011). Studying abroad and the effect on international labour market mobility: Evidence from theintroduction of ERASMUS. The economic journal, 121(551), 194-222.
- Rosenzweig, Mark. (2006). Global wage differences and international student flows.
- Ruffin, R. J., & Jones, R. W. (2007). International technology transfer: Who gains and who loses?. Review of International Economics, 15(2), 209-222.
- Schofer, E., & Meyer, J. W. (2005). The worldwide expansion of higher education in the twentieth century. American sociological review, 70(6), 898-920.
- Schofer, E., & Meyer, J. W. (2005). The worldwide expansion of higher education in the twentieth century. American sociological review, 70(6), 898-920.
- Spitz-Oener, A. (2006). Technical change, job tasks, and rising educational demands: Looking outside the wage structure. Journal of labor economics, 24(2), 235-270.
- U.S. Census Bureau. (2004). Statistical abstract of the United States: 2004–2005. 124th ed. Washington, DC: U.S. GPO, December.
- Gereffi, G., Wadhwa, V., Rissing, B., & Ong, R. (2008). Getting the numbers right: International engineering education in the UnitedStates, China, and India. Journal of Engineering Education, 97(1), 13-25.
- Wan, Y. (2006). Expansion of Chinese higher education since 1998: Its causes and outcomes. Asia Pacific Education Review, 7(1), 19-32.
- Welch, A. (2002). Going global? Internationalizing Australian universities in a time of global crisis. Comparative Education Review, 46(4), 433-471.
- Zhang, J., Zhao, Y., Park, A., & Song, X. (2005). Economic returns to schooling in urban China, 1988 to 2001. Journal of comparative economics, 33(4), 730-752.
- Zhao, Y. (2001). Foreign direct investment and relative wages: The case of China. China Economic Review, 12(1), 40-57.
Appendix A. Proposition Approval
A1. Evidence Supporting Proposition 1
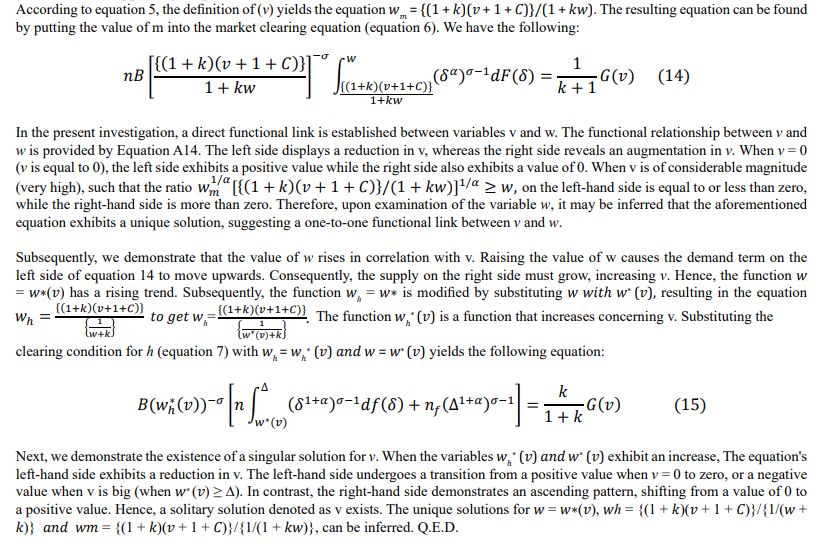
A2. Evidence Supporting Proposition 2
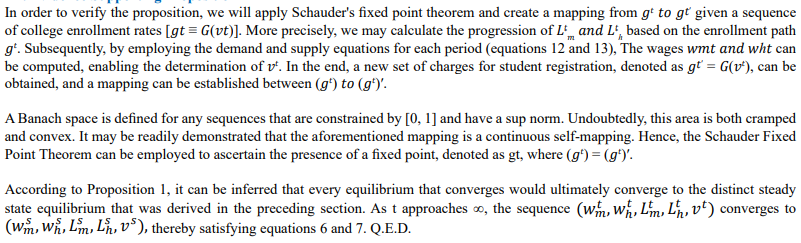
A3. Evidence Supporting Proposition 3
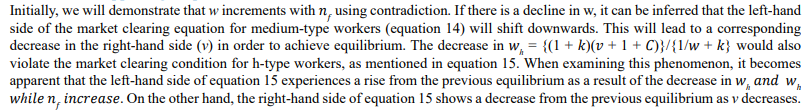
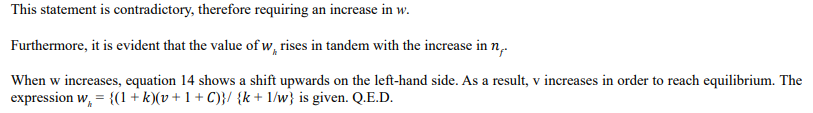
A4. Evidence Supporting Proposition 4
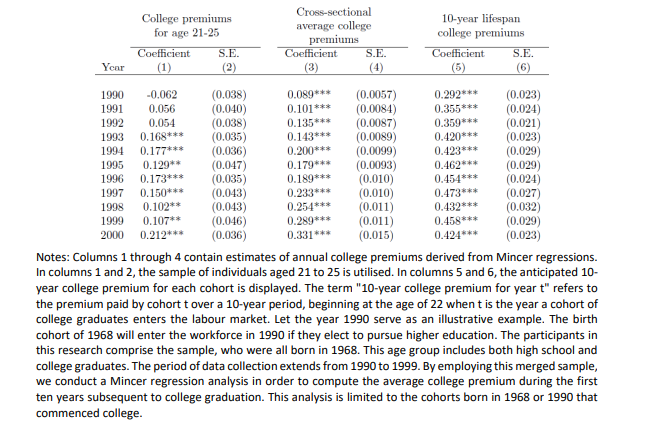
Table A6: A Comparative Analysis of 10-Year Lifespan and Cross-Sectional College Premiums
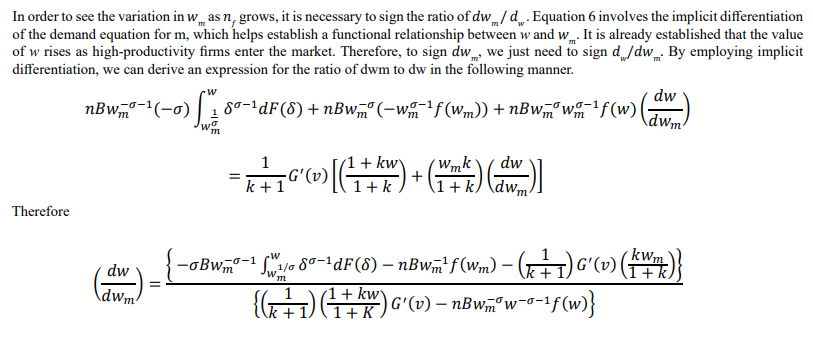
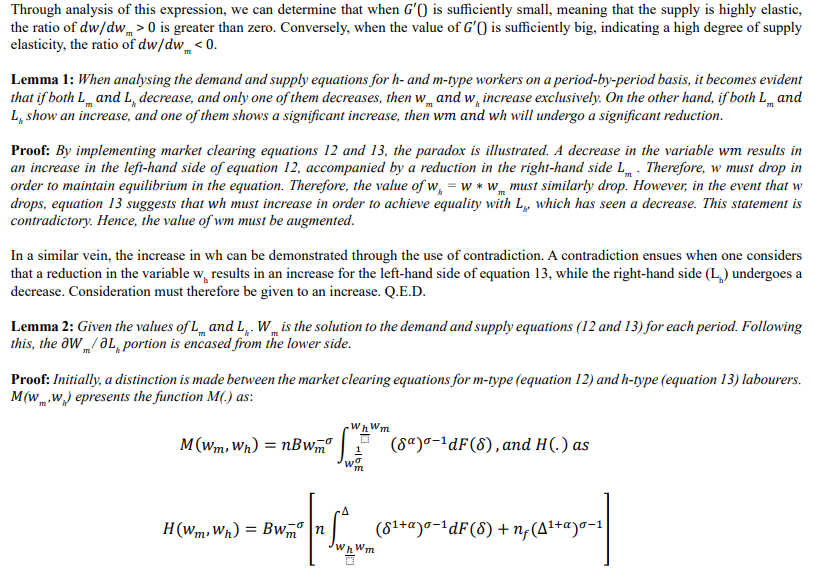
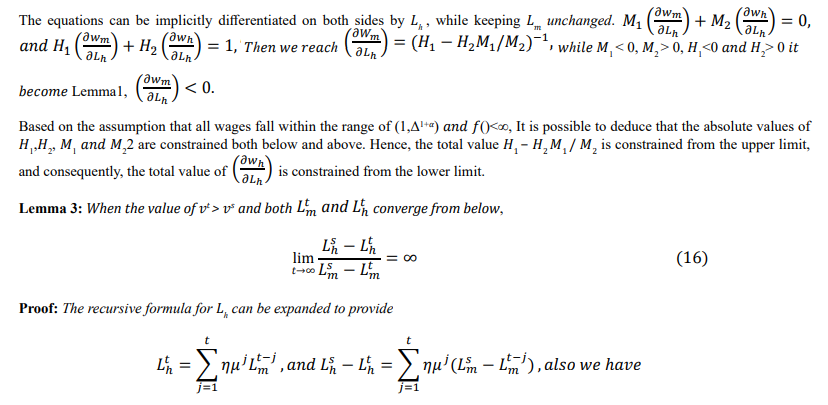
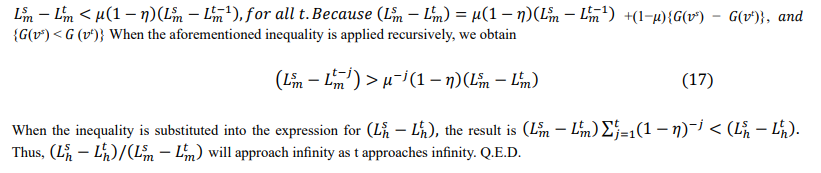
A5 Evidence Supporting Proposition 5