


Research Article - (2019) Volume 4, Issue 4
Dietary and Lifestyle Modification in the Prevention of Secondary Complication of Diabetes Mellitus
Received Date: Apr 07, 2019 / Accepted Date: Sep 06, 2019 / Published Date: Oct 01, 2019
Copyright: ©Sonali Tripathy. This is an open-access article distributed under the terms of the Creative Commons Attribution License, which permits unrestricted use, distribution, and reproduction in any medium, provided the original author and source are credited.
Abstract
Diabetes mellitus metabolic cum vascular syndrome of multiple aetiologies characterized by chronic hyperglycemia with disturbances of CHO, Fat and Protein metabolism resulting from defects in insulin secretion, insulin action or both. This disorder is frequently associated with long term disease, which can lead to failure of organs like eyes, kidneys, nerves, heart, and blood vessel. In recent years India has witnessed a rapidly exploding epidemic of Diabetes.
Abbreviations
BP-Blood pressure
GI-Glycemic index
ICMR-Indian Council of Medical Research
CHO- Carbohydrate
IDDM- Insulin Dependent Diabetes Mellitus (Type-1)
NIDDM- Non-insulin Dependent Diabetes Mellitus (Type 2)
LD-Licensed Dietician
RD-Registered Dietician
LDL-Low Density Lipoprotein
VLDL-Very Low Density Lipoprotein
NIN-National Institute of Nutrition
RDA-Recommended Dietary Allowances
WHO-World Health Organization
Introduction
Diabetes mellitus metabolic cum vascular syndrome of multiple aetiologies characterized by chronic hyperglycemia with disturbances of CHO, Fat and Protein metabolism resulting from defects in insulin secretion, insulin action or both. This disorder is frequently associated with long term disease, which can lead to failure of organs like eyes, kidneys, nerves, heart, and blood vessel. In recent years India has witnessed a rapidly exploding epidemic of Diabetes. Indeed, India today leads the world with its largest number of Diabetic people in any given country. WHO estimates there are 32 million with Diabetes in India with Diabetes in 2000, which is projected to rise by 80 million by the year 2030? Increase in prevalence is rapid in urban areas from 2% 1970s to 12% in 2000 and in rural areas also it is now beginning to increase. Nutrition is often said to be the cornerstone of diabetes care. The goal for nutritional management is optimal metabolic control through a balance between food intake, physical activity, and if necessary, medication to avoid complications.
Types of Diabetes
The two major forms of diabetes are type 1 (previously called insulin-dependent diabetes mellitus, IDDM, or juvenile-onset diabetes) and type 2 (previously called noninsulin-dependent diabetes mellitus, NIDDM, or maturity-onset diabetes). Both type 1 and type 2 diabetes share one central feature: elevated blood sugar (glucose) levels due to insufficiencies of insulin, a hormone produced by the pancreas. Insulin is a key regulator of the body’s metabolism. It works in the following way: During and immediately after a meal the process of digestion breaks down carbohydrates into sugar molecules (including glucose) and proteins into amino acids.
• Right after the meal, glucose and amino acids are absorbed directly into the bloodstream, and blood glucose levels rise sharply.
• The rise in blood glucose levels signals important cells in the pancreas, called beta cells, to secrete insulin, which pours into the bloodstream. Within 10 minutes after a meal, insulin rises to its peak level.
• Insulin enables glucose to enter into cells of the body, particularly muscle and liver cells. Here, insulin and other hormones direct whether glucose will be burned for energy or stored for future use.
• When insulin levels are high, the liver stops producing glucose and stores it in other forms until the body needs it again.
• As blood glucose levels reach their peak, the pancreas reduces the production of insulin.
• About 2 - 4 hours after a meal, both blood glucose and insulin are at low levels, with insulin being slightly higher. The blood glucose levels are then referred to as fasting blood glucose concentrations.
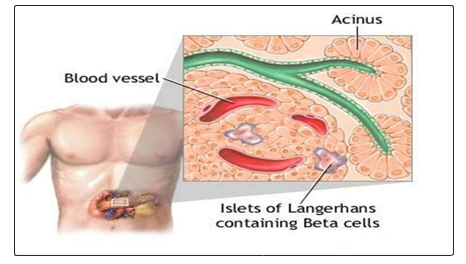
(Islets of Langerhans contain beta cells and are located within the pancreas. Beta cells produce insulin, which is needed to metabolize glucose within the body.)
Type 2 Diabetes
It is the most common form of diabetes, accounting for 90 - 95% of cases. In type 2 diabetes, the body does not respond properly to insulin, a condition known as insulin resistance. The disease process of type 2 diabetes involves: To produce enough insulin to overcome resistance. In type 2 diabetes, the initial effect of this stage is usually an abnormal rise in blood sugar after a meal (called postprandial hyperglycemia). Eventually, the cycle of elevated glucose further damages beta cells, thereby drastically reducing insulin production and the first stage in type 2 diabetes is insulin resistance. Although insulin can attach normally to receptors on liver and muscle cells, certain mechanisms prevent insulin from moving glucose (blood sugar) into these cells where it can be used. Most patients with type 2 diabetes produce variable, even normal or high amounts of insulin. In the beginning, this amount is usually sufficient to overcome such resistance. Type 1 Diabetes In type 1 diabetes, the body does not produce insulin. Onset is usually in childhood or adolescence. Type 1 diabetes is considered an autoimmune disorder that involves: Beta cells in the pancreas that produce insulin are gradually destroyed. Eventually insulin deficiency is absolute. Without insulin to move glucose into cells, blood glucose levels become excessively high, a condition known as hyperglycemia. Because the body cannot utilize the sugar, it spills over into the urine and is lost. Weakness, weight loss, frequent urination, and excessive hunger and thirst are among the initial symptoms. Patients with type 1 diabetes need to take daily insulin for survival.
Gestational Diabetes
About 5% of pregnant women develop a form of type 2 diabetes, usually temporary, in their third trimester called gestational diabetes. Gestational diabetes is diabetes that first appears during pregnancy. It usually develops during the third trimester of pregnancy. After delivery, blood sugar (glucose) levels generally return to normal, although up to 25% of these women develop type 2 diabetes within 15 years.
Other Specific Diabetes
These include diabetes due to genetic effects in insulin secretion and its action,drug-induced diabetes and diabetes in association with endocrine disorders. Most of them require insulin for glycemic control.
Symptoms of Diabetes
Symptoms of both type 1 and type 2 diabetes include:
• Frequent urination
• Excessive thirst
• Extreme hunger
• Sudden weight loss
• Extreme fatigue
• Irritability
• Blurred vision
Warning Signs of Hypoglycemia
Hypoglycemia (low blood sugar) occurs when blood sugar (glucose) levels fall below normal. Patients with type 1 diabetes should be aware of these symptoms of hypoglycemia:
• Sweating
• Trembling
• Hunger
• Rapid heartbeat
• Confusion
It is important to quickly treat hypoglycemia and raise blood sugar levels by eating sugar, sucking on hard candy, or drinking fruit juice. Patients who are at risk for hypoglycemia should carry some sugar product with them in case an attack occurs. In rare and worst cases, hypoglycemia can lead to coma and death. Regular blood sugar monitoring throughout the day can help you avoid hypoglycemia. Patients are also encouraged to wear a medical alert ID bracelet or necklace that states they have diabetes and that they take insulin.
Causes
Autoimmune Response
Type 1 diabetes is usually a progressive autoimmune disease, in which the beta cells that produce insulin are slowly destroyed by the body’s own immune system. It is unknown what first starts this cascade of immune events, but evidence suggests that both a genetic predisposition and environmental factors, such as a viral infection, are involved.
Genetic Factors
Researchers have found at least 18 genetic locations, labelled IDDM1 - IDDM18, which are related to type 1-diabetes. The IDDM1 region contains the HLA genes that encode proteins called major histocompatibility complex. The genes in this region affect the immune response. New advances in genetic research are identifying other genetic components of type 1 diabetes. Other chromosomes and genes continue to be identified.
Most people who develop type 1 diabetes, however, do not have a family history of the disease. The odds of inheriting the disease are only 10% if a first-degree relative has diabetes, and even in identical twins, one twin has only a 33% chance of having type 1-diabetes if the other has it. Children are more likely to inherit the disease from a father with type 1 diabetes than from a mother with the disorder. Genetic factors cannot fully explain the development of diabetes. Over the past 40 years, a major increase in the incidence of type 1 diabetes has been reported in certain European countries, and the incidence has tripled in the U.S.
Viruses
Some research suggests that viral infections may trigger the disease in genetically susceptible individuals. Among the viruses under scrutiny are enteric viruses, which attack the intestinal tract. Coxsackieviruses are a family of enteric viruses of particular interest. Epidemics of Coxsackie virus, as well as mumps and congenital rubella, have been associated with incidence of type 1 diabetes.
Secondary Complications of diabetes
People with type 2 diabetes are also at risk for nerve damage (neuropathy) and abnormalities in both small and large blood vessels (vascular injuries) that occur as part of the diabetic disease process. Such abnormalities produce complications over time in many organs and structures in the body. Although these complications tend to be more serious in type 1 diabetes, they still are of concern in type 2 diabetes. Most people with diabetes should aim for fasting blood glucose levels of less than 110 mg/dL and haemoglobin HbA1C of less than 7%.
Nephropathy
Kidney disease (nephropathy) is a very serious complication of diabetes. With this condition, the tiny filters in the kidney (called glomeruli) become damaged and leak protein into the urine. Over time, this can lead to kidney failure. Urine tests showing microalbuminuria (small amounts of protein in the urine) are important markers for kidney damage. Diabetic nephropathy, the leading cause of end-stage renal disease (ESRD), occurs in about 20 - 40% of patients with diabetes. Patients with ESRD have 13 times the risk of death compared to other patients with type 1 diabetes. If the kidneys fail, dialysis is required. Symptoms of kidney failure may include swelling in the feet and ankles, itching, fatigue, and pale skin color. The outlook of end-stage renal disease has greatly improved during the last four decades for patients with type 1 diabetes, and fewer people with type 1 diabetes are developing ESRD.
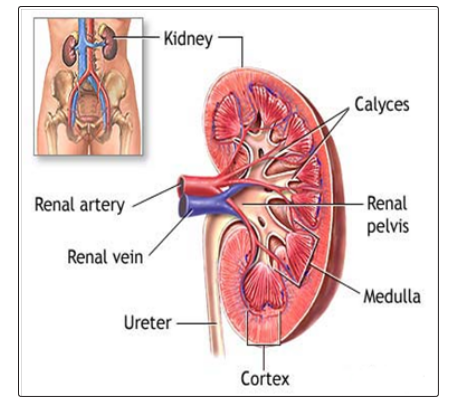
The kidneys are responsible for removing wastes from the body, regulating electrolyte balance and blood pressure, and stimulating the production of red blood cells.
Neuropathy
Diabetes reduces or distorts nerve function, causing a condition called neuropathy. Neuropathy refers to a group of disorders that affect nerves. The two main types of neuropathy are: Peripheral (affects nerves in the toes, feet, legs, hand, and arms); Autonomic (affects nerves that help regulate digestive, bowel, bladder, heart, and sexual function). Blood sugar control is an essential component in the treatment of neuropathy. Studies show that tight control of blood glucose levels delays the onset and slows progression of neuropathy. Heart disease risk factors may increase the likelihood of developing neuropathy. Lowering triglycerides, losing weight, reducing blood pressure, and quitting smoking may help prevent the onset of neuropathy Symptoms include:
• Tingling
• Weakness
• Burning sensations
• Loss of the sense of warm or cold
• Numbness (if the nerves are severely damaged, the patient may be unaware that a blister or minor wound has become infected)
• Deep pain
• Digestive problems (constipation, diarrhea, nausea, vomiting)
• Bladder infections and incontinence
• Erectile dysfunction
• Heart problems. Neuropathy may mask angina, the warning chest pain for heart disease and heart attack. Patients with diabetes should be aware of other warning signs of a heart attack, including sudden fatigue, sweating, shortness of breath, nausea, and vomiting.
• Rapid heart rates
• Light-headedness’ when standing up (orthostatic hypotension)
Blood sugar control is an essential component in the treatment for neuropathy. Studies show that tight control of blood glucose levels delays the onset and slows progression of neuropathy. Heart disease risk factors may increase the likelihood of developing neuropathy. Lowering triglycerides, losing weight, reducing blood pressure, and quitting smoking may help prevent the onset of neuropathy.
Retinopathy and Eye Complications
The most common eye disorder in diabetes is retinopathy. People with diabetes are also at higher risk for developing cataracts and certain types of glaucoma, such as primary-open angle glaucoma (POAG). The risk for POAG is especially high for women with type 2 diabetes. Retinopathy is a condition in which the retina in the eye becomes damaged. The two primary abnormalities that occur are a weakening of the blood vessels in the retina and the obstruction in the capillaries probably from very tiny blood clots.
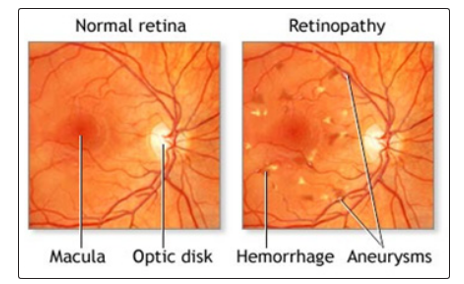
Diabetes causes an excessive amount of glucose to remain in the bloodstream, which may damage the blood vessels. Within the eye the damaged vessels may leak blood and fluid into the surrounding tissues and cause vision problems.
Cardiovascular Risk
CVD is a major complication of diabetes and the leading cause of early death among people with diabetes. About 65 percent of people with diabetes die from heart disease and stroke. High blood glucose in adults with diabetes increases the risk for heart attack, stroke, angina, and coronary artery disease. People with type 2 diabetes also have high rates of high blood pressure, lipid problems, and obesity, which contribute to their high rates of CVD.
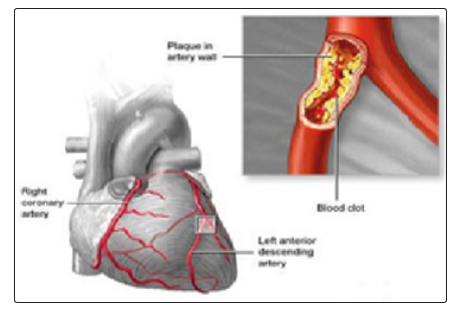
(Atherosclerosis is a disease of the arteries in which fatty material is deposited in the vessel wall, resulting in narrowing and eventual impairment of blood flow. Severely restricted blood flow in the arteries to the heart muscle leads to symptoms such as chest pain. Atherosclerosis shows no symptoms until a complication occurs.)
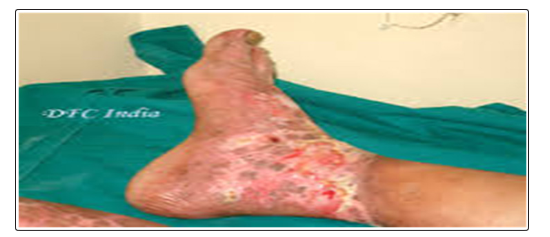
Foot Ulcers and Amputations
Diabetes is responsible for more than half of all lower limb amputations. Related conditions that put people at risk include peripheral neuropathy, peripheral artery disease, foot deformities, and a history of ulcers. In general, foot ulcers develop from infections, such as those resulting from blood vessel injury. Foot infections often develop from injuries, which can dramatically increase the risk for amputation. Even minor infections can develop into severe complications. Numbness from nerve damage, which is common in diabetes, compounds the danger since the patient may not be aware of injuries. About one-third of foot ulcers occur on the big toe.
Osteoporosis
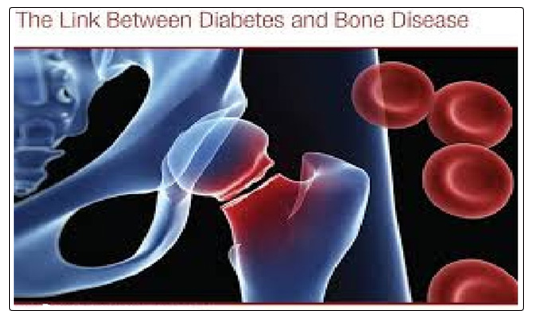
Type 1-diabetes is associated with a slightly reduced bone density, putting patients at risk for osteoporosis and possibly fractures. It is a major cause of disability in adults. Degeneration of cartilage and bones in joints is a common disorder that affects the knees, hips, shoulder and lowers back.
Mental Function and Dementia
Some studies indicate that patients with type 2 diabetes face a higher than average risk of developing dementia caused either by Alzheimer’s disease or problems in blood vessels in the brain. Problems in attention and memory can occur even in people under age 55 who have had diabetes for a number of years, Infections-Respiratory Infections. People with diabetes face a higher risk for influenza and its complications, including pneumonia, possibly because the disorder neutralizes the effects of protective proteins on the surface of the lungs. Everyone with diabetes should have annual influenza vaccinations and a vaccination against pneumococcal pneumonia. Urinary Tract Infections,women with diabetes face a significantly higher risk for urinary tract infections, which are likely to be more complicated and difficult to treat than in the general population.
Depression
Diabetes doubles the risk for depression. Depression, in turn, may increase the risk for hyperglycemia and complications of diabetes.
Hypoglycemia
Tight blood sugar (glucose) control increases the risk of low blood sugar (hypoglycemia). Hypoglycemia, also called insulin shock, occurs if blood glucose levels fall below normal. It is generally defined as blood sugar level below 70 mg/dL, although this level may not necessarily cause symptoms in all patients. Hypoglycemia may also be caused by insufficient intake of food, or excess exercise or alcohol. Usually the condition is manageable, but occasionally, it can be severe or even life. Mild hypoglycemia is common among people with type 2 diabetes, but severe episodes are rare, even among those taking insulin. Still, all patients who intensively control blood sugar (glucose) levels should be aware of warning symptoms.
Diabetic Ketoacidosis (DKA)
Diabetic ketoacidosis (DKA) is a life-threatening complication caused by insulin deficiency. Until recently, it was a complication almost exclusively of type 1 diabetes. In such cases, it is nearly always due to noncompliance with insulin treatments. However, DKA is being reported increasingly in patients with type 2 diabetes. It is not clear what causes total insulin depletion in these patients.
Infections
Respiratory Infections- People with diabetes face a higher risk for influenza and its complications, including pneumonia, possibly because the disorder neutralizes the effects of protective proteins on the surface of the lungs. Everyone with diabetes should have annual influenza vaccinations and a vaccination against pneumococcal pneumonia.
Urinary Tract Infections
Women with diabetes face a significantly higher risk for urinary tract infections, which are likely to be more complicated and difficult to treat than in the general population.
Other Complications
Diabetes increases the risk for other conditions, including: Hearing loss, periodontal disease, Carpal tunnel syndrome,Non-alcoholic fatty liver disease, also called nonalcoholic steatohepatitis (NASH), a particular danger for people who are obese, colorectal cancer.
Specific Complications in Women
Diabetes can cause specific complications in women. Women with diabetes have an increased risk of recurrent yeast infections. In terms of sexual health, diabetes may cause decreased vaginal lubrication, which can lead to pain or discomfort during intercourse.
Women with diabetes should also be aware that certain types of medication can affect their blood glucose levels. For example, birth control pills can raise blood glucose levels. Long-term use (more than 2 years) of birth control pills may increase the risk of health complications.
Diabetes and Pregnancy
Pregnancy in a patient with existing diabetes can increase the risk for birth defects. Studies indicate that high blood sugar levels (hyperglycemia) can affect the developing fetus during the critical first 6 weeks of organ development. Therefore, it is important that women with pre-existing diabetes (both type 1 and type 2) who are planning on becoming pregnant strive to maintain good glucose control for 3 - 6 months before pregnancy.
It is also important for women to closely monitor their blood sugar levels during pregnancy. For women with type 1 diabetes, pregnancy can affect their insulin dosing needs. Insulin dosing may also need to be adjusted during and following delivery
Diabetes and Menopause
The changes in estrogen and other hormonal levels that occur during perimenopause can cause major fluctuations in blood glucose levels. Women with diabetes also face an increased risk of premature menopause, which can lead to higher risk of heart disease.
Diabetes increases the risk for other conditions, including:
• Hearing loss
• Periodontal disease
• Carpal tunnel syndrome and other nerve entrapment syndromes
• Nonalcoholic fatty liver disease, also called nonalcoholic steatohepatitis (NASH); a particular danger for people who are obese
• Colorectal cancer
• Uterine cancer
Diagnosis
Healthy adults age 45 and older should get tested for diabetes every 3 years. Patients who are younger than age 45 and who have certain risk factors should ask their doctors about testing.
These risk factors include.
• A weight that is 20% more than ideal body weight.
• Age greater than equal to 30yrs and sedentary lifestyle.
• Central Obesity –Waist Hip ratio: Men greater than 0.90, Women greater than 0.85.
• Previously identified Impaired fasting Glucose (IFG) or Impaired Glucose Tolerance (IGT).
• High blood pressure (greater than 140/90) or unhealthy cholesterol levels -- especially for patients with low HDL (“good”) cholesterol and high triglyceride levels
• History of heart disease, stroke, peripheral artery disease and a close relative (parent, sibling) with diabetes.
• Having delivered a baby weighing over 9 pounds or having a history of gestational diabetes (in women)
• Polycystic ovary disease (in women)
Testing for Diabetes and Pre-Diabetes:
Fasting plasma glucose
The FPG test, alone or in combination with the oral glucose tolerance test (OGGT) can help diagnose pre-diabetes and diabetes. The fasting plasma glucose (FPG) test is the standard test for diabetes. It is a simple blood test taken after 8 hours of fasting. FPG levels indicate:
• Normal. 100 mg/dL (or 5.5 mmol/L) or below
• Pre-Diabetes. Between 100 - 125 mg/dL (5.5 - 7.0 mmol/L)
• Diabetes.126 mg/dL (7.0 mmol/L) or higher.
The FPG test is not always reliable, so a repeat test is recommended if the initial test suggests the presence of diabetes, or if the test is normal in people who have symptoms or risk factors for diabetes. The oral glucose tolerance test (OGTT) is more complex than the FPG and may over-diagnose diabetes in people who do not have it. Some doctors recommend it as a follow-up after FPG, if the latter test results are normal but the patient has symptoms or risk factors of diabetes. The test uses the following procedures: The patient first has an FPG test. The patient has a blood test 2 hours later, after drinking a special glucose solution.
OGGT levels indicate
• Normal. 140 mg/dL or below.
• Pre-Diabetes. Between 140 - 199 mg/dL
• Diabetes. 200 mg/dL or higher.
Random Blood Sugar test
A blood sample will be taken at a random time. Regardless of when you last ate, a random blood sugar level of 200 milligrams per decilitre (mg/dL) or higher suggests diabetes.
Glycated haemoglobin (A1C) test
This blood test indicates your average blood sugar level for the past two to three months. It measures the percentage of blood sugar attached to haemoglobin, the oxygen-carrying protein in red blood cells. The higher your blood sugar levels, the more haemoglobin you’ll have with sugar attached. An A1C level of 6.5 per cent or higher on two separate tests indicates that you have diabetes. An A1C between 5.7 and 6.4 per cent indicates pre diabetes.
Autoantibody Tests
Type 1 diabetes is characterized by the presence of a variety of antibodies that attack the islet cells. These antibodies are referred to as autoantibodies because they attack the body’s own cells, not a foreign invader. Blood tests for these autoantibodies can help differentiate between type 1 and type 2 diabetes.
Aims and Objectives
Diabetes is a major clinical and public health challenge within certain racial and ethnic group where both new cases of diabetes and risk of associated complication are great concern. Through the research work reduces the disease and economic burden of diabetes and improves the quality of life. For the purpose of project work, objectives are the most important aspect. These objectives are taken into consideration during collection of the data. On the basis of the review of exiting literature and imaginative thinking the researcher has formulated the following objectives in the present study.
• To relieve from symptoms withindiabetic period.
• To correct associated health problems and to reduce morbidity, mortality and economic cost of diabetes.
• To prevent as much as possible acute and long term complications and to provide timely intervention.
• To improve quality of life and productivity of the individual with diabetes.
• To ensure normal growth and development including physical, mental, emotional, and sexual development.
• To prevent adverse psychological effect.
• To discuss and focus on clinical knowledge of diabetes and its complications affecting other body system.
• To study the causes of diabetes due to irregular dietary practices and find out the dietary pattern of the patients.
Hypothesis
Hypothesis is a tentative generalization, the validity of which has got to the tested. It is define by ecologist as “Tentative generalization” to which the researcher feels as walking attic to build a complete research pace. The hypothesis might have a positive or negative focus on the study to intent to know. A hypothesis is its initial statement by imaginative idea or more guides. As it is based on an accumulated previous knowledge the hypothesis is made in order to find out the correct explanation of phenomenon along with current research and findings through investigation. On the basis of a hypothesis fact are observed and collected. When by verification the hypothesis is found to be true theory is obtained.
Present to the above objectives the following hypothesis are tested in the study
• Diabetes is not only a disease, rather now days it is a life style disease.
• There will be more number of diabetic patients due lower sedentary life style and faulty food habits.
• Now days the secondary complication of diabetes are very common but it is serious issue, as it hampers heath and wealth.
• Along with secondary complication, it is very difficult to sustain a normal life because hospitalization is required.
Review of Literature
Pre-diabetes Lifestyle Changes Can Slow Progression to Diabetes Mellitus. June 10 2014, Steven Milligan, MD
Diabetes mellitus is a major cause of morbidity and mortality in the United States, increasing the risk of coronary artery disease, stroke, kidney disease, and other life-threatening illnesses. Prediabetes, defined as an elevated blood glucose level that is not yet high enough to be classified as type 2 diabetes mellitus, is often a precursor to this disease. If left untreated, patients with prediabetes are at high risk of becoming diabetic; however, studies have shown that lifestyle changes, including losing weight and increasing physical activity, can prevent or delay the onset of diabetes. This article provides an overview of prediabetes and reviews the lifestyle interventions that can play a critical role in preventing patients with this condition from developing diabetes.
HbA1c as a Predictor of Diabetes and as an Outcome in the Diabetes Prevention Program: A Randomized Clinical Trial, Oct 21 2014, William C. Knowler
Glycated hemoglobin (HbA1c), a standard measure of chronic glycaemia for managing diabetes, has been proposed to diagnose diabetes and identify people at risk. The Diabetes Prevention Program (DPP) was a 3.2-year randomized clinical trial of preventing type 2 diabetes with a 10-year follow-up study, the DPP Outcomes Study (DPPOS). We evaluated baseline HbA1c as a predictor of diabetes and determined the effects of treatments on diabetes defined by an HbA1c ≥6.5% (48 mmol/mol). We randomized 3,234 non-diabetic adults at high risk of diabetes to placebo, metformin, or intensive lifestyle intervention and followed them for the development of diabetes as diagnosed by fasting plasma glucose (FPG) and 2-h postload glucose (2hPG) concentrations (1997 American Diabetes Association [ADA] criteria). HbA1c was measured but not used for study eligibility or outcomes. We now evaluate treatment effects in the 2,765 participants who did not have diabetes at baseline according to FPG, 2hPG, or HbA1c (2010 ADA criteria). Baseline HbA1c predicted incident diabetes in all treatment groups. Diabetes incidence defined by HbA1c ≥6.5% was reduced by 44% by metformin and 49% by lifestyle during the DPP and by 38% by metformin and 29% by lifestyle throughout follow-up. Unlike the primary DPP and DPPOS findings based on glucose criteria, metformin and lifestyle were similarly effective in preventing diabetes defined by HbA. HbA1c predicted incident diabetes. In contrast to the superiority of the lifestyle intervention on glucose-defined diabetes, metformin and lifestyle interventions had similar effects in preventing HbA1c-defined diabetes. The long-term implications for other health outcomes remain to be determined.
The Reality of Type 2 Diabetes Prevention, Richard Kahn/Mayer B. Davidson, April 2014
Efforts to reduce the burden of type 2 diabetes include attempts to prevent or delay the onset of the disease. Landmark clinical trials have shown that lifestyle modification programs focused on weight loss can delay the onset of type 2 diabetes in subjects at high risk of developing the disease. Building on this knowledge, many community-based studies have attempted to replicate the trial results and, simultaneously, payers have begun to cover diabetes prevention services. This article focuses on the evidence supporting the premise that community prevention efforts will be successful. Unfortunately, no study has shown that diabetes can be delayed or prevented in a community setting, and efforts to replicate the weight loss achieved in the trials have been mostly disappointing. Furthermore, both the clinical trials and the community-based prevention studies have not shown a beneficial effect on any diabetes-related clinical outcome. While the goal of diabetes prevention is extremely important, the absence of any persuasive evidence for the effectiveness of community programs calls into question whether the use of public funds or national prevention initiatives should be supported at this time.
Regression from Prediabetes to Normal Glucose Regulation Is Associated With Reduction in Cardiovascular Risk: Results From the Diabetes Prevention Program Outcomes Study, Leigh Perreault/MarinellaTemprosa/Kieren J. Mather/Ed Horton/ Abbas Kitabchi/Mary Larkin/Maria G. Montez/Debra Thayer/ Trevor J. Orchard/Richard F. Hamman/Ronald B. Goldberg.For the Diabetes Prevention Program Research Group, June 26 2014
Restoration of normal glucose regulation (NGR) in people with prediabetes significantly decreases the risk of future diabetes. We sought to examine whether regression to NGR is also associated with a long-term decrease in cardiovascular disease (CVD) risk. The Framingham (2008) score (as an estimate of the global 10-year CVD risk) and individual CVD risk factors were calculated annually for the Diabetes Prevention Program Outcomes Study years 1–10 among those patients who returned to NGR at least once during the Diabetes Prevention Program (DPP) compared with those who remained with prediabetes or those in whom diabetes developed during DPP (N = 2,775). The Framingham scores by glycaemic exposure did not differ among the treatment groups; therefore, pooled estimates were stratified by glycaemic status and were adjusted for differences in risk factors at DPP baseline and in the treatment arm. During 10 years of follow-up, the mean Framingham 10-year CVD risk scores were highest in the prediabetes group (16.2%), intermediate in the NGR group (15.5%), and 14.4% in people with diabetes (all pairwise comparisons P < 0.05), but scores decreased over time for those people with prediabetes (18.6% in year 1 vs. 15.9% in year 10, P < 0.01). The lower score in the diabetes group versus other groups, a declining score in the prediabetes group, and favourable changes in each individual risk factor in all groups were explained, in part, by higher or increasing medication use for lipids and blood pressure. Prediabetes represents a high-risk state for CVD. Restoration of NGR and/or medical treatment of CVD risk factors can significantly reduce the estimated CVD risk in people with prediabetes.
Weight management in overweight and obese patients with type 2 diabetes mellitus, IoannisKyrou, March 1 2013
Obesity is recognised as an important risk factor for type 2 diabetes, inducing insulin resistance and pancreatic beta-cell dysfunction. These obesity-related defects tend to progress following weight gain and can eventually lead to worsening hyperglycaemia over time. Thus, effective weight management is crucial for glycaemic control in overweight and obese patients with type 2 diabetes. Current standard strategies for weight management in these patients include lifestyle interventions and pharmacotherapy. Bariatric surgery has become a promising new option for the treatment of obese patients with type 2 diabetes and in recent years incretin-based therapies have become available, which exhibit favourable effects on body weight. Herein, the efficacy of available weight loss interventions is assessed and the role of newer antidiabetic agents examined, focusing on incretin-based therapies.
Role of self-care in management of diabetes mellitus, SaurabhRam Bihari Lal Shrivastava*, Prateek Saurabh Shrivastava and Jegadeesh Ramasamy, March 5 2013
Diabetes mellitus (DM) is a chronic progressive metabolic disorder characterized by hyperglycemia mainly due to absolute (Type 1 DM) or relative (Type 2 DM) deficiency of insulin hormone. World Health Organization estimates that more than 346 million people worldwide have DM. This number is likely to more than double by 2030 without any intervention. The needs of diabetic patients are not only limited to adequate glycemic control but also correspond with preventing complications; disability limitation and rehabilitation. There are seven essential self-care behaviours in people with diabetes which predict good outcomes namely healthy eating, being physically active, monitoring of blood sugar, compliant with medications, good problem-solving skills, healthy coping skills and risk-reduction behaviours. All these seven behaviours have been found to be positively correlated with good glycemic control, reduction of complications and improvement in quality of life. Individuals with diabetes have been shown to make a dramatic impact on the progression and development of their disease by participating in their own care. Despite this fact, compliance or adherence to these activities has been found to be low, especially when looking at long-term changes. Though multiple demographic, socio-economic and social support factors can be considered as positive contributors in facilitating self-care activities in diabetic patients, role of clinicians in promoting self-care is vital and has to be emphasized. Realizing the multi-faceted nature of the problem, a systematic, multi-pronged and an integrated approach is required for promoting self-care practices among diabetic patients to avert any long-term complications.
Intermittent fasting: a dietary intervention for prevention of diabetes and cardiovascular disease? James E Brown/Michael Mosley/Sarah Aldred, April 2 2013
Intermittent fasting, in which individuals fast on consecutive or alternate days, has been reported to facilitate weight loss and improve cardiovascular risk. This review evaluates the various approaches to intermittent fasting and examines the advantages and limitations for use of this approach in the treatment of obesity and type 2-diabetes.
Informing food choices and health outcomes by use of the dietary glycemic index, Chung-Jung Chiu/ Simin Liu /Walter C Willett /Thomas Ms Wolever /Jennie C Brand-Miller/ Alan W Barclay /Allen Taylor, April 1 2011
Considerable epidemiologic evidence links consuming lower glycemic index (GI) diets with good health, particularly upon aging. The GI is a kinetic parameter that reflects the ability of carbohydrate (CHO) contained in consumed foods to raise blood glucose in vivo. Newer nutritional, clinical, and experimental data link intake of lower dietary GI foods to favourable outcomes of chronic diseases, and compel further examination of the record. Based upon the new information there are two specific questions: 1) should the GI concept be promoted as a way to prolong health, and 2) should food labels contain GI information? Further, what are the remaining concerns about methodological issues and consistency of epidemiological data and clinical trials that need to be resolved in order to exploit the benefits of consuming lower GI diets? These issues are addressed in this review.
Type 2 diabetes and cardiovascular diseases: do they share a common soil? The Asian Indian experience, RajendraPradeepa/ AdamshaNazir/Viswanathan Mohan, March 23 2012
In India, diabetes and cardiovascular disease (CVD) are growing health problems. CVD accounts for much of the increased morbidity and premature mortality associated with type 2 diabetes. Moreover, CVD also occurs 2–3 decades earlier among diabetic subjects and runs a more aggressive course and has a worse prognosis. The pathophysiology of the link between diabetes and CVD is complex and multifactorial and understanding the mechanisms of the disease can help identify and treat CVD in patients with diabetes and vice versa. The current article reviews the common antecedents between type 2 diabetes and CVD including non-modifiable and modifiable risk factors and suggests that future research on diabetes and CVD should focus on searching for risk factors for CVD that may be more specific to diabetes, such as hypoglycaemia or medication related comorbidities. Also, the authors recommend research on common genetic variants which might have stronger effects and hence have a potential role in diabetes and CVD risk prediction. Finally, primary prevention trials trying to prevent both diabetes and CVD are the urgent need of the hour!
The Association Among Autonomic Nervous System Function, Incident Diabetes, and Intervention Arm in the Diabetes Prevention Program, May 2012, Mercedes R. Carnethon, Ronald J. Prineas, MD, PHD2, MarinellaTemprosa, MS3, Zhu-Ming Zhang, MD2, Gabriel Uwaifo, MD4, Mark E. Molitch, MD5 and for the Diabetes Prevention Program Research Group
Autonomic nervous system dysfunction, a correlate of obesity and poor cardiorespiratory fitness, is associated with the development of diabetes. We tested whether estimates of autonomic nervous system function improved in the intensive lifestyle versus metformin or placebo arms of the Diabetes Prevention Program (DPP) and whether baseline or a change in autonomic nervous system function was associated with the development of diabetes over 3.2 years.In 2,980 DPP participants, 12-lead electrocardiograms were measured at baseline and annually. Heart rate, heart rate variability (HRV), and QT duration were used to estimate fitness and autonomic nervous system function.In the lifestyle arm, heart rate and QT indexes decreased, and HRV increased over time. The magnitude of decline in heart rate and QT duration was substantially smaller in the other arms, whereas HRV did not increase. Baseline heart rate was the only index significantly (P < 0.05) associated with incident diabetes after adjustment for demographics and weight change (hazard ratio for lifestyle and metformin arms = 1.19 and 1.17 per 10.6 beats/min, respectively). Decreases in heart rate and QT indexes and increases in HRV over time were associated with a lower risk of developing diabetes. The protective association between decreased heart rate and incident diabetes in the lifestyle arm remained significant after accounting for change in weight and physical activity.Indexes that reflect autonomic function and fitness improved (i.e., heart rate decreased and HRV increased) in the lifestyle modification arm of the DPP. Improvements in these indexes are inversely associated with the development of diabetes independent of weight change.
Vegetarian Diets and Diabetes, Kate Marsh, PhD/Jennie Brand-Miller, PhD, April 11 2011
A large body of evidence suggests that vegetarian and plant-based diets provide exceptional health benefits, including a reduced risk of obesity, diabetes, heart disease and some types of cancer, and increased longevity. Vegetarian diets are typically lower in fat, particularly saturated fat, and higher in dietary fiber. They are also likely to include more whole grains, legumes, nuts, and soy protein, which together provide micro-nutrients and protective factors at higher levels than most Western diets. In observational studies, a vegetarian or vegan diet is associated with reduced risk of development of type 2 diabetes and lower risk of complications in those with existing diabetes. Although it is often difficult to separate vegetarianism from other healthy lifestyle behaviours, this eating pattern and the absence of red meat and processed meat products may provide particular benefits in the management of diabetes and prediabetes. This article critically reviews the scientific evidence for the role of vegetarian diets in the prevention and management of diabetes.
Association of Central Aortic Pressures Indexes with Development of Diabetes Mellitus in Essential Hypertension, Ju-Yi Chen1/Chang-Hua Chou3/Yungling Leo Lee/ Wei-Chuan Tsai2/ Chih-Chan Lin2/Yao-Yi Huang5 /Jyh-Hong Chen2, June 3 2010
Diabetes mellitus (DM) and hypertension (HT) frequently coexist. Increased central aortic pressures indexes are associated with HT; however, possible associations of these indexes with future development of DM have never been studied in HT. We recruited 178 patients with uncomplicated nondiabetic HT in this study. Baseline glucose, insulin, lipid profiles, and central aortic pressure indexes obtained using applanation tonometry were measured at the beginning of the study. Patients were followed for new-onset DM.After a mean follow-up period of 31 ± 12 months, 22 patients (12.4%) developed new-onset DM. In multivariate regression analyses adjusted for age, sex, and mean blood pressure (BP) in model 1, we found that central systolic BP (CSBP; hazard ratio 1.24, 95% CI 1.10–1.41, P < 0.001), and augmentation index (AIx) corrected at heart rate 75/min (AIx75; hazard ratio 1.58, 95% CI 1.11–1.58, P < 0.05) were independent predictors for new-onset DM. After adjustment for age, sex, mean BP, glucose concentration, and β-blocker use in model 2, we found that CSBP (hazard ratio 1.36, 95% CI 1.19–1.55, P < 0.001) and AIx75 (hazard ratio 1.71, 95% CI 1.16–2.52, P < 0.01) were independent predictors for new-onset DM.CSBP and AIx75 were independent factors for future DM in essential hypertensive patients. Increased central pressure indexes were associated with risk of DM in essential hypertension.
Effect of 2 Liquid Nutritional Supplements for Diabetes Patients on Postprandial Glucose, Insulin Secretion, and Insulin Sensitivity in Healthy Individuals, Manuel González-Ortiz/ Maria G. Ramos-Zavala/Roberto C. González-López/José A. Robles-Cervan, Feb 15 2009
To compare the effect of 2 liquid nutritional supplements (Enterex Diabetic and Glucerna SR) designed for the patient with diabetes mellitus on postprandial glucose, insulin secretion, and insulin sensitivity in healthy individuals. Patients and Methods: A randomized, double-blind, crossover clinical trial was carried out in 14 healthy, young (average age 21.7 ± 2.8 years) volunteers. Each individual received a single administration of 232 kcal in 232 mL of Enterex Diabetic or in 237 mL of Glucerna SR. Three days later, the intervention was crossed using the opposite supplement. At the beginning of each administration and later at 30, 60, 90, and 120 minutes, glucose and insulin concentrations were measured. Triglyceride concentrations were measured at the beginning and at 120 minutes. Area under the curve of glucose and insulin was calculated. First-phase and total insulin secretion, as well as insulin sensitivity, were assessed. Results: Glucose concentration at 120 minutes was significantly lower after the administration of Enterex Diabetic in comparison with Glucerna SR (4.3 ± 0.6 vs 4.7 ± 0.4 mmol/L; P = .012). Enterex Diabetic compared with Glucerna SR showed a greater change of the glucose concentration from 0 to 120 minutes (–0.7 ± 0.6 vs –0.0± 0.4 mmol/L; P = .002). Administration of Enterex Diabetic decreased insulin concentrations at 120 minutes (60 ± 18 vs 48 ± 19 pmol/L; P = .013). Administration of Glucerna SR increased triglyceride concentration at 120 minutes (1.0 ± 0.3 vs 1.1 ± 0.4 mmol/L; P = .026). Conclusion: A single administration of Enterex Diabetic in healthy individuals decreased glucose and insulin concentrations at 120 minutes without any modification in triglyceride levels.
Effects of Glycemic Load on Metabolic Health and Type 2 Diabetes Mellitus, Christian K. Roberts, PhD/Simin Liu, M.D., Sc.DJuly 6 2009
A large body of epidemiologic evidence has demonstrated that the combination of a Western diet and lifestyle is primarily responsible for the increased metabolic disease risk, such as obesity, type 2 diabetes mellitus (T2DM), and metabolic syndrome, noted in society today. Thus finding optimal intervention strategies to combat these growing epidemics is imperative. Despite some controversy, a growing body of literature indicates that one aspect of diet that likely affects phenotypic outcomes and metabolic disease risk is the glycemic load (GL). This brief review will provide an overview of the GL concept; discuss epidemiologic work investigating relationships between both GL and metabolic risk factors, as well as intervention studies that have assessed the impact of GL on phenotypic outcomes related to T2DM and cardiovascular disease. Overall, a low dietary GL may be protective against metabolic disease and should be considered as a healthful dietary component.
Lifestyle and Risk of Cardiovascular Disease and Type 2 Diabetes in Women: A Review of the Epidemiologic Evidence, Shari S. Bassuk, JoAnn E. Manson, MD, DrPH, Jan 5 2008
Cardiovascular disease is the leading cause of death among both women and men in the United States, accounting for nearly half of all deaths and considerable morbidity. Type 2-diabetes is a major risk factor for cardiovascular disease and one that is particularly potent in women; its prevalence has increased dramatically in recent years. Epidemiologic data indicate that cardiovascular disease and type 2 diabetes share common risk factors and are largely preventable; indeed, findings from the Nurses’ Health Study suggest that 74% of cardiovascular disease cases, 82% of coronary heart disease cases, and 91% of diabetes cases in women could be prevented by not smoking, engaging in regular physical activity, maintaining a healthy weight, eating healthier food, and drinking moderate amounts of alcohol. This article reviews lifestyle risk factors and preventive strategies for cardiovascular disease and type 2 diabetes among women.
Nutrition for Women in the Prevention and Treatment of Type 2 Diabetes and Cardiovascular Diseases, thleen J. Melanson, PhD, RD, LD, June 8 2008
Awareness of women’s risks for type 2 diabetes and cardiovascular diseases must be promoted by health care professionals. For overweight and obese women, weight reduction is critical for reducing risks; prevention of excess weight gain must be encouraged for women of healthy body weight. Vulnerable times for weight gain during a woman’s life cycle include early adulthood, the childbearing years, and menopause. Thus, healthy diet and exercise behaviours must be particularly emphasized during these years. Polycystic ovary syndrome is also associated with obesity, insulin resistance, and cardiovascular disease risk and weight loss can lower these risks. Foods comprising diets associated with reduced cardiovascular disease and type 2 diabetes risks tend to be unrefined plant foods (vegetables, legumes, fruits, whole grains, nuts, seeds), low-fat dairy products, fish rich in omega-3 fatty acids, and lean sources of protein. Artificial Tran’s fatty acids should be avoided and saturated fats cholesterol, sodium, and added sugars minimized. A balance of micro-nutrients and fiber should be obtained from wholesome food sources rather than supplements. Dietary counselling for women should consider the context in which they live, cultural aspects, socioeconomic factors, menstrual cycle influences on food intake, and warning signs for eating disorders. Continued gender-specific research will be helpful in discerning the most effective lifestyle interventions for women.
State of the Art Reviews: Glycemic Index, Obesity, and Chronic Disease, Kate Marsh, M Nutr Diet April 7 2008
There is increasing evidence that both the amount and type of carbohydrate play an important role in weight management and risk of chronic disease. Classifying carbohydrates according to their post-prandial glycemic effect (i.e., the glycemic index of foods) has yielded more useful insights than the historical distinctions of simple versus complex chemical structure. Diets based on carbohydrate foods that are more slowly digested and absorbed (i.e., low glycaemic index diets) have been independently linked to reduced risk of type 2 diabetes, cardiovascular disease, and some types of cancer. In individuals with diabetes, intervention studies have shown improvements in insulin sensitivity and glycated hemoglobin concentration with low glycemic index diets. Research also suggests that low glycemic index diets may assist with weight management through effects on satiety and fuel partitioning. Although on-going research is needed, the current findings, together with the fact that there are no demonstrated negative effects of a low glycemic index diet, suggest that the glycemic index should be an important consideration in the dietary management and prevention of obesity and chronic disease.
Nutrition Review: Diet and Nutrients in the Prevention and Treatment of Type 2 Diabetes, Kathleen J. Melanson, PhD, RD, LD, Oct 4 2007
Lifestyle factors, including diet, are critical in the prevention and treatment of type 2 diabetes. Because weight gain increases diabetes risk, and even modest weight reduction reduces risk, weight management is paramount in lessening the occurrence and effects of diabetes. Weight loss interventions should include patient education, behavioural strategies, physical activity, energy intake deficits of 500 to 1000 kcal/day, and prevention of recidivism. Macronutrient distribution ranges of diets for diabetic patients follow those of the Dietary Reference Intakes, allowing for individualization according to a patient’s metabolic responses, needs, and preferences. Nutrients to be limited include saturated fats, artificial trans fats, cholesterol, and sodium, whereas nutrients to be emphasized include monounsaturated fatty acids, omega-3 polyunsaturated fatty acids, fibers, antioxidants, and minerals, including potassium, magnesium, calcium, and chromium. Food sources are advised rather than supplements. Sugars can be isocalorically substituted for starches without detriments to glycemic control. Diets with low glycemic index or load may have modest benefits in managing type 2 diabetes. If a diabetic patient chooses to consume alcohol, he or she should do so in moderation. Foods advocated in type 2 diabetes are similar to those that are also beneficial in reducing risk for other chronic diseases.
Dietary glycemic index, dietary glycemic load, and cardiovascular disease in middle-aged and older Swedish men, Emily B Levitan/ Murray A Mittleman/Niclas Håkansson/Alicja Wolk, June 5 2007
In women, dietary glycemic index (GI) and dietary glycemic load (GL) have been associated with cardiovascular disease; in men, however, the evidence for an association is weaker.We tested the hypothesis that men consuming diets high in GI or GL have a greater risk of cardiovascular disease. At baseline, we assessed dietary GI and dietary GL by using food-frequency questionnaires in 36 246 Swedish men aged 45–79 y without diabetes or prior cardiovascular disease. Participants were followed through inpatient, cause-of-death, and death registries from 1 January 1998 until 31 December 2003 for myocardial infarction, ischemic stroke, haemorrhagic stroke, and cardiovascular mortality and until 31 December 2005 for all-cause mortality. We used Cox models with age as the time scale to estimate relative risks adjusted for cigarette smoking, body mass index, physical activity, demographic characteristics, and nutritional factors. Dietary GI and dietary GL were not associated with myocardial infarction (n = 1324), ischemic stroke (n = 692), cardiovascular mortality (n = 785), or all-cause mortality (n = 2959). Dietary GL was associated with haemorrhagic stroke [n= 165; relative risk = 1.44 comparing extreme quartiles (95% CI: 0.91, 2.27); P for trend = 0.047]. Dietary GI and dietary GL were not associated with ischemic cardiovascular disease or mortality, but dietary GL was associated with a greater risk of haemorrhagic stroke. Discrepancies between these findings and those of previous studies may be due to variations in the associations by sex or to differences in dietary contributions to GI and GL.
Exercise and diet induced weight loss improves measures of oxidative stress and insulin sensitivity in adults with characteristics of the metabolic syndrome, R. Scott Rector / Shana O. Warner /Ying Liu , Pamela S. Hinton/ Grace Y. Sun/ Richard H. Cox / Craig S. Stump / M. Harold Laughlin/ Kevin C. Dellsperger/ Tom R.Thomas, Aug1 2007
Obesity and insulin resistance (IR) increase the risk for coronary heart disease; however, much of this risk is not attributable to traditional risk factors. We sought to determine whether weight loss associated with supervised aerobic exercise beneficially alters biomarkers of oxidative stress and whether these alterations are associated with improvements in measures of insulin resistance. Twenty-five sedentary and overweight to obese [body mass index (BMI) = 33.0 ± 0.8 kg/m2] individuals, with characteristics of the metabolic syndrome, participated in a 4- to 7-mo weight loss program that consisted of energy restriction (reduced by ~500 kcal/ day) and supervised aerobic exercise (5 days/wk, 45 min/day at 60% VÌ? O2 max; ~375 kcal/day). IR and insulin sensitivity were assessed by the calculation of the homeostasis model assessment (HOMA) and quantitative insulin sensitivity check index (QUICKI), respectively. Oxidative stress was assessed by oxidized LDL (oxLDL), myeloperoxidase (MPO), and low- and high- density lipoprotein (LDL and HDL) lipid hydroperoxide concentrations in serum. Indexes for antioxidative status included apolipoprotein A1 (apoA1) concentrations and paraoxonase-1 (PON1) activity and protein concentrations. Exercise- and diet-induced weight loss (~10%) significantly (P < 0.05) increased insulin sensitivity and reduced IR, ox LDL, and LDL lipid hydro peroxides but did not alter HDL lipid hydro peroxides or MPO concentrations. Lifestyle modification impacted systemic antioxidative status by increasing apoA1 concentrations and reducing serum PON1 protein and activity. Changes in oxidative stress were not associated with alterations in HOMA or QUICKI. Diet- and exercise-induced weight loss (~10%) improves measures of insulin sensitivity and beneficially alters biomarkers of oxidative status.
Glycemic index and glycemic load in relation to changes in body weight, body fat distribution, and body composition in adult Danes1, 2, 3, Helle Hare-Bruun/Anne Flint/Berit L Heitmann, Oct 8 2006
A diet with a high glycemic index (GI) and glycemic load (GL) may promote overconsumption of energy and increase the risk of weight gain. The objective of the study was to investigate the relation between GI and GL of habitual diets and subsequent 6-y changes in body weight, body fat distribution, and body composition in a random group of adult Danes. A prospective cohort study was conducted in a subsample of men and women from the Danish arm of the Monitoring Trends and Determinants in Cardiovascular Disease study. The subsample comprised 185 men and 191 women born in 1922, 1932, 1942, or 1952. A baseline health examination and a dietary history interview were carried out in 1987 and 1988; a follow-up health examination was performed in 1993 and 1994. Positive associations between GI and changes in body weight (ΔBW), percentage body fat (Δ%BF), and waist circumference (ΔWC) were observed in women after adjustment for covariates. Significant GI × sex × physical activity interactions for ΔBW, Δ%BF, and ΔWC were observed, and the associations in the sedentary women were particularly positive. No significant associations with GI were observed in men, and no significant associations with GL were observed in either sex. High-GI diets may lead to increases in BW, body fat mass, or WC in women, especially in sedentary women, which suggest that physical activity may protect against diet-induced weight gain. No associations with GI were observed in men, which suggest sex differences in the association between GI and obesity development.
Obesity, Inactivity, and the Prevalence of Diabetes and Diabetes-Related Cardiovascular Comorbidities in the U.S., Patrick W. Sullivan/Elaine H. Morrato/VahramGhushchyan/Holly R. Wyatt/James O. Hill, July 6 2005
Obesity and physical inactivity are established risk factors for type 2 diabetes and cardiovascular comorbidities. Whether adiposity or fitness level is more important to health is controversial. The objective of this research is to determine the relative associations of physical activity and BMI with the prevalence of diabetes and diabetes-related cardiovascular comorbidities in the U.S. The Medical Expenditure Panel Survey (MEPS) is a nationally representative survey of the U.S. population. From 2000 to 2002, detailed information on sociodemographic characteristics and health conditions were collected for 68,500 adults. Normal weight was defined as BMI 18.5 to <25 kg/m2, overweight 25 to ≤30 kg/m2, obese (class I and II) 30 to <40 kg/m2, and obese (class III) ≥40 kg/m2. Physical activity was defined as moderate/vigorous activity ≥30 min ≥3 days per week.The likelihood of having diabetes and diabetes-related cardiovascular comorbidities increased with BMI regardless of physical activity and increased with physical inactivity regardless of BMI. Compared with normal-weight active adults, the multivariate-adjusted odds ratio (OR) for diabetes was 1.52 (95% CI 1.25–1.86) for normal-weight inactive adults and 1.65 (1.40–1.96) for overweight inactive adults; the OR for diabetes and comorbid hypertension was 1.71 (1.32–2.19) for normal-weight inactive adults and 1.84 (1.47–2.32) for overweight inactive adults. Both physical inactivity and obesity seem to be strongly and independently associated with diabetes and diabetes-related comorbidities. These results support continued research investigating the independent causal nature of these factors.
Effects of an ad libitum low-glycemic load diet on cardiovascular disease risk factors in obese young adults, Cara B Ebbeling/ Michael M Leidig/Kelly B Sinclair/Linda G Seger-Shippee/ Henry A Feldman/David S Ludwig, May 9 2005
The optimal nutritional approach for the prevention of cardiovascular disease among obese persons remains a topic of intense controversy. Available approaches range from conventional low-fat to very-low-carbohydrate diets. The aim of this pilot study was to evaluate the efficacy of an ad libitum low-glycemic load diet, without strict limitation on carbohydrate intake, as an alternative to a conventional low-fat diet. A randomized controlled trial compared 2 dietary treatments in obese young adults (n = 23) over 12 mo. The experimental treatment emphasized ad libitum consumption of low-glycemic-index foods, with 45–50% of energy from carbohydrates and 30–35% from fat. The conventional treatment was restricted in energy (250–500 kcal/d deficit) and fat (<30% of energy), with 55–60% of energy from carbohydrate. We compared changes in study outcomes by repeated-measures analysis of log-transformed data and expressed the results as mean percentage change.
Results
Body weight decreased significantly over a 6-mo intensive intervention in both the experimental and conventional diet groups (−8.4% and −7.8%, respectively) and remained below baseline at 12 mo (−7.8% and −6.1%, respectively). The experimental diet group showed a significantly greater mean decline in plasma triacylglycerols than did the conventional diet group (−37.2% and −19.1%, respectively; P = 0.005). Mean plasminogen activator inhibitor 1 concentrations decreased (−39.0%) in the experimental diet group but increased (33.1%) in the conventional diet group (P = 0.004). Changes in cholesterol concentrations, blood pressure, and insulin sensitivity did not differ significantly between the groups. An ad libitum low-glycemic load diet may be more efficacious than a conventional, energy-restricted, low-fat diet in reducing cardiovascular disease risk.
Interventions and the Prevention and Treatment of Type 2 Diabetes, Mary Beth Weber, MPH/Jennifer G. Twombly, MD, PhD, Nov 4 2010
The diabetes epidemic is fueled by a societal increase in insulin resistance, caused by lifestyle factors, particularly excessive caloric intake and physical inactivity. Aging also plays a role in the increase in insulin resistance; however, even in older populations, the increase in insulin resistance appears to be attributable mainly to age-related obesity and inactivity. Insulin resistance reflects deposition of visceral, hepatic, and intramyocellular fat, while toxic messages from the adipose organ (free fatty acids, cytokines, and oxidative stress) impair insulin action to restrain glucose production in the liver and promote glucose disposal in muscle. Unexercised muscle is also insulin resistant because of intracellular sequestration of glucose transporters. These processes lead to hyperglycemia if compensatory secretion of insulin is inadequate due to decreases in pancreatic β-cell function and mass, ultimately resulting in the development of prediabetes and, later, type 2 diabetes mellitus (T2DM). Lifestyle interventions, programs that promote diabetes risk reduction and weight loss through behaviour change, increased physical activity, and dietary modification, can decrease insulin resistance and prevent or delay the development of prediabetes and progression to T2DM. Lifestyle interventions are also important to improve diabetes management, particularly early in the natural history before loss of β-cell function and mass is so extensive that multidrug pharmacologic therapy is required. Effective interventions often include both an increase in physical activity (ideally, at least 150 minutes per week of moderate-to-vigorous aerobic exercise and strength training) and dietary modification to promote weight loss. Major contributor to morbidity and mortality, T2DM can lead to renal dysfunction, peripheral and autonomic neuropathy, vision problems, and cardiovascular disease. 2 In the United States alone, from 2005 to 2050, the prevalence of diagnosed diabetes is expected to more than double from 5.6% to 12.0%. 3 In 2005 to 2006, the prevalence of prediabetes and diabetes combined was estimated to be 42.3% for Americans aged 20 years or older.
Alcohol consumption and diabetes risk in the Diabetes Prevention Program, Jill P Crandall/SaritPolsky/Andrea A Howard/Leigh Perreault/George A Bray/Elizabeth Barrett-Connor/Janet Brown-Friday/Tracy Whittington/Sandra Foo/Yong Ma/Sharon L Edelstein/for the Diabetes Prevention Program Research Group, July 29 2009
Moderate alcohol consumption is associated with a decreased risk of type 2 diabetes in the general population, but little is known about the effects in individuals at high risk of diabetes. The objectives were to determine associations between alcohol consumption and diabetes risk factors and whether alcohol consumption was a predictor of incident diabetes in individuals enrolled in the Diabetes Prevention Program (DPP). DPP participants (n = 3175) had impaired glucose tolerance (2-h glucose: 7.8–11.1 mmol/L), elevated fasting glucose (5.3–7.0 mmol/L), and a body mass index (in kg/m2) ≥24. Participants were randomly assigned to placebo, metformin, or lifestyle modification and were followed for a mean of 3.2 y. Alcohol intake was assessed at baseline and year 1 by using a semiquantitative food-frequency questionnaire. Diabetes was diagnosed by annual oral-glucose-tolerance testing and semi-annual fasting plasma glucose measurement. Participants who reported higher alcohol consumption tended to be male, older, white, and less obese and to have a higher calorie intake and a higher HDL-cholesterol concentration. Higher alcohol consumption was associated with lower insulin secretion at any level of insulin sensitivity. We found lower incidence rates of diabetes with higher alcohol consumption in the metformin (P < 0.01 for trend) and lifestyle modification (P = 0.02 for trend) groups, which remained significant after adjustment for multiple baseline covariates. No similar association was observed in the placebo group. Despite overall low rates of alcohol consumption, there was a reduced risk of incident diabetes in those who reported modest daily alcohol intake and were assigned to metformin or lifestyle modification. Moderate daily alcohol intake is associated with lower insulin secretion-an effect that warrants further investigation. This trial was registered at clinicaltrials.
Value of Urinary Albumin-to-Creatinine Ratio as a Predictor of Type 2 Diabetes in Pre-Diabetic Individuals, Allon Friedman/ David Marrero/Yong Ma/Ronald Ackermann,/K.M. Venkat Narayan, Elizabeth Barrett-Connor/Karol WatsonWilliam C. Knowler/Edward S. Horton for the Diabetes Prevention Program Research Group, Sep 16 2008
The albumin-to-creatinine ratio (ACR) reflects urinary albumin excretion and is increasingly being accepted as an important clinical outcome predictor. Because of the great public health need for a simple and inexpensive test to identify individuals at high risk for developing type 2-diabetes, it has been suggested that the ACR might serve this purpose. We therefore determined whether the ACR could predict incident diabetes in a well-characterized cohort of pre-diabetic Americans. A total of 3,188 Diabetes Prevention Program (DPP) participants with a mean BMI of 34 kg/m2 and elevated fasting glucose, impaired glucose tolerance, and baseline urinary albumin excretion measurements were followed for incident diabetes over a mean of 3.2 years.Of the participants, 94% manifested ACR levels below the microalbuminuria range and 21% ultimately developed diabetes during follow-up. Quartiles of ACR (median [range] within quartiles: 1, 3.0 [0.7–3.7]; 2, 4.6 [3.7–5.5]; 3, 7.1 [5.5–9.7]; and 4, 16.5 [9.7–1,578]) were positively associated with age, markers of adiposity and insulin secretion and resistance, blood pressure, and use of antihypertensive agents with antiproteinuric effects and inversely related to male sex and serum creatinine. An elevated hazard rate for developing diabetes with doubling of ACR disappeared after adjustment for covariates. Within the DPP intervention groups (placebo, lifestyle, and metformin), we found no consistent trend in incident diabetes by quartile or decile of ACR. An ACR at levels below the microalbuminuria range does not independently predict incident diabetes in adults at high risk of developing type 2 diabetes.
Lifestyle Intervention for Pre-Diabetic Neuropathy, Gordon Smith/James Russell, Eva L. Feldman/ Jonathan Goldstein/ Amanda Peltier/ Sheldon Smith, /JouhainaHamwi/ Donald Pollari/ Billie Bixby/ James Howard/J. Robinson Singleton, June 10 2006
The purpose of this study was to evaluate intraepidermal nerve fiber density (IENFD) as a sensitive measure of neuropathy change in patients with neuropathy associated with impaired glucose tolerance (IGT) receiving lifestyle intervention based on that used in the Diabetes Prevention Program. We performed 3-mm skin biopsies with measurement of IENFD at the distal leg and proximal thigh at baseline and after 1 year in 32 subjects with IGT. Each received individualized diet and exercise counselling as a standard of care. Nerve conduction studies, quantitative sensory testing, quantitative sudomotor axon reflex testing, and the Michigan Diabetic Neuropathy score were performed, and a visual analog pain scale was completed. Two-hour oral glucose tolerance tests (OGTTs) following the American Diabetes Association guidelines were performed, and serum lipid levels were measured at baseline and 1 year later. Baseline distal IENFD was 0.9 ± 1.2 fibers/mm and proximal IENFD was 4.8 ± 2.3 fibers/mm. Baseline distal IENFD correlated with fasting glucose (P < 0.001) and OGTT (P < 0.01). After 1 year of treatment, there was a 0.3 ± 1.1-fiber/mm improvement in distal IENFD and a 1.4 ± 2.3-fiber/mm improvement in proximal IENFD (P < 0.004). The change in proximal IENFD correlated with decreased neuropathic pain (P < 0.05) and a change in sural sensory amplitude (P < 0.03).These findings indicate that diet and exercise counselling for IGT results in cutaneous re-innervation and improved pain. Skin biopsy was the most sensitive measure of neuropathy change over 1 year. IENFD should be included as an end point in future neuropathy trials.
Effect of Weight Loss with Lifestyle Intervention on Risk of Diabetes, Richard F. Hamman, MD/ Rena R. Wing/ Sharon L. Edelstein/ John M. Lachin/ George A. Bray/ Linda Delahanty/ Mary Hoskin/Andrea M. Kriska/ Elizabeth J. Mayer-Davis/ Xavier Pi-Sunyer/Judith Regensteiner/Beth Venditti/ Judith Wylie-Rosett and for the Diabetes Prevention Program Research Group, Sep 2006
Diabetes Prevention Program (DPP) participants randomized to the intensive lifestyle intervention (ILS) had significantly reduced risk of diabetes compared with placebo participants. We explored the contribution of changes in weight, diet, and physical activity on the risk of developing diabetes among ILS participants.For this study, we analysed one arm of a randomized trial using Cox proportional hazards regression over 3.2 years of follow-up. A total of 1,079 participants were aged 25–84 years (mean 50.6 years, BMI 33.9 kg/ m2). Weight loss was the dominant predictor of reduced diabetes incidence (hazard ratio per 5-kg weight loss 0.42 [95% CI 0.35–0.51]; P < 0.0001). For every kilogram of weight loss, there was a 16% reduction in risk, adjusted for changes in diet and activity. Lower percent of calories from fat and increased physical activity predicted weight loss. Increased physical activity was important to help sustain weight loss. Among 495 participants not meeting the weight loss goal at year 1, those who achieved the physical activity goal had 44% lower diabetes incidence. Interventions to reduce diabetes risk should primarily target weight reduction.
The Finnish Diabetes Prevention Study (DPS) Lifestyle intervention and 3-year results on diet and physical activity, July 17, 2003, JaanaLindström
To describe the lifestyle intervention used in the Finnish Diabetes Prevention Study, short- and long-term changes in diet and exercise behaviour, andeffect of the intervention on glucose and lipid metabolism. There were 522 middle-aged, overweight subjects with impaired glucose tolerance who were randomized to either a usual care control group or an intensive lifestyle intervention group. The control group received general dietary and exercise advice at baseline and had an annual physician’s examination. The subjects in the intervention group received additional individualized dietary counselling from a nutritionist. They were also offered circuit-type resistance training sessions and advised to increase overall physical activity. The intervention was the most intensive during the first year, followed by a maintenance period. The intervention goals were to reduce body weight, reduce dietary and saturated fat, and increase physical activity and dietary fiber. The intervention group showed significantly greater improvement in each intervention goal. After 1 and 3 years, weight reductions were 4.5 and 3.5 kg in the intervention group and 1.0 and 0.9 kg in the control group, respectively. Measures of glycemia and lipemia improved more in the intervention group.The intensive lifestyle intervention produced long-term beneficial changes in diet, physical activity, and clinical and biochemical parameters and reduced diabetes risk. This type of intervention is a feasible option to prevent type 2 diabetes and should be implemented in the primary health care system.
Methodology
Methodology is the logic of scientific procedure for the success of any kind of experienced investigation. Research method is described as a careful search or inquiry to discover new ideas by scientific study and a course of critical investigation. Methodology is the systematic and logical study of the principles guiding scientific investigation.
It is a search for materials and placing them or arranging them consistently in a sequential manner so as to research a certain conclusion.
According to Clifford Woody “Research is a careful inquiry or examination to ascertain something”. So the researcher should be conscious enough in choosing the right instrument and materials by which the project work can be done properly.
The method adopted to elicit information about the project work entitled “Secondary Complication of Diabetic Patients” – A study comprised of the following steps.
1. Researchdesign
2. Selection of study area
3. Selection of methods
4. Selection of sample
5. Data collection
6. Source of data collection
7. The questionnaire cum interview schedule
8. Conducting the survey
1. Research Design: A researcher design is defined as the plan, structure and strategy of investigation conceived so as to obtain answer to the research question and control variance. Therefore research plan adopted in this case is the overall scheme on the programme of research.
2. Selection of the study areas: The whole group from which the sample has been drawn is known as area of study. Before the researcher work started one should have the better ideas about the area of study. It is because the field of knowledge is so vast that unless the researcher chooses a particular area of study or he/she cannot involve himself/herself in any research work. For this present study a specific population of a selected area for data collection is very important in the survey work. The area selected for the topic is “LIFE SPAN (DIABETES AND CARDIOMETABOLIC CLINIC), CUTTACK, ODISHA. A sample of 100 diabetes patients of different age group has been chosen for the study through a questionnaire and interview method and number of patients from all over ODISHA are also involved in the whole method.
3. Selection of the method: There various method for the collection of data. The method of data collection is much more important than selection of sampling as the social investigator deals with the units having dynamic flu action nature. There are many methods of data collection such as observation method, case study method; questionaries’ cum interview method was chosen for the survey in this study. It is a fact finding study. According to Pauline Young (1970) “interview may be regarded as a systematic method by which a person enters more or less imaginatively into the life of a comparative stranger”. The interviews were conducted personally for each diabetic patient after filling the questionnaire.
4. Selection of the sample: The method in which a small group is taken as the representative of the whole is known as “Sampling Method” but the group actually selected for the study is known as sample. In the present study sampling is more suitable method for conducting the study. The two basic requirement of the sample is representative and adequate. The samples are selected at random basis in order to find out the causes of diabetes, its secondary complications and required dietary changes accordingly. A total number of 100 samples belonging to various age group, sex, religions, occupation, income group and socio-economic status were selected for the study. According to Swaminathan (1974), in order to obtain a true representative sample,the sample should be selected at random.
5. Data Collection: The data collected by using oral questionnaire method, which was done by asking questions in the clinic with the help of associate doctors ,nurses and other non-clinical staff.
6. Sources of data collection: The researcher have collected the data from both documentary sources and field sources. Documentary sources include health reports and prescription given to him or her .Field sources from which the investigator has collected the data by asking a number of questions to the respondents.
7. The questionnaire cum-interview method: The questionnaire cum-interview schedule was involved to find out information about the topic. This technique has been devised to collect data directly from the subjects in the form of their self-explanatory reports. The questionnaire consists of the age, sex, occupation, socio-economic status, disease condition, symptoms and related question. The questionnaire is given in the appendix.
8. Conducting the survey: For conducting the survey the data collection is the most important part. In this study the data were collected by using the questionnaire cum interview schedule. The interviewer met the diabetic patients personally and free discussion was, made with them over the disease and the views given by them were recorded.
Anthropometry Assessment
Anthropometry measurement of human body reflects changes in morphological variations due to inappropriate food intake or malnutrition. A variety of anthropometry measurements can be made either covering the whole body or parts of the body.
Anthropometry measurements can be taken for cross sectional and longitudinal studies. In anthropometry measurements, there are no permanent standards as there is no uniformity of growth in subsequent generation. Local standard need to be developed by various ethnic groups.
The most common measures are:
• Body weight
• Body mass index
• Waist circumference
• Measurement of body fat
• Waist to Hip ratio
1. Body weight: An adult weighing 10 per cent more than the standard weight is overweight and 20 per cent more is obese. % Body weight excess of normal Degree of obesity
25 Mild
50 Moderate
75 Severe
100 Very Severe
2. Body mass index (BMI): BMI can be used to estimate, albeit crudely, the prevalence of overweight and obesity within a population and the risks associated with it. It does not, however, account for the wide variations in obesity between different individuals and populations. The classification of overweight and obesity, according to BMI, is shown in Table Classification of overweight in adults according to BMI
|
Classification |
BMI (kg/m2) |
Risk of comorbidities |
|
Underweight |
<18.5 |
Low (but risk of other clinical problems increased ) |
|
Normal range |
18.5--24.9 |
Average |
|
Overweight |
≥25.0 |
|
|
Pre-obese |
25.0--29.9 |
Increased |
|
Obese class I |
30.0--34.9 |
Moderate |
|
Obese class II |
35.0--39.9 |
Severe |
|
Obese class III |
≥40.0 |
Very severe |
3. Waist circumference: It is the most practical tool a clinician can use to evaluate a patient’s abdominal fat before and during weight loss treatment. High risk waist circumference: Men: >40 in (> 102 cm) women: >35 in (>88 cm) The above sex specific cut offs can be used to identity increased relative risk for the development of obesity associated risk factors in most adults with a BMI of 25-34.9.
4. Measurement of body fat: Various skin fold calipers have been devised. In practice (a) Harpender calipers (b) Lange calipers and (c) USA MRNL calipers are used to measure subcutaneous fat the triceps, abdomen and at a point equidistant from the tip of acromian and olecranon. Measurement of triceps should be less than 85-90 the percentile for the age.
5. Waist to Hip ratio: The predominant distribution of fat in an obese person, whether in the upper part or the lower part of the body, may deter- mine the disease pattern. But with upper body obesity the ratio is 0.9 in women and greater than 1.0 in males. Abdominal obesity does not always go hand in hand with overweight or obesity. The normal ratio-waist/hip = 0.7
Limitation
• The researcher faces many difficulties while collecting data.
• The study is limited to only 100 samples due to constrain of time.
• The area of study is limited only in CUTTACK, but patients are all over from ODISHA.
So instead of these difficulties, the researcher collects the data with great patience and persons evidence, which subsequently made her to produce the report.
Result and Discussion
The present study entitled “DIETARY AND LIFESTYLE MODIFICATION IN THE PREVENTATION OF DIABETES MELLITUS” requires utmost care of the data completely. The data has been collected through multiple choices. One must interpret the findings and identify to the reader that the chapter deals with the respondent’s attitude and view points towards the present health condition and the problems faced by them. The researcher tabulated all the complex open ended answer through consent analysis technique. The majority opinion of the respondents is taken into consideration for the interpretation of data.
Data as such have no meaning unless they are analysed to draw proper information. They need to be carefully edited, systematically, classified and tabulated. Scientifically analysed and intellectually interpreted to reach to the conclusion.
Good Barr and Scats Writes “Analysis is proper which enter into researcher in one or another from the very binging”. It may be fair to say that research consists in general of two larger steps, the gathering of data and the analysis of these data, but no amount of analysis can be valid from the data factors , which are not present.
The data collected are consolidated and findings are presented in terms of various tables and graphs. The clear picture of the present study has been presented objective wise or questionnaire wise as enumerated below.
Table No 1: Age Distribution of Diabetic Patients
|
SL NO |
Age of the patient |
No of respondents |
Percentage % |
|
1 |
Above 30 |
9 |
9% |
|
2 |
Above 45 |
44 |
44% |
|
3 |
Above 55 |
26 |
26% |
|
4 |
Above 65 |
21 |
21% |
|
Total |
100 |
100 |
|
Table no 1 shows the age distributions of diabetes patients like 9% are above 30, 44% are above 45, 26% are above 55 and 21% are above 65.
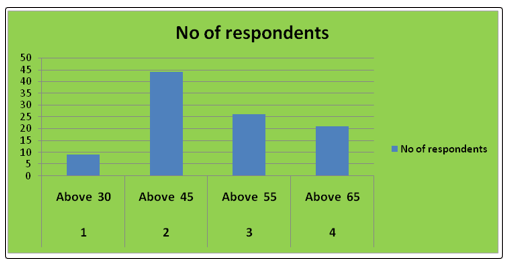
Table No 2: Sex Distribution of Diabetes Patient
|
SL NO |
Sex |
No of respondents |
Percentage % |
|
1 |
Male |
58 |
58% |
|
2 |
Female |
42 |
42% |
|
Total |
100 |
100% |
|
Table no 2 gives the details of sex distribution of diabetic patients. It is found that 58% are male whereas 42% are female.
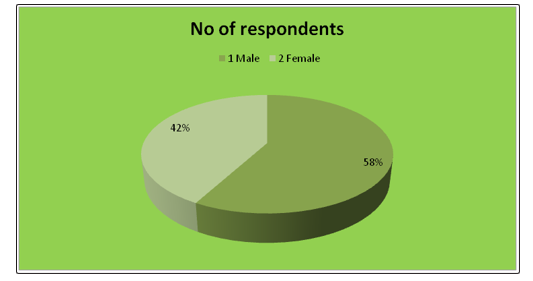
Table No 3: Religion of the Diabetic Patients
|
SL NO |
Religion |
No of the respondents |
Percentage |
|
1 |
Hindu |
61 |
61% |
|
2 |
Muslim |
9 |
9% |
|
3 |
Christian |
17 |
17% |
|
4 |
Sikh |
13 |
13% |
|
Total |
100 |
100% |
|
Table No 3 shows that 61% from Hindu, 9% from Muslim religion, 17% from Christian and 13% are from Sikh religion.
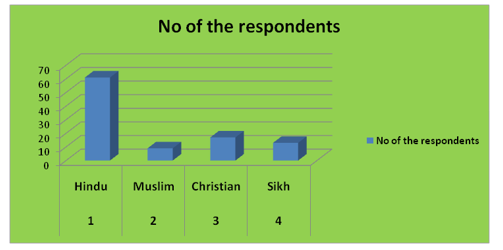
Table No 4: Places Consists More Number of Diabetic Patients
|
SL No |
Place |
No of respondents |
Percentage |
|
1 |
Urban |
48 |
48% |
|
2 |
Semi-Urban |
33 |
33% |
|
3 |
Rural |
19 |
19% |
|
Total |
100 |
100% |
|
Table no 4 indicates that urban diabetic patients are 48%, 33% belonging to semi-urban and 19 % belong to rural group.
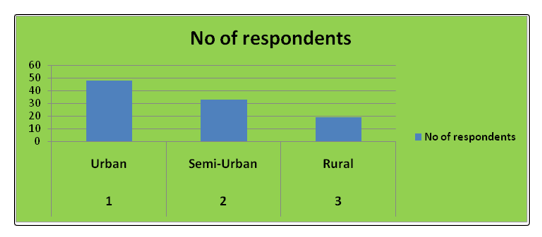
Table no 5: Family Income per Month of Diabetic Patients
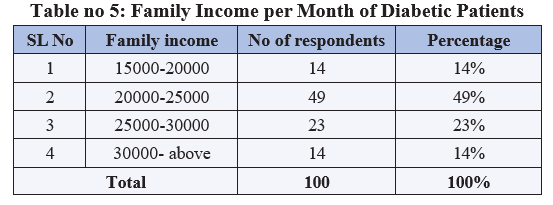
Table no 5 indicates that 14% belong to lower income group, 49 % are belong to middle income group, 23% re belong to middle high income group and 14% are belong to high income group.
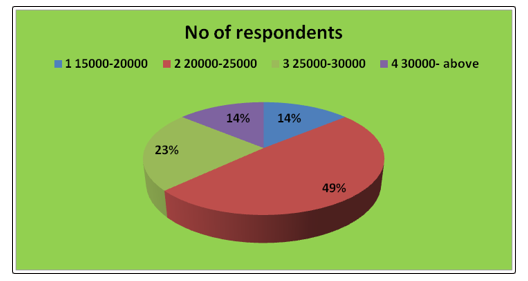
Table No 6: Daily Activity of Diabetes Patients
|
SL. No. |
Daily Activity |
No. of respondents |
Percentage |
|
1 |
Sedentary |
76 |
76% |
|
2 |
Moderate |
18 |
18% |
|
3 |
Heavy |
6 |
6% |
|
Total |
100 |
100 |
|
Table No 6 indicates the daily activity of diabetes patients .6% of patients are doing heavy work, 18% are doing moderate work and the rest 76% of patients are engaged in sedentary work
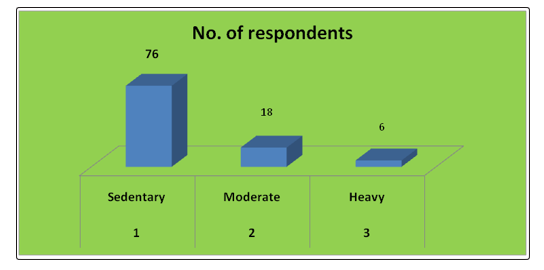
Table No 7: BMI of the respondents
|
SL. No. |
BMI of the respondents |
No. of respondents |
Percentage |
|
1 |
Normal |
13 |
13% |
|
2 |
Obese Grade-I |
32 |
32% |
|
3 |
Obese Grade – II |
38 |
38% |
|
4 |
Obese Grade – III |
17 |
17% |
|
Total |
100 |
100% |
|
Table No 7 reveals that 13% of the patients were normal weight, 32% of the patient Obese Grade-I, 38% are Obese Grade – II and 17% are Obese Grade – III.
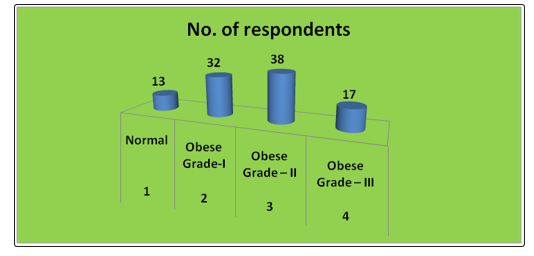
Table No 8: Regular Health Check Up of Diabetic Patients
|
SL. NO |
Regular health up |
No of respondents |
Percentage |
|
1 |
Yes |
53 |
53% |
|
2 |
No |
47 |
47% |
|
Total |
100 |
100 |
|
Table no-8 indicates that 53% are doing regular health check-up and 47 % are not doing any regular check-up
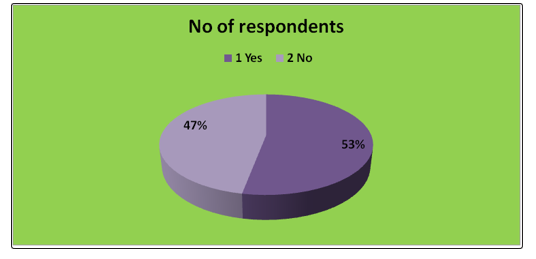
Table No 9: Types of Diabetes
|
SL. No. |
Types of Diabetes |
No of respondents |
Percentage |
|
1. |
Type –I |
28 |
28% |
|
2. |
Type –II |
66 |
66% |
|
3. |
Gestational |
06 |
6% |
|
Total |
100 |
100% |
|
Table No. 9 reveals that 28% of the patients were affected by Type-1, 66 % of the patient affected by Type –II diabetes and 6 % patient affected by gestational diabetes.
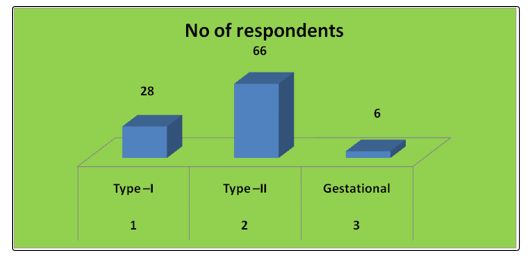
Table No 10: Family History of Diabetes
|
SL. NO. |
Family history |
No of respondents |
Percentage |
|
1 |
Yes |
69 |
69% |
|
2 |
No |
31 |
31% |
|
Total |
100 |
100 |
|
Table no 10 Indicates that 69% are having family history of diabetes and 31% didn’t have any family history.
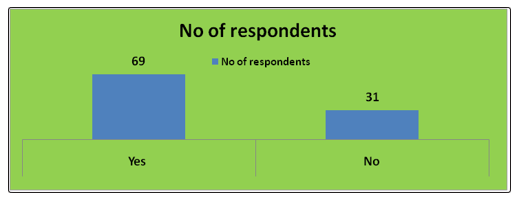
Table No 11: Symptoms of Diabetes
|
SL. NO. |
Family history |
No of respondents |
Percentage |
|
1. |
Polyuriea |
22 |
22% |
|
2. |
Polyphagia |
14 |
14% |
|
3. |
Polydispsia |
18 |
18% |
|
4. |
Weakness |
44 |
44% |
|
5. |
Weight loss |
12 |
12% |
|
6. |
Visual disturbance |
27 |
10% |
Table No 11 shows different symptoms of diabetes like Polyuria, polyphagia, Polydispsia, weakness, weight loss and visual disturbance were found among the patients.
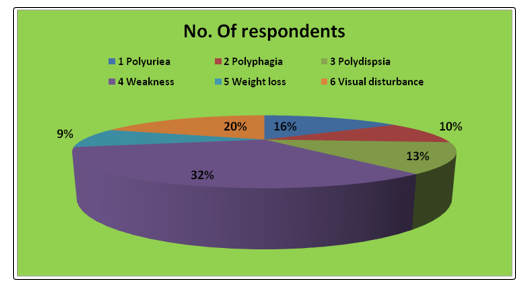
Table No 12: Diet of the Patients
|
SL. NO. |
Diet before diabetes |
No. of respondents |
Percentage |
|
1. |
High CHO diet |
71 |
71% |
|
2. |
Deep Fried food |
54 |
54% |
|
3. |
Processed food |
53 |
53% |
|
4. |
Salt/oil/High Glycaemic diet |
63 |
63% |
|
5. |
Soft drink /Ice-cream/Alcohol |
19 |
19% |
|
Total |
260 |
260% |
|
Table No 12 shows that most of the patients were having preference for spicy food, rich foot, fast food and too much sweets etc. This shows that faulty food habits & irregular diet were the main cause of onset of diabetes.
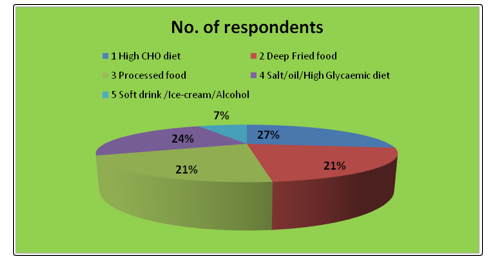
Table No 13: Food Habits
|
Sl. No. |
Food intake |
No. of respondents |
Percentage |
|
1. |
Vegetarian |
36 |
36% |
|
2. |
Non-vegetarian |
64 |
64% |
|
Total |
100 |
100% |
|
Table No 13 shows that 36% diabetes patients were vegetarian where as 64% were non vegetarian.
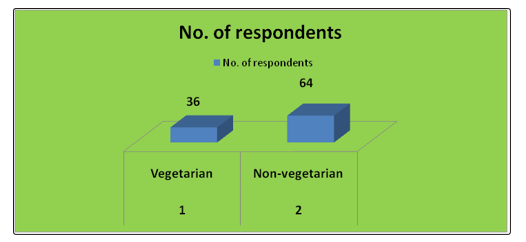
Table No 14: Regular Habits of Diabetic Patients
|
Sl. No. |
Food intake |
No. of respondents |
Percentage |
|
1. |
Vegetarian |
36 |
36% |
|
2. |
Non-vegetarian |
64 |
64% |
|
3 |
Tea |
92 |
92% |
|
4 |
Coffee |
8 |
8% |
|
Total |
135 |
135 |
|
Table No 14 indicates that 16% are consuming alcohol and 19% are consuming cigarette, 92% are consuming tea and 8% are consuming coffee
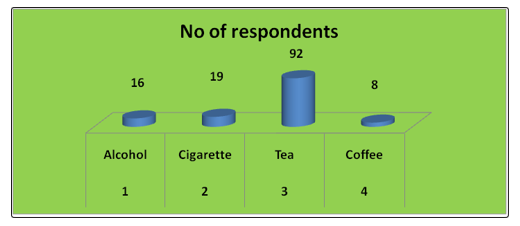
Table No 15: Appetite of Diabetic Patients
|
SL. No. |
Rate your appetite |
No of respondents |
Percentage |
|
1 |
High |
63 |
63% |
|
2 |
Medium |
26 |
26% |
|
3 |
Low |
11 |
17% |
|
Total |
100 |
100% |
|
Table No15 indicates that 63 % are high appetite, 26% are medium appetite and 11% are low appetite. Though advised by the Physician to restrict the diet, still large number of patients could not control their temptation and used to take calorie rich foods on various occasions and parties.
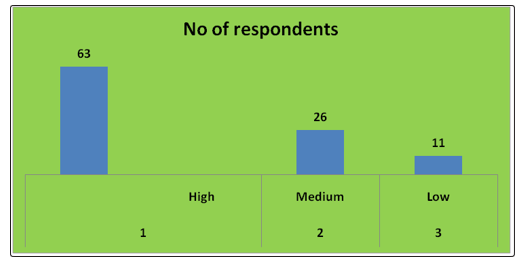
Table No 16: Suggestion Given By the Doctor
|
Sl. No. |
Suggestion |
No. of respondents |
Percentage |
|
1. |
Diet |
14 |
34% |
|
2. |
Medicine |
97 |
91% |
|
3. |
Exercise / Yoga |
94 |
94% |
|
4. |
Hormone Therapy |
02 |
2% |
|
5. |
Insulin |
19 |
92% |
|
6. |
Regular Check-up |
68 |
88% |
|
7. |
Rest |
7 |
7% |
Table No 16 revels that 97% patients were taking medicine, 14% patients were taking proper diet advice by the doctor, 68% doing regular check-up, 19% were taking insulin regularly. But it was observed that 56% of the respondents satisfied with dietary restriction where as 44% were unsatisfied with their dietary restriction
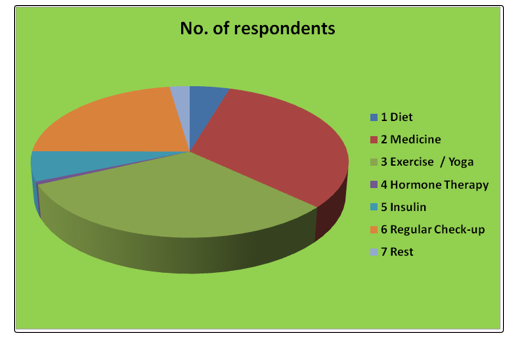
Table No 17: Suggestion Given By the Dietician
|
Sl. No. |
Suggestion |
No. of respondents |
Percentage |
|
1. |
Low CHO and high protein |
87 |
87% |
|
2. |
Low CHO and low protein |
13 |
13% |
|
3. |
Low CHO and low fat |
87 |
87% |
|
4. |
Low CHO and low sodium |
79 |
79% |
|
5. |
Low CHO and high calcium |
61 |
61% |
|
6. |
Exercise |
100 |
100% |
|
7. |
Yoga |
24 |
24% |
Table No 17 revels that 87% patients were taking Low cho and high protein, 13% patients were taking Low cho and low protein, 87% taking Low cho and low fat, 79% were taking Low cho and low sodium 61% are taking Low cho and high calcium . But 100 % of the respondents are suggested for Exercise and 24% are suggested for Yoga.
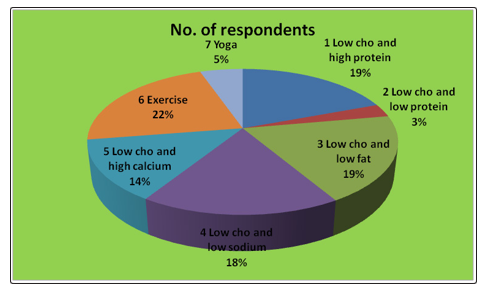
Table No 18: Doctor’s advice obeyed by the diabetic patients
|
SL No |
Obey Doctor Advice |
No of respondents |
Percentage |
|
1 |
Yes |
62 |
62% |
|
2 |
No |
38 |
38% |
|
Total |
100 |
100% |
|
Table no 18 indicates that 62% are obeyed the advice of doctor and 38% are not able to follow the doctor’s advice.
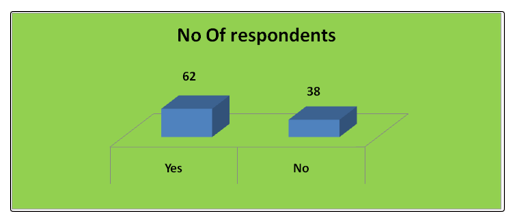
Table No 19: Blood Sugar Level of Diabetic Patients
|
SL No |
Blood sugar level(FBS) |
No of respondents |
Percentage |
|
1 |
140-200 |
23 |
23% |
|
2 |
200-250 |
58 |
58% |
|
3 |
250-above |
19 |
19% |
|
Total |
100 |
100% |
|
Table No 19 indicates that 23% are within 200, 58% are above 2000 and 19% are above 250.
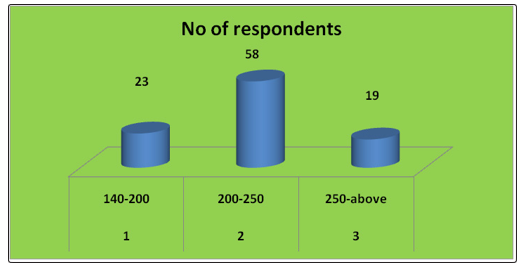
Table No 20: Control over Diabetes by Diabetic Patients
|
SL. No. |
Diabetes is in control |
No of respondents |
Percentage |
|
1 |
Yes |
27 |
37% |
|
2 |
No |
73 |
63% |
|
Total |
100 |
100% |
|
Table No 20 indicates that 27% are said that yes we have control over our diabetes and 73% said that we didn’t have control
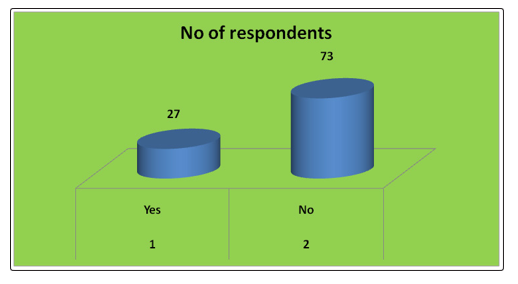
Table No 21: Medical History of Diabetic Patients
|
SL. No |
Medical History |
No of respondents |
Percentage |
|
1 |
Hypertension |
78 |
78% |
|
2 |
Anemia |
16 |
16% |
|
3 |
Kidney problem |
13 |
13% |
|
4 |
Eye Problem |
26 |
26% |
|
5 |
Obese |
81 |
81% |
|
6 |
Cardiac Disease |
18 |
18% |
|
7. |
Yoga |
24 |
24% |
Table No21 indicates 78% of patients are affected by hypertension, 16% by anemia, 13 % by kidney problem, 26% foot eye problem, 81% by obese 18% by cardiac disease
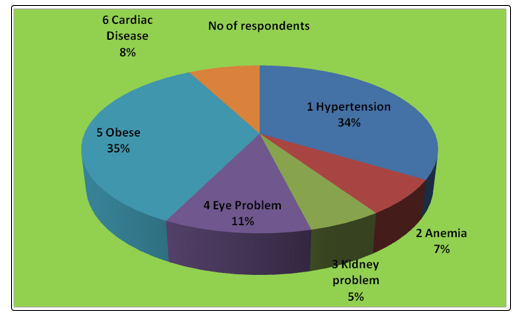
Table No 22: Secondary Complication of Diabetes
|
SL. No. |
Secondary Complication |
No. of respondents |
Percentage |
|
1 |
Neuropathy |
72 |
72% |
|
2 |
Nephropathy |
13 |
13% |
|
3 |
Retinopathy |
26 |
26% |
|
4 |
Foot Amputation |
7 |
7% |
|
5 |
Mental Function and Dementia |
12 |
12% |
|
6 |
Osteoporosis |
61 |
61% |
|
7 |
DKA |
4 |
4% |
Table No22 indicates 72% of patients are affected by neuropathy,13 % by nephropathy, 26% by retinopathy, 7% foot amputation, 12% by Mental Function and Dementia, 61% by Osteoporosis, 4% DKA
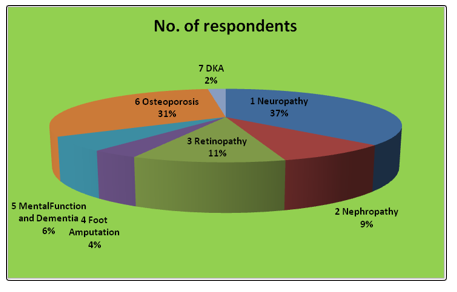
Table No 23: Source of Information of Diabetic Patients
|
SL. No. |
Medium to learn |
No of respondents |
Percentage |
|
1 |
Newspaper/Books/Magazine |
22 |
17% |
|
2 |
Television |
12 |
4% |
|
3 |
Internet |
14 |
14% |
|
4 |
Family/Friends |
27 |
23% |
|
5 |
Healthcare Providers |
68 |
68% |
Table no 23 indicates that the source of information of diabetic patients are 17% from newspaper,books,magazine,4% from Television ,14% by internet ,23% by family and relatives and 68% through healthcare provider.
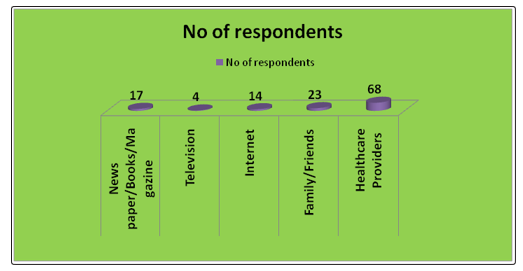
Table No 24: Response of Diabetic Patients during Dietary Management
|
SL. No. |
Response |
No of respondents |
Percentage |
|
1 |
Satisfied |
23 |
23% |
|
2 |
Unsatisfied |
12 |
12% |
|
3 |
Happy |
58 |
58% |
|
4 |
Irritated |
7 |
7% |
|
Total |
100 |
100% |
|
Table no 24 indicates that 23% of diabetic patients are satisfied, 12% are dissatisfied, 58% are happy and 7 are irritated.
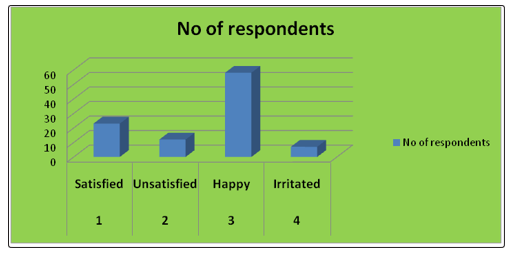
Table No 25: Response of Diabetic Patients towards Nutritional Intervention
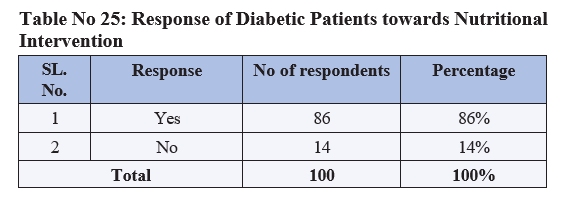
Table no -25 indicate that the positive response of diabetic patients toward nutritional intervention is 86% and negative response towards nutritional intervention is 14%.
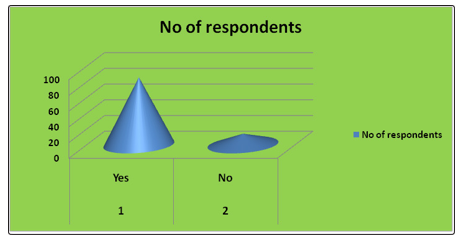
In the present study title “DIETARY AND LIFESTYLE MODIFICATION IN THE PREVENTATION OF DIABETES MELLITUS “100 samples of diabetes patients of various age groups are taken into consideration. From this random sample it was observed that a maximum numberof the patients are belonging to
The result indicates a clear cut male predominance of the disease where 62% of patients are male and 38% of female patients. This may be due to the ignorant attitude the disease or extravagant official dinner and parties.
Most of the patients belong to high income group and belong to Hindu religion mainly they leave in urban areas.
The group under the study are quite health conscious as most of them consulted the doctor immediately when they experienced the preliminary symptoms.
In most of the patients the blood sugar level is high, but in some cases it was in control because of the immediate and prompt prescription of the doctor and adequate consultation of the dietician.
Certain co morbid conditions associated with diabetes were found in the patients during the study that are: hypertension, eye problem, kidney problem, obesity, cardiac problem, anemia, renal disease etc.
During the interview it was found that before detection of disease they were consuming rich food, sweets, fast food, soft drinks, ice cream, package food and alcohol. They expressed that at present they are very much conscience about their dietary pattern to maintain the rest of life in good health. They sometimes feel dissatisfied with the restriction imposed on them, but as there is no option that sincerely obey the dietary pattern. Some of the patients confidently expressed that they sometimes go against the dietary advices and consume the prohibited diets. Suggestion given to the patients by the doctor included diet modification, medicines and yoga, exercise and regular health checkups.
Now the society is very much cautions about their health and wellbeing. The awareness may also be due to print and electronic media. Majority of patients are taking proper care of them and following all the prescribed devices of the dietician.
The modification of the diet from the very beginning of the disease detection can avert any further complication and aid in an easy to control of diabetes.
Thus in the present study gives the total idea about the disease. Its type’s, symptoms, complications and associated secondary complication related to it. This leads to onset of disease and its management of diet.
Summary and Suggestion
Planning Therapeutic Diets for Individuals
Appropriate Nutritional Care plays an important role in the successful disease management of a patient. An important first step in initiating Nutritional Care is evaluating the nutrition status of the individual. Assessment generates the information needed for a comprehensive approach to nutrition intervention. Planning appropriate diets to deliver the nutrients for the patients is part of Nutrition Intervention when implicated. Strategies and focus of care is based on status of health. Planning appropriate diets to deliver the nutrients for the patient is part of Nutrition Intervention to achieve the desirable health goals with patient focused expected personal and clinical outcomes. Diets that are formulated to optimize the nutritional needs of the patients in order to treat a multiplicity of diseases and disorders are known as therapeutic diets. “Therapeutic Diet” is defined as a diet intervention ordered by a health care practitioner as part of the treatment for a disease or clinical condition manifesting an altered nutritional status, to eliminate, decrease, or increase certain substances in the diet e.g. sodium, potassium.It requires not only the knowledge of the patient’s complex medical condition related to a disease and disease graphics that include diagnosis, etiology, pathophysiology, clinical manifestations and therapeutic management as well as the impact of on-going therapeutic interventions on the patient’s nutritional status and requirements. It also requires knowledge of nutrition and available evidence based dietary guidelines/recommendation for each disease condition and meal planning skill. Information required for planning diet, including nutrient composition and deciding the choice of routes of delivery of nutrients, are patient’s GI functional status, body temperature, hydration status, alteration in the nutrients and energy requirements, age, gender, physiological condition (pregnancy and lactation) height and weight status, food habits (vegetarian or non-vegetarian), preferences, presence of food allergies /intolerance and activity status-(ambulatory/bedridden), appetite level, chewing and swallowing abilities, tolerance for food by mouth. 36 Principles that govern meal planning are to be taken into consideration while planning therapeutic diets such as nutritional adequacy, caloric control, nutrient density, variety and balance, individuality and flexibility. RDA for nutrients should be considered for planning diets when no established guidelines are available to meet the nutritional needs of the patient. Therapeutic diets are adaptations of the normal or regular diet, usually a modification of a Regular diet. It is modified or tailored to fit the nutrition needs of a particular patient Therapeutic diets are modified for (1) nutrients (2) texture (3) food allergies or food intolerances (4) feed intervals. The hospitals with food service department attached to dietetics department will provide disease and condition specific therapeutic diets for oral and or enteral feeds that are tailored to the needs of patients. As prescribed therapeutic diets are to be translated to meal plans, menu formulated for planning meal should employ the recommended therapeutic diet. Meal plans and menu required for therapeutic diets should be developed by dieticians.
Energy Requirements
The level of energy intake from food that balances energy expenditure when the individual has a body size and composition and level of physical activity, consistent with long-term good health, also allowing for maintenance of economically essential and socially desirable activity. In children and pregnant and lactating women, it includes the energy needs associated with the deposition of tissues or secretion of milk at rates consistent with good health. Currently recommended metabolizable energy (ME) factor for different components of food is as follows:
|
|
Kcal /g |
|
Protein |
4 |
|
Fat |
9 |
|
Carbohydrate |
4 |
|
Dietary fibre |
2 |
Carbohydrate content = 100 - moisture - protein - fat - minerals - crude fibre
Protein Requirements
Dietary proteins should supply the eight essential amino acids (EAA) in proper proportions and in adequate quantities to synthesize tissue proteins in the body. The other twelve amino acids present in the dietary proteins, though required for the protein synthesis, are not considered essential since the body can synthesize them from other carbon and nitrogen sources. Since most of the body nitrogen requirements are met by protein nitrogen, protein and nitrogen requirements are used interchangeably. The efficiency of utilization of dietary protein depends upon its digestibility and absorption of the released amino acids. Egg protein in particular is used as a reference protein against which the quality of other proteins is considered. Vegetable proteins, mainly in cereals, legumes and vegetables are of poorer quality than animal proteins, not only because of their lower digestibility but also because they are limiting in one or more of the essential amino acids of human requirement. The daily requirement of protein for individuals of different age groups should be derived by a two-step process: First, the level of requirement per kg according to the age has to be chosen and next the actual daily requirement has to be computed for a given age by multiplying the requirement per kg by the standard weight-for-the-age (as per the new standard weights chosen).
Fat Requirements
Dietary fat consists of heterogeneous mixtures of triacylglycerols (triglycerides) and small proportions of phospholipids, glycolipids, monoacylglycerols, diacylglycerols and unsaponifiable fraction composed of fat soluble chemicals collectively designated as nonglyceride components. Fatty acids, the building blocks of various lipids, are classified into 3 groups: saturated fatty acids (SFAs), monounsaturated fatty acids (MUFAs) and polyunsaturated fatty acids (PUFAs). Fat enhances texture, taste and flavour of food, reduces its gastric emptying and thereby affects satiety. In the body, fatty acids, used for generation of cellular energy and biosynthesis of membrane lipids and lipid mediators, are essential in development of central nervous system, modulate lipoprotein metabolism and risk for diet-related non-communicable diseases (DR-NCD), namely, coronary heart disease (CHD), diabetes and cancers. Requirements of fats and oils for adults were set between 15-30% E (35% E for active individuals who are in energy balance), for women in reproductive age at least 20% E and 30-40% E in children up to 2years.
Dietary Fibre
The Meaning of the Term
Dietary Fibre went through a dramatic change over the past 30 years and the virtues of dietary fibre as a nutrient has received enormous attention in recent years. Earlier, the definition of fiber included all components of plant material that are not digested by the enzymes of the mammalian digestive system. The current definition of dietary fiberâ??Dietary fiber is the remnants of the edible part of plants and analogous carbohydrates that are resistant to digestion and absorption in the human small intestine with complete or partial fermentation in the human large intestine. It includes polysaccharides, oligosaccharides, lignin and associated plant substances. Dietary fiber exhibits one or more of either laxation (fecal bulking and softening; increased frequency; and/or regularity), blood cholesterol attenuation, and/or blood glucose attenuation. Organic acids (butyric acid) and polyols (sorbitol) are also considered as part of fiber. Animal foods do not contain any fiber.
Mineral Requirements
Calcium and Phosphorus
An important body function of Ca lies in the formation of the bone. Though small in quantity, non-skeletal Ca has the other important functions like neuromuscular excitation, blood coagulation, membrane permeability and others. The importance of Ca in these functions is reflected in the precision with which plasma Ca level is regulated. Calcium in bone plays a role in maintaining blood level even in the face of dietary Ca inadequacy. Blood calcium level is maintained within narrow limits by the interplay of vitamin D and several hormones, like Parathyroid hormone (PTH), thyrocalcitonin, and cortisol and gender steroids by controlling absorption, excretion and bone turnover. Calcium intake is fairly high, being in the range of 1 g or more a day in communities that consume plenty of milk as in the West, milk being a rich source of calcium. Other rich sources of Ca among plant foods 157 are the millet ragi (Eleusine Coracana), the pseudo cereal, rajkeera (Amaranthus) and the green leafy vegetables. The suggested elemental Ca:P ratio of 1:1 may be maintained in most age groups, except in infancy.
Magnesium
Magnesium deficiency in humans has been always found to be associated with other disease states mostly as inborn errors of absorption and not as an isolated magnesium deficiency. Like calcium, magnesium is closely associated with skeletal system and is homeostatically regulated by calcitropic hormones. Animal products, along with legumes and cereals help to ensure adequate consumption of Magnesium Symptoms of abnormal neuromuscular function occur in magnesium depletion associated with malabsorption syndromes like inflammatory bowel disease or sprue, primary idiopathic hypomagnesaemia and severe protein energy malnutrition. In severe deficiency, the subjects suffer often from tetany and convulsions. Hypomagnesemia, hypocalcemia and hypokalemia are always associated with magnesium deficiency and are reversed by magnesium repletion. The intakes were estimated to vary between 540 mg -1000 mg/d.
Sodium
Sodium is the principal cation of extracellular fluid and is involved primarily in the maintenance of osmotic equilibrium and extracellular fluid volume. Sodium functions as the-osmotic skeleton- of the extracellular fluid. Sodium is essential for normal growth and survival. Sodium ingested in the diet is absorbed from the gastrointestinal tract. The body content of the sodium and its concentrations in body fluids are under homeostatic control, kidney being the primary organ responsible for maintaining sodium balance through aldosterone action on renal tubular function. Intakes of 1.1- 3.3 g of sodium or 2.8-8.3 NaCl per day is considered to be safe and adequate for healthy adults, by the Food and Nutrition Board of National Academy of Sciences. Most dietary sodium is found in the form of sodium chloride, which are 40% sodium and 60% chloride. Excess sodium in the diet is said to contribute to hypertension in genetically prone individuals.
Potassium
Potassium content of the extracellular fluid is about 80 mmol, whereas in the tissue it is around 3500 mmol. Eighty percent of this amount is in the skeletal muscles. The potassium content of bones is negligible (7%). Concentration of potassium in the extracellular fluid is around 5 mmol/L while the cells have about 150 mmol/L. Potassium content decreases with age and adiposity. Potassium contributes to intracellular osmolality. Enzymes involved in glycosis and oxidative phosphorylation are potassium- dependent. It is involved in the maintenance of acid-base balance. The major sources of potassium are plant foods. Vegetable foods contain more potassium than sodium. In the diet, good sources are cereals, pulses, fruits and vegetables. Nuts and oilseeds can also contribute significant amounts. Potassium intake in our diet depends on the consumption of cereals, pulses and fruits. Diet can provide around 4-7.5 g (50-100 mmol/day) of potassium chloride
Iron Requirements
The iron requirement for adults is equivalent to bioavailable iron sufficient to replace daily endogenous losses referred to as obligatory or basal loss. The basal loss of iron in an adult man is around 14 µg/ kg body weight/ day and therefore, an adult male weighing 60 kg requires 0.84 mg of iron/ day. Iron requirement for growth refers to the iron needed for expansion of blood volume and the need for increase in lean body mass. Increase in lean body mass also requires iron, primarily for muscle myoglobin and also non-heme iron. The iron content of skeletal muscle is approximately 0.026 mg/g wet weight. If half of the increase in body weight is associated with greater muscle mass, the requirement would be 47 mg/y or 0.13 mg/d in this age group. Thus, the additional requirement during adolescence for the growth spurt (expansion of blood volume, increase in Hb concentration and increase in muscle mass) would be 12 µg/kg for boys and 8 µg/kg for girls (based on average of all groups). Girlswould require an additional 8 µg/ kg to compensate for menstrual blood loss.
Zinc Requirements
Adequate intake of Zn has been found necessary to reduce childhood illness, enhance physical growth and decrease morbidity and mortality in poor children. In fact, WHO recommends zinc supplementation during diarrhoeal infection and for treatment of severe malnutrition? Zinc is an integral component of many enzymes and is widely distributed in the body and skeletal tissue, and muscle and soft tissues are rich sources. Zinc has a role in stabilizing macromolecular structure and synthesis. The role of the metal ion in the DNA and RNA synthesis is well documented and both DNA and RNA polymerases are zinc-dependent enzymes. Zinc was shown to suppress free radical formation and regulate cellular signalling. Zinc deficiency is manifested with symptoms like growth failure, depressed immunity, anorexia, diarrhea, altered skeletal function and reproductive failure. Flesh foods, liver, fish and milk are very good sources of zinc. All food grains are good sources of zinc. Like iron, zinc is lost on milling and processing of the grains. Pulses and nuts are relatively rich sources of Zn. for individual; the RDA works out to be 12.5 mg/d or 12 mg/d.
Trace Elements Requirements
Among the trace elements other than Fe, Zn and I, the requirements for chromium, copper, fluoride, manganese, molybdenum, selenium have been studied in more detail and their recommended dietary intakes were suggested by different agencies.
Copper(Cu): The adult body contains approximately about 80 mg Cu mainly stored in liver, followed by brain and muscle. Sea foods, legume seeds and oilseeds like sesame, sunflower and nuts are rich sources of Cu. Fruits and vegetables are moderate sources. Cu is transported 229 in the form of ceruloplasmin in blood. Deficiency signs of copper include anemia, vascular complications, osteoporosis and neurological manifestations. The RDA of Cu is about 2 mg/d.
Manganese (Mn): Plant foods like wheat, barley, rice bran are rich in Mn. Fruits and vegetables are moderate sources and animal foods like eggs, beef and chicken contain low levels. Growth failure, skeletal abnormalities and impaired reproductive function have been reported to be caused in Mn deficiency. Abnormal insulin metabolism and glucose tolerance are the important effects attributed to Mn deficiency.
Chromium (Cr): Sea foods (oysters), meat and whole grain products are good sources, followed by egg, butter and tubers like potato. Cheese is a concentrated source of Cr. Fruits and vegetables, in general, are not good sources of Cr. In chromium deficiency, too, impaired glucose tolerance and weight loss along with peripheral neuropathy were observed. Cr deficiency attributable to its lack in the body was reported in total parenteral nutrition. In such cases Cr supplementation reversed symptoms of glucose intolerance and insulin requirement. There has been preponderance of evidence for Cr-potentiating insulin action both in vitro and in vivo. Cr was shown to be part of theGlucose tolerance factor and thus has an impact on glucose tolerance. Estimated requirements of adult male range between 50-200 μg Cr / d.
Selenium: Importance of Selenium (Se) in biology has been intimately connected with that of the trinity of antioxidants, the remaining two being cysteine and vitamin E. Selenium in food is present in at least two forms - as Selenomethionine in plant foods and selenocysteine in animal foods. Organ meat and sea foods are rich sources of selenium, their content in the diet being 0.10-1.3 μg/g. There are certain plant foods like mustard, and to a lesser extent garlic and broccoli, which accumulate Se from soil. Cereals and grains are major dietary sources of Se Cereals and grains are major dietary sources of Se. 9-80 μg Se requirements have been suggested. Glutathione peroxidase is the only selenoprotein enzyme well studied for the biological role of Se. Deiodinase isoenzymes that are involved in thyroid hormone metabolism are also selenium-containing proteins. Enzymes like thiolase and glycine reductase are the other less known sources of selenoproteins. Selenomethionine cannot be synthesized in the body. It can substitute for methionine in proteins or it can be converted to selenocysteine.
Iodine Requirements: Iodine is an essential micronutrient, which is required for the synthesis of thyroid hormone for optimal physical growth and development of humans. The healthy human body contains about 20 mg of iodine, 70-80% of which is concentrated in the thyroid gland. Iodine deficiency leads to enlargement of thyroid gland, known as endemic goitre, as well as a wide spectrum of disorders, which are termed as iodine deficiency disorders (IDD) which include abortion, stillbirths, low birth weight, cretinism, neonatal chemical hypothyroidism, psycho-motor defects, impaired coordination, mental retardation and hypothyroidism. About 90% of the iodine requirement is met through food, while the rest is obtained through drinking water. Daily intake of 10 g of iodized salt having iodine at a minimum level of 15 ppm provides about 150 g per day, in addition to iodine present in foods consumed. The normal daily dietary intake of iodine by an adult in an iodine sufficient region is about 100 to 150 g, which is readily absorbed from the gut. Kidneys excrete excess of iodine ingested.
Water Soluble Vitamins Thiamine: Thiamine pyrophosphate (TPP) is the coenzyme form of thiamine. In animals, TPP is involved in oxidative decarboxylation of-ketoacids like pyruvate, á ketoglutarate and ketoacids derived from branched chain amino acids, leucine, isoleucine and valine. Thiamine stores in the body are small and regular intake is necessary to maintain its metabolic functions. Rich sources of thiamine include whole grain cereals, nuts, legumes, green leafy vegetables, organ meats, pork, liver and eggs. Intakes above 0.3 mg/1000 kcal are consistent with good health.
Riboflavin: Riboflavin-derived coenzymes, FMN and FAD are cofactors of numerous enzymes involved in oxidation-reduction reactions. Several of these enzymes are involved in the process of energy transduction. Riboflavin is also involved in antioxidant activity, being 251 a cofactor for the enzymes like glutathione reductase and is required for the metabolism of other vitamins like vitamin B6, niacin and vitamin K. Rich dietary sources of riboflavin are flesh foods, poultry, dairy products, legumes, nuts and green leafy vegetables. Recommendation of 0.6 mg/1000 kcal.
Niacin: Nicotinic acid (niacin) and nicotinamide (niacinamide) are generally termed as niacin. Niacinamide is part of coenzymes connected with glycolysis, tissue respiration and synthesis of macromolecules. Niacin is also derived from the essential amino acid tryptophan as its metabolic end product and thus dietary tryptophan can spare the requirements of niacin. Foods of animal origin are rich sources of both tryptophan and niacin. Cereals are satisfactory sources of niacin in Indian diets; although in some foods like maize, the vitamin is present inbound or unavailable form. the average intake of niacin is around 10 mg daily.
Vitamin B6: The term vitamin B6 includes three vitamins, pyridoxine, pyridoxal, pyridoxamine and their phosphorylated derivatives. Thus vitamin B6 is needed for important pathways like gluconeogenesis, synthesis of neurotransmitters like serotonin, 261 dopamine, taurine, -aminobutyric acid, norepinephrine and histamine. Along with folic acid, vitamin B12 and riboflavin, vitamin B6 is needed for the metabolism of homocysteine. It is also involved in immune system and nucleic acid metabolism. Meat, fish, poultry, pulses, nuts and wheat are known to be rich sources of the vitamin, while other cereals, potato and banana are moderate sources. NRC (1989) has recommended 2.0 mg/day for adult males and 1.6 mg / day for adult females.
Folic Acid: The primary biochemical function of folic acid is to transfer a single carbon in the synthesis of a number of metabolites in the body.Folic acid is present in a wide variety of foods, both of plant and animal origin. Leafy vegetables, fruits and yeasts are particularly rich sources. Cereals and pulses contain fair amounts and pulses usually contain twice as much as cereals do. Chronic and severe forms of folic acid deficiency lead to abnormal hemopoiesis and megaloblastic anemia, which promptly responds to treatment with the vitamin. There have been suggestions to increase intake of folate to at least 400 μg per day to prevent chronic disease, particularly cancer and CVD.
Vitamin B12: Vitamin B12 or cyanocobalamin (cobalt contained in corrinoid ring structures) is a component of several coenzymes like that of folic acid and also shares and complements the functions catalyzing the same set of metabolic reactions. The vitamin is absent in plant foods except when contaminated with microbes. Liver, meat, egg and milk are good sources. Microflora in the large intestine produce vitamin B12 but the contribution from this source to the body needs is not evident. Efficiency of vitamin B12 leads to abnormal hemopoiesis, leading to megaloblastic anemia, as in the case of folic acid deficiency. In addition, neurological manifestations due to sub-acute combined 279 degeneration of spinal cord or demyelination of nerve fibresRecent FAO/WHO Consultation (12.6.5) on B12 requirements recommended an intake of 2.4 μg/d for adult.
Ascorbic Acid (Vitamin C): High intakes of ascorbic acid correlate with reduced gastric cancer risk Ascorbic acid (AA) or vitamin C is a six-carbon lactone which is synthesized from glucose by many animals, but not by man. It is an electron donor and therefore a reducing agent or antioxidant. Good sources of ascorbic acid include citrus fruits, tomatoes, berries and green vegetables. Potato is an important staple food in many countries that provide the required ascorbic acid even though its ascorbic acid concentration is low. his view is supported by the latest WHO recommendation (12.7.34), in fixing the ascorbic acid RDA at 40 mg/d.
Fat Soluble Vitamins
Vitamin A: Vitamin A (Retinol) is essential for normal vision, for maintaining the integrity of epithelial tissues and for a wide variety of metabolic functions. Considerable amounts of vitamin A can be stored in the liver and made available for use as the need arises. ods provide vitamin A either in the preformed state (directly as retinol or retinyl esters of fatty acids ) from animal sources such as milk, butter, egg and fish or its precursor carotenoids, especially carotene, derived from leafy vegetables and yellow- and orange-coloured fruits and vegetables. A in free living, well-nourished population and their dietary intakes, proposing requirements of 600 RE for a 65 kg man.
Vitamin D: Vitamin D is an unique vitamin and its availability in the body largely depends on its synthesis in the skin when exposed to sunlight and hence, its dietary requirement is usually very small especially in the Indian context. Diseases such as osteoporosis, diabetes, psoriasis, hypertension, arthritis, multiple sclerosis and CVD are known to have the involvement of vitamin D leading to the suggestion that the above spectrum of deficiency diseases be called vitamin D deficiency diseases (VDDD) as in the case of other micronutrients. It can be synthesized in the body in adequate amounts by simple exposure to bright sunlight even for 5 min per day (National Institute of Nutrition, Annual Report, 1981). The WHO Expert Committees recommended 200 Units (5 µg) /d for adult males. Vitamins E (Alpha tocopherol) and vitamin K: There are very limited data on vitamin E (alpha tocopherol ) and vitamin K requirements and those on intake are a little better vitamins E and K. They occur widely in vegetable oils and plant foods and 305 dietary deficiencies of these two vitamins are not normally encounteredAlpha tocopherol requirement is related to its protective antioxidant property on essential fatty acid content of the diet and the suggested intake is 0.8 mg per g of EFA. Vegetable oils and invisible fat of cereals and other foods like nuts and vegetables contribute to adequate tocopherol content in Indian diets.
Apart from its role in blood clotting mechanism, vitamin K is implicated in chemical modification of bone matrix and its turnover. Suggested an RDA of 7.5-10 mg α-tocopherol and 55 μg of vitamin K /d for adults.
Food Exchange Lists
There are three main groups of nutrients--the carbohydrate group, the meat and meat substitute group and the fat group. Starches, fruits, vegetables, milk and other carbohydrate sources are all considered part of the carbohydrate group. Foods in the fat group--monounsaturated, polyunsaturated and saturated fats are consumed in the smallest serving sizes. The foods within an exchange group are linked together because they are very similar. All starches have approximately the same amount of carbohydrates, protein, fat and calories per serving size. This is why one starch can be “exchanged” for another one on the list. In addition, foods on the starch, fruit and milk list are all similar in that they all contain between 12 to 15 grams of carbohydrate per serving.
Based on a specific calorie level that is usually established by a dietitian or physician, a meal plan is created using the exchange lists. A common nutrient balance is 50 to 60 percent carbohydrates, 20 percent protein and 20 to 30 percent fat. Since 1g carbohydrate = 4 calories, 1g protein = 4 calories and 1g fat = 9 calories, we can then calculate how many grams of carbohydrates, protein and fats can be consumed within the calorie level assigned. For example, if the calorie level was 1400, 700 to 840 calories (175 to 210g) would be from carbohydrate sources, 280 calories (70g) from protein and 280 to 420 calories (31 to 47g) from fat. A specific amount of exchanges from each group can then be determined to develop a meal plan. Or, a 2000 calorie a day diet may include 11 exchanges from the bread group, eight from meat, four from vegetables, three from fruits, four from fats and two from milk. The number of exchanges we’ll consume depends on our total caloric intake. If we need 2,000 calories daily, eat two milk, four fat, three fruit, four vegetable, eight protein and 11 starch exchanges. It’s important to put foods in their proper categories; cheese is actually a protein exchange, not a milk exchange -- only milk and yogurt and milk exchanges. Some foods require multiple exchanges, such as chips or crackers, which may be one starch plus one fat exchange.
There is no other disease which for greater through on diet than diabetes. Often mild and simple restrictions are sufficient to check the disease. The exchange food list helps the patient
1. To restrict the food intake according to the insulin prescription so that both hypoglycaemia and hyperglycaemia can be prevented.
2. To have a variety in the diet so that the patient can always adhere to it.
3. Easy learning of the principle of diet.
4. Since Diabetes is a chronic metabolic disease, patient has to be educated regarding diet prescription and thus food exchange list will help in this regard.
Cereal Exchange
This list the amount of raw cereals and their preparation for substituting foods of equal value in exchange
Each Cereal Exchange Contains:
Carbohydrate – 18-21 grams
Protein -1-3 grams
Energy - 85 Kcal
|
Food |
Gram |
|
Rice |
25 g. |
|
Vermicelli |
25 g. |
|
Wheat flour |
25 g. |
|
Ragi |
25 g. |
|
Sooji |
25 g. |
|
Rice flour |
25 g. |
|
Rice flake |
25 g. |
|
Puffed rice |
25 g. |
|
Idlli |
- |
|
Dosa |
- |
|
Chapati |
-- |
|
Upma |
- |
|
Bread |
50 g. |
|
Noddles |
|
Soya bean is a versatile and important food item for vegetarian diabetes.
Sprouts are healthier for diabetes. It has lot of vitamin content and low calorie value as it provides more fibre
Vegetable Exchange
Group A: Leafy Vegetables
Each Exchange Contains:
Carbohydrate – 4-8 grams
Protein - 1 gram
Energy – 30-40 Kcal
|
Food |
Amount |
|
Carrot leaves |
26g |
|
Cauliflower leaves |
61g |
|
Corriander leaves |
64g |
|
Drumstick leaves |
33g |
|
Fenugrick leaves |
48g |
|
Spinach |
134g |
|
Radish leaves |
143g |
|
Mustard leaves |
118g |
These vegetables may be used liberally as their carbohydrates and calories content is low. Most of the vegetables of this group are rich source of calcium, iron and vitamin hence their should be encouraged.
Group B: Roots and Tubers
Each Exchange Contain
Carbohydrate – 10grams
Protein – 2 grams
Energy – 25-50 Kcal
|
Food |
Amount |
|
Carrot |
79g |
|
Beetroot |
94g |
|
Sweet potato |
35g |
|
Tapioca |
30g |
|
Onion |
90g |
These vegetables contains concentrated sources of carbohydrates. Therefore it is recommended that the consumption of group B vegetables should be restricted by diabetic patients.
Group: c Other Vegetables
Each Exchange Contain:
Carbohydrate – 6 -9 grams
Protein – 3 grams
Energy – 40 Kcal
|
Food |
Amount |
|
Mushrooms |
100g |
|
Turnip |
90g |
|
Bitter gourd |
155g |
|
Parwal |
190g |
|
Drumstick |
128g |
|
Cauliflower |
93g |
|
Tomato |
170g |
|
Pea |
23g |
|
Lady’s finger |
96g |
|
Brinjal |
152g |
|
Capsicum |
163g |
|
Pumpkin |
126g |
Liberal servings can be used. They add bulk to the diet and increase suitability values of food.
Fruit Exchange
This list gives some amount of raw fruits for substituting of equal values in exchange.
Each Exchange Contain
Carbohydrate – 10 grams
Energy – 40 Kcal
|
Food |
Amount |
|
Amala |
4 -5 |
|
Apple |
1 small |
|
Banana |
½ small |
|
Dates |
2 |
|
Grape |
20 |
|
Guava |
1 medium size |
|
Jack fruit |
3 pieces |
|
Mango |
1 small |
|
Orange |
1 average |
|
Papaya |
2 -3 slice |
|
Pinaple |
1 slice |
|
Sepota |
1 small |
|
Water melon |
1 slice(200g) |
Milk Exchange
Each Exchange Contain
Carbohydrate – 4 grams
Protein – 5 grams
Fat – 3 grams
Energy – 65 Kcal
|
Food |
Amount |
|
Cow’s milk |
100 ml / ½ cup |
|
Buffalo ‘milk |
500 ml / 1/4 cup |
|
Curd |
100 ml |
|
Skimmed milk |
200 ml/1 cup |
|
Skimmed milk powder |
18 g/5tsp |
|
Whole milk powder |
13 g/3 tsp |
Meat exchange
Each exchange contain Protein
– 7.5 grams
Fat – 6 grams
Energy – 85 Kcal
|
Food |
Amount |
|
Beef |
75g |
|
Chicken |
75g |
|
Liver |
75g |
|
Pork |
75g |
|
Egg |
1 medium |
|
Meat |
50g |
|
Fish |
75-100g |
Fats and Oils Exchange
Fish and liver contain small amount of CHO. There is wide variation between items in this exchange.
Each Exchange Contain
Fat – 8 grams
Energy – 72 Kcal
|
Food |
Amount |
|
Vegetable /Sunflower /olive/corn/ cottonseed |
10g/2 tsp |
|
Ghee |
10g /2 ½ tsp |
|
Butter |
12 g/ 2 ½ tsp |
|
Cream |
20g |
|
Vanaspathi |
10g / 2 tsp |
|
Nuts |
15 – 20g/ 12 in no. |
These are unsaturated fats and their consumption is recommended in moderation instead of saturated fats. Those above all are the exchange lists of suggested food, which should be consumed by the patients to avoid secondary complication of diabetes by lowering the blood sugar level.
High Glycaemic Foods
White bread (only wheat endosperm), most white rice (only rice endosperm), corn flakes, extruded breakfast cereals, glucose, maltose, maltodextrins, potato, pretzels, bagels, pasta.
Medium Glycaemic Foods
whole wheat or enriched wheat, pita bread, basmati rice, unpeeled boiled potato, grape juice, raisins, prunes, pumpernickel bread, cranberry juice, regular ice cream, sucrose, banana.
Low Glycaemic Foods
Beans (white, black, pink, kidney, lentil, soy, almond, peanut, walnut, chickpea); small seeds (sunflower, flax, pumpkin, poppy, sesame, hemp); most whole intact grains (durum/spelt/kamut wheat, millet, oat, rye, rice, barley); most vegetables, most sweet fruits (peaches, strawberries, mangos); tomatoes; fructose; mushrooms; chilis.
Recommended 2000 Kcal Diabetes diet
|
Vegetarian |
Non-vegetarian |
|
Bed Tea-w/o sugar (Tea/Coffee), sugar free biscuit-2 no. |
Bed Tea-w/o sugar (Tea/Coffee),-sugar free biscuit-2 no |
|
Break Fast-chapati-2 no, veg-table-2 cup/DaliyaUpma with vegetable-2 cup, Green Chutney/ Brown Bread-3 no, Vegetable-2 cup/Small Idlli-4no, Samber-2 cup. (One low glycemic fruit for all) |
Break Fast-chapati-2 no,veg-table-2 cup/DaliyaUpma with vegetable-2 cup, Green Chutney/ Brown Bread-3no, Egg white 2 no /Small Idlli-4no, Samber-2 cup/ (One low glycemic fruit for all) |
|
Lunch-Salad-2cup, curd-2tbsp, Rice-2 up, chapati-1 no, Dal-cup, Vegetable-2 cup, Paneer-0.5 cup. |
Lunch-Salad-2 cup, curd-1tbsp, Rice-2 cup, chapati-1 no, Vegeta-ble-2 cup, Roasted Fish-0.5 cup. |
|
Snacks-Tea –w/o Sugar, Sugar free biscuit-2, Low glycemic fruit- 1no |
Snacks-Tea –w/o Sugar, Sugar free biscuit-2, Low glycemic fruit- 1no |
|
Dinner-Vegetable soup-2 cup, Chapati-2, Vegetable-2 Cup |
Dinner-Vegetable soup-2 cup, Chapati-2, Vegetable-2 Cup |
|
Oil To Cook- 4 to 5 Tsp, Kcal-2051, CHO-315gm, pro- tien-79gm, Fat-47 gm. |
Oil To Cook- 5 to 6 Tsp,K-cal-2151, CHO-325gm, pro-tien-85gm, Fat-53 gm. |
Recommended 2500 Kcal Diabetes diet
|
Vegetarian |
Non-vegetarian |
|
Bed Tea-w/o sugar (Tea/Coffee), sugar free biscuit-3 no. |
Bed Tea-w/o sugar (Tea/ Coffee),sugar free biscuit-2 no |
|
Break Fast-chapati-3 no, vegtable-2 cup/DaliyaUpma with vegetable-3cup, Green Chutney/ Brown Bread-4 no, Vegetable-2 cup/Small Idlli-6no, Samber-2 cup. (One low glycemic fruit for all) |
Break Fast-chapati-3 no,vegtable-2 cup/DaliyaUpma with vegetable-3cup, Green Chutney/Brown Bread-4 no, Egg white 2 no /Small Idlli-4no,Samber-2 cup/ (One low glycemic fruit for all) |
|
Lunch-Salad-2cup, curd-2tbsp, Rice-3 up, chapati-1 no, Dal-cup, Vegetable-2 cup, Paneer-0.5 cup. |
Lunch-Salad-2cup, curd-1tbsp, Rice-3cup, chapati-1 no, Vegetable-2 cup, Roasted Fish- 0.5 cup. |
|
Snacks-Tea –w/o Sugar, Sugar free biscuit-2, Low glycemic fruit- 1no |
Snacks-Tea –w/o Sugar, Sugar free biscuit-2, Low glycemic fruit- 1no |
|
Dinner-Vegetable soup-2 cup, Chapati-3, Vegetable-2 Cup |
Dinner-Vegetable soup-2 cup, Chapati-3, Vegetable-2 Cup |
|
Oil To Cook- 4 to 5 Tsp, Kcal-2514, CHO-375gm, protien-81gm, Fat-49 gm. |
Oil To Cook- 5 to 6 Tsp, Kcal-2581, CHO-395gm, protien-98 gm, Fat-56 gm. |
Dos and Don’ts: (Diet Advice)
• Add an extra serving of fruit and vegetable in your daily routine.
• Restrict intake of starchy fruits and vegetables (e.g. potato, sweet potato, suran, arbi, raw banana, banana, mango, chiku, sitaphal).
• Restrict the intake of oil to ½ litre/ person/ month.
• Avoid red meat, egg yolks, dry fish.
• Have atleast 2-3 liters of water every day.
• Avoid junk food and readymade juices.
• Restrict the intake of sugar and sweets.
• Have Vit C rich foods (e.g. amla, guava, sweetlime, pomegranate, lime etc.)
• Add omega 3 rich foods in your diet (e.g. flaxseeds, walnuts, oily fish, soybean, tofu etc.)
• Always have a bedtime snack (e.g. milk, fruit etc.)
• Keep on changing oils, Opt for low fat dairy products.
• Restrict the intake of salt to 1-1 1/2 tsp per day. Avoid salty foods.
• Incorporate chromium rich foods in the diet (e.g. broccoli, whole grains, lean meat, mushrooms, asparagus, green beans, walnutsetc.)
• Have foods rich in vanadium (sources-shellfish, parsley, buckwheat, soybean, safflower/sunflower/peanut/olive oil, etc.)
• Have foods rich in alpha lipoicacid. (sources-organ meats, broccoli, spinach, yeast, peas, tomatoes, etc.)
• Add an extra serving of vegetable in each your meals and atleast 2 fruits/ day
• Incorporate foods rich in Vitamin B12. (sources-whole grain cereals, legumes and protein rich foods such as lean meat, poultry, fish, milk, eggs) Have foods rich in Vit K (sources-green leafy vegetables, lean meat, poultry, egg, fermented foods, etc.)
• Have foods rich in Quercitin (sources- apple, citrus fruits, onions, parsley, beans, blackberries, blueberries, olive oil, etc.)
• Consume more of green leafy vegetables, papaya, pomegranate pumpkin, citrus fruits etc.
• Limit the intake of saturated fats, such as ghee, butter, cheese, cream and animal fats.
• Have fish at least 2 times a week.
• Have choline containing foods (sources- egg yolks, wheat germ, whole wheat products, organ meats, etc.)
• Increase the foods which increase the release of nor epinephrine (sources-milk, yoghurt, almonds, sesame seeds, pumpkin seeds.
• Avoid high sugar foods, preserved foods, high caffeine foods, papad, pickles, chips, farsan, dry fish, sated nuts, etc.
• Avoid eating refined carbohydrates (maida and its products, cookies, honey, fruit juices, etc.
• Avoid Limit the intake of canned and processed foods.
• Avoid trans fats (e.g., fast foods, processed snacks such as crackers and cookies)
• Have foods rich in L-arginine (sources-salmon, pumpkin seeds, sesame seeds, peanuts, walnuts, oats, wheat germ, etc.)
Here Are 11 Ways to Take an Active Role in Diabetes Care and Enjoy a Healthier Future
1. Make a Commitment to Managing Your Diabetes
Members of your diabetes care team — doctor or primary care provider, diabetes nurse educator, and dietitian, for example — can help you learn the basics of diabetes care and offer support along the way. But it’s up to you to manage your condition. Learn all you can about diabetes. Make healthy eating and physical activity part of your daily routine. Maintain a healthy weight. Monitor your blood sugar level, and follow your doctor’s instructions for managing your blood sugar level. Ask your diabetes treatment team for help when you need it.
2. Don’t Smoke
Smoking increases your risk of various diabetes complications, including:
• Reduced blood flow in the legs and feet, which can lead to infections, ulcers and possible removal of a body part by surgery (amputation)
• Heart disease
• Stroke
• Eye disease, which can lead to blindness
• Nerve damage
• Kidney disease Talk to your doctor about ways to help you stop smoking or using other types of tobacco.
3. Keep Your Blood Pressure and Cholesterol under Control
Like diabetes, high blood pressure can damage your blood vessels. High cholesterol is a concern, too, since the damage is often worse and more rapid when you have diabetes. When these conditions team up, they can lead to a heart attack, stroke or other life-threatening conditions.
Eating a healthy, reduced-fat diet and exercising regularly can go a long way toward controlling high blood pressure and cholesterol. Your doctor may also recommend taking prescription medication.
4. Don’t Forget Your Kidneys
Kidneys are the organs that make sure the fluids in your body are balanced and processed properly. When you have diabetes, your kidneys can become compromised due to poorly controlled blood glucose and high blood pressure, so be certain to have a micro albumin test at least once per year, with a goal of less than 30 micrograms per milligram creatinine.
5. Schedule Regular Physicals and Eye Exams
Schedule two to three diabetes check-ups a year, in addition to your yearly physical and routine eye exams. Your eye care specialist will check for signs of retinal damage, cataracts and glaucoma.
During the physical, your doctor will ask about your nutrition and activity level and look for any diabetes-related complications-including signs of kidney damage, nerve damage and heart disease-as well as screen for other medical problems.
6. Keep Your Vaccines Up To Date
High blood sugar can weaken your immune system, which makes routine vaccines more important than ever. Ask your doctor about:
• Flu vaccine. A yearly flu vaccine can help you stay healthy during flu season as well as prevent serious complications from the flu.
• Pneumonia vaccine. Sometimes the pneumonia vaccine requires only one shot. If you have diabetes complications or you’re age 65 or older, you may need a five-year booster shot.
• Hepatitis B vaccine. The Centers for Disease Control and Prevention recommends the hepatitis B vaccine for adults with diabetes who haven’t previously received the vaccine and are younger than 60. If you’re age 60 or older and have never received the hepatitis B vaccine, talk to your doctor about whether it’s right for you.
• Other vaccines. Stay up to date with your tetanus shot. Your doctor may recommend other vaccines as well.
7. Take Care of Your Teeth
Diabetes may leave you prone to gum infections. Brush your teeth at least twice a day, floss your teeth once a day and schedule dental exams at least twice a year. Call your dentist if your gums bleed or look red or swollen.
8. Pay Attention to Your Feet
High blood sugar can reduce blood flow and damage the nerves in your feet. Left untreated, cuts and blisters can lead to serious infections. Diabetes can lead to pain, tingling or loss of sensation in your feet.
To prevent foot problems:
• Wash your feet daily in lukewarm water. Avoid soaking your feet, as this can lead to dry skin.
• Dry your feet gently, especially between the toes.
• Moisturize your feet and ankles with lotion or petroleum jelly. Do not put oils or creams between your toes — the extra moisture can lead to infection.
• Check your feet daily for calluses, blisters, sores, redness or swelling.
• Consult your doctor if you have a sore or other foot problem that doesn’t start to heal within a few days.
9. Consider a Daily Aspirin
Taking a low dose of aspirin every day may reduce your risk of heart attack and stroke. Ask your doctor whether daily aspirin therapy is appropriate for you, including which strength of aspirin would be best.
10. If You Drink Alcohol, Do So Responsibly
Alcohol can cause high or low blood sugar, depending on how much you drink and whether you eat at the same time. If you choose to drink, do so only in moderation and always with a meal. Remember to include the calories from any alcohol you drink in your daily calorie count.
11. Take Stress Seriously
If you’re stressed, it’s easy to neglect your usual diabetes care routine. The hormones your body may produce in response to prolonged stress may prevent insulin from working properly, which only makes matters worse. To take control, set limits. Prioritize your tasks. Learn relaxation techniques. Get plenty of sleep.
Above all, stay positive. Diabetes care is within your control. If you’re willing to do your part, diabetes won’t stand in the way of an active, healthy life.
Physical Activity
Regular physical activity is an essential component of management in person with type 2 diabetes. A careful assessment of an individual should be made by physician while incorporating an exercise programme should be individualized according to individual capacity and disabilities. The best form of exercise recommended to a diabetic is stepwise increase of aerobic exercise. There are several benefits from regular exercise schedule. These include improvement in insulin sensitivity, reduction of hypertension, reduction in weight, improvement in lipid profile (reduces serum triglyceride, increases HDL particularly HDL2 cholesterol), improvement in cardiovascular function, increases in bone density, improvement in the sense of physical and mental wellbeing and improvement in quality of life. The Practise of Yoga is a traditional Indian system, which is now gaining Indian acceptance for stress coping skills the practice of yoga helps therapeutically and promotes physical and mental health. The person with diabetes should always carry quick acting CHO and a diabetes Identification card.
Conclusion
From this researchthe researcher came to the conclusion that diabetes is a metabolic disorder, which can never be cured but can only under control with the proper maintenance of a balanced and healthy diet. At the same time the macronutrients like CHO, protein and fat intake should be proper as there was a possibility of secondary complication after 7-10yrs of diabetes. Basically patients with high sugar and HTN for a long time need to check their protein intake per day. There is no other disease which calls for a greater thought on diet than diabetes. Thus the diet needs to be modified by a dietician according to the age, sex, and economic status, social and religious background of the patient. Diabetes is disease which required proper care [1-25].
Various Ways to Lower the Diabetic Risk
Diabetes mellitus is a chronic condition that can lead to complications over time. These complications can include:
• Coronary heart disease, which can lead to a heart attack
• Cerebrovascular disease, which can lead to stroke
• Retinopathy (disease of the eye), which can lead to blindness
• Nephropathy (disease of the kidney), which can lead to kidney failure and the need for dialysis
• Neuropathy (disease of the nerves), which can lead to, among other things, ulceration of the foot requiring amputation.
Many of these complications produce no symptoms in the early stages, and most can be prevented or minimized with a combination of regular medical care and blood sugar monitoring.
Cardiovascular Complication
A number of measures are important to reduce the risk of cardiovascular (heart and blood vessel) disease.
• Quit smoking.
• Manage high blood pressure with lifestyle modifications and/ or medication.
• Have a blood test to measure cholesterol and triglyceride levels, and modify the diets if needed.Some people will also need a medication to lower their low-density lipoprotein (LDL) (“bad cholesterol”) or triglycerides.
Controlling of blood sugar in Diabetes - The long-term complications of diabetes is caused by the effect of high blood sugar levels on blood vessels. This study shows that people with lower blood sugar levels had fewer complications than those with higher values. Thus, keeping blood sugars close to normal can help prevent the long¬term complications of diabetes mellitus. However, there are some risks associated with tight control, particularly an increased risk of hypoglycemia (low blood sugar).
Monitoring Blood Sugar Levels
Monitoring blood sugar with finger sticks at home can indicate how well diabetes is controlled and serves as a guide to adjusting therapy For most people, a target for fasting blood sugar and for blood sugar levels before each meal is 80 to120 mg/dL (4.4 to 6.6 mmol/L); however, these targets may need to be individualized.
A blood test called A1C (glycated hemoglobin) is also used to monitor blood sugar control; the result provides an average of blood sugar levels during the previous one to three months. An A1C of 7 per cent or less is recommended; this corresponds to an average blood sugar of 150 mg/dL (8.3mmol/L).
The A1C target may be somewhat higher in people who are older or who have conditions that increase the risks associated with hypoglycaemia. Even small decreases in the A1C lower the risk of diabetes-related complications to some degree. The combination of A1C and fingerstick blood sugars provides information about the average and daily blood sugar levels.
Type 1 -Diabetes: Blood sugar control in type 1 diabetes requires some form of insulin, which can be given with insulin injections or an insulin pump. Most healthcare providers recommend intensive insulin therapy, which requires frequent blood sugar monitoring in addition to frequent injections or use of an insulin pump.
Intensive insulin therapy increases the risk of low blood sugar, is more expensive than traditional insulin therapy, and requires that the person monitor their blood sugar levels, diet, and activities. Some people who use intensive insulin therapy gain weight, although regular exercise and controlling the amount eaten can prevent weight gain.
Type 2 - Diabetes: With type 2 diabetes, it is sometimes possible to control blood sugar levels with lifestyle changes, often in combination with oral medications. Insulin injections may be needed when a person is first diagnosed or later in the course of treatment. Most people with type 2 diabetes who take insulin require only one or two injections per day.
Eye Complication in Diabetes
Regular eye examinations are essential for detecting eye complications (called retinopathy) at an early stage, when the condition can be monitored and treated to preserve vision.
An eye exam should include dilating the pupils (with medicated eye drops) to completely examine the retina. Unless the pupils are medicated, they contract in response to light, making it impossible to view the entire retina. In some people with retinopathy, photographs of the retina will be taken to monitor the changes. This examination should be performed by a doctor who specializes in the eyes (called an ophthalmologist or optometrist).
The risk of diabetic retinopathy varies with the type and duration of diabetes and with other life events. Thus, the screening guidelines differ from one person to another.
Type 1 - Diabetes: People with type 1-diabetes should have an eye examination by an ophthalmologist or optometrist beginning five years after they are diagnosed with diabetes, although screening is usually not necessary before puberty. People who have difficulty with their vision or who require glasses or contacts may need to be seen sooner. The frequency of subsequent examinations will depend upon the results of the initial exam. An eye exam is usually recommended every one to two years after the initial examination.
Type 2- Diabetes: People with type 2-diabetes should have an eye examination by an ophthalmologist or optometrist when they are first diagnosed with diabetes. The reason for this is that blood sugar levels often increase over a period of several years before the person is diagnosed. Eye complications can develop during this time and often have no symptoms. Having an eye examination soon after diagnosis can help to determine if there are eye complications, the extent or severity of the complications, and if treatment is needed.
The frequency of subsequent exams will depend upon the results of the initial examination. An eye exam is usually recommended every one to two years after the initial examination.
Foot care with Diabetes
Diabetes can decrease the blood supply to the feet and damage the nerves that carry sensation. These changes put the feet at risk for developing potentially serious complications such as ulcers. Foot complications are very common among people with diabetes, and may go unnoticed until the condition is severe.
Self-exam:
People with diabetes should examine their feet every day. It is important to examine all parts of the feet, especially the area between the toes. Look for broken skin, ulcers, blisters, areas of increased warmth or redness, or changes in callus formation; a healthcare provider should be notified if any of these changes are found.
This examination can be a part of the daily bathing or dressing routine. It may be necessary to use a mirror to see the bottoms of the feet clearly. Anyone who is unable to reach their feet or see them completely, even with the help of a mirror, should have someone else (such as a spouse or other family member) assist with the examination.
Clinical exam:
During a routine medical visit, the clinician will check the blood flow and sensation in the feet. In people with type 1 diabetes, annual foot examinations should begin five years after diagnosis. In people with type 2 diabetes, annual foot exams should begin at the time of diagnosis.
During a foot examination, the clinician will look for changes such as ulcers, cold feet, thin skin, bluish skin colour, and skin breaks associated with athlete’s foot. The clinician will also test the sensation in the feet to determine if it is normal or diminished. People with decreased sensation are at risk for foot injuries that can go unnoticed due to lack of pain.
Kidney Complication in Diabetes
Diabetes can alter the normal function of the kidneys. A urine test that measures the amount of protein (albumin) in the urine can determine if diabetes is affecting the kidney’s filtering action. Microscopic amounts of albumin in the urine (micro albuminuria) can be an early indicator of diabetes-related kidney complications (called nephropathy). The amount of albumin in the urine can also help the provider determine if nephropathy is worsening. Urine screening tests should begin in people with type 1 diabetes about five years after diagnosis and in people with type 2-diabetes at the time of diagnosis. If the test shows that there is protein in the urine, tight blood sugar and lipid (cholesterol and triglyceride) control are recommended.
A blood pressure medication (an angiotensin-converting enzyme [ACE] inhibitor or angiotensin receptor blocker [ARB]) is generally recommended if albuminuria does not improve, even if the blood pressure is normal. People with elevated blood pressure and albuminuria are also treated with an ACE inhibitor or ARB. These medications decrease the amount of protein in the urine and can prevent or slow the progression of diabetes-related kidney disease.
Hypertension and Relative Complication in Diabetes
Many people with diabetes have hypertension (high blood pressure). Although high blood pressure causes few symptoms, it has two negative effects: it stresses the cardiovascular system and speeds the development of diabetic complications of the kidney and eye. A healthcare provider can diagnose high blood pressure by measuring blood pressure on a regular basis.
A blood pressure reading below 140/90 and perhaps below 130/80 is recommended for most people with diabetes who do not have kidney complications; a lower blood pressure goal (less than 130/80) is recommended for people with diabetes who have kidney disease.
If a person is diagnosed with prehypertension (>120/80), the healthcare provider may recommend weight loss, exercise, decreasing the amount of salt in the diet, quitting smoking, and decreasing alcohol intake. These measures can sometimes reduce blood pressure to normal. If these measures are not effective or the blood pressure must be lowered quickly, the provider will likely recommend one of several high blood pressure medications.
Pregnancy and Diabetes
Control of diabetes and its potential complications is especially important for women who are planning to become pregnant, as well as in those who already are pregnant. Controlling blood sugar levels before and during pregnancy decreases the risk of many complications in both the mother and the baby.
Each day:
• Check your blood glucose -- ask your healthcare provider how often and the best times of dayto check.
• Examine your feet and toenails for any wounds.
• Be physically active each day.
• Take aspirin if your doctor has suggested it.
2-4 Times Each Year:
• Have your A1C checked by your doctor or healthcare provider
At Least Once a Year:
• Visit your doctor to discuss goals for the care of your diabetes.
• Visit your dentist for a regular check-up.
• Get a flu shot to prevent complications from illness.
• Have your doctor check your blood pressure and discuss the results with you.
• Have a dilated eye exam.
Acknowledgments
On the fulfilment of my dissertation, I express my extreme gratitude to my revered teacher and research guide Dr. Gayatri Biswal, PhD Reader in Home Science. Rama Devi Women’s Autonomous College, Bhubaneswar for the inspiration and kind help at every stage of preparation of this dissertation. I shall be very grateful for her valuable and enlightened guidance, suggestions without which my present piece of work could not have been the light of the day.
I am grateful to Dr. Reeta Choudhuri, Head of The Department of Home Science. For extending all facilities in the department and I also extend my deep sense of gratitude to Dr. Minati Mishra, M.phil coordinator and my entire teacher for their help and blessing.
It is privilege to unveil an acknowledgement to the librarian of Home Science Department and Rama Devi Women’s Autonomous College and other staffs for their cooperation.
At last but not the least I am grateful to my beloved parents, elders, husband and my little daughter for their blessings and well wishes, help and cooperation for the completion of this dissertation. I also thankful to respondents for their active co-operation and help in collecting the data.
References
- Abate N, Chandalia M (2001) Ethnicity and type 2 diabetes -focus on Asian Indians. Journal of Diabetes and its Complications 15: 320-327.
- Abate N, Chandalia M (2003)The impact of ethnicity on type 2 diabetes. Journal of Diabetes and Its Complications 17: 39-58.
- Abate N, Chandalia M (2004)The impact of ethnicity on type 2 diabetes. Journal of Diabetes and Its Complications 24: 109-114.
- Ahuja MMS (1991)Recent contributions to the epidemiology of diabetes mellitus in India. International Journal of Diabetes in Developing Countries 11: 05-09.
- Balagopal P, Kamalamma N, Patel TG, Misra R (2008) ACommunity-Based Diabetes Prevention and Management Education Program in a Rural Village in India. Diabetes Care 31: 1097-1104.
- Bjork S, Kapur A, King H, Nair J, Ramachandaran A (2003) Global policy: aspects of diabetes in India. Health Policy 66: 61-72.
- R Boddula, S Yadav, V Bhatia, G Genitta, D Pandey,et al (2008) High prevalence of type 2 diabetes mellitus in affluent urban Indians. Diabetes research and clinical practice 81:e4-e7.
- Deo SS, Zantye A, Mokal R, Mithbawkar S, Rane S, et al. (2006) To identify the risk factors for high prevalence of diabetes and impaired glucose tolerance in Indian rural population. International Journal of Diabetes in Developing Countries 26.
- Gupta A, Gupta R, Sarna M, Rastogi S, Gupta VP, et al. (2003) Prevalence of diabetes, impaired fasting glucose and insulin resistance syndrome in an urban Indian population. Diabetes Research and Clinical Practice 61: 69-76.
- ICMR (2005) Guidelines for Management of Type 2 Diabetes. Indian Council of Medical Research.
- ICMR (2006) Assessment of Burden of NCDs. Indian Council of Medical Research.
- Kokiwar PR, Gupta S, Durge PM (2007) Prevalence of diabetes in a rural area of central India. International Journal of Diabetes in Developing Countries 27: 08-10.
- Menon VU, Kumar KV, Gilchrist A, Sugathan TN, Sundaram KR, et al. (2006) Prevalence of known and undetected diabetes and associated risk factors in central Kerala-ADEPS. Diabetes Research andClinicalPractice 74: 289-294.
- Misra A, Chowbey P, Makkar BM, Vikram NK, Wasir JS, et al. (2009)Concensus Group. Consensus Statement for Diagnosis of Obesity, Abdominal Obesity and the Metabolic Syndrome for Asian Indians and Recommendations for Physical Activity, Medical and Surgical Management. Journal of Association of Physicians of India 57:163-170.
- Mohan V, Mathur P, Deepa R, Deepa M, Shukla DK, et al. (2008) Urban rural differences in prevalence of selfreported diabetes in India-The WHO-ICMR Indian NDC risk factor surveillance. Diabetes Research andClinical Practice 80:159-168.
- Montori VM, Wang YG, Alonso-Coello P, Bhagra S(2006) Systematic Evaluation of the Quality of Randomized Controlled Trials in Diabetes. Diabetes Care 29: 1833-1838.
- Mullican DR, Lorenzo C, Haffner SM (2009) Is Prehypertension a Risk Factor for the Development of Type 2 Diabetes? Diabetes Care 32: 1870-1872.
- Nagaya T, Yoshida H, Takahashi H, Kawai M (2009) Resting heart rate and blood pressure, independent of each other, proportionally raise the risk for type-2 diabetes mellitus. International Journal of Epidemiology39:215-222.
- Ramachandran A, Mary S, Yamuna A, Murugesan N, Snehalatha C (2008) High Prevalence of Diabetes andCardiovascular Risk Factors Associated with urbanization in India. Diabetes Care 31: 893-898.
- Ramachandran A, Snehalatha C, Viswanathan V (2002) Burden of type 2 diabetes and its complications – TheIndianscenario. Current Science 83:1471-1476.
- WHO (2006) Obesity. Geneva: World Health Organization.
- WHO/FAO Expert Consultation. WHO Technical Report Series. No. 916. Geneva: WHO.
- World Health Organization (2003) Diet, Nutrition and the Prevention of Chronic Diseases. Joint WHO. Improving the built environment in India. Preventing chronic diseases: a vital investment. WHO report 2005, Geneva.
- Yadav S, Boddula R, Genitta G, Bhatia V, Bansal B, et al. (2008) Prevalence & risk factors of pre-hypertension & hypertension in an affluent north Indian population. Indian Journal of MedicalResearch 128: 712-720.
- Yeh GY, Eisenberg DM, Kaptchuk TJ, Phillips RS (2003) Systematic Review of Herbs and Dietary Supplements for Glycemic Control in Diabetes. Diabetes Care 26: 1277-1294.