

World Journal of Forest Research(WJFR)
ISSN: 2994-5569 | DOI: 10.33140/WJFR



Research Article - (2026) Volume 5, Issue 2
Critical Hydrological Dynamics and Flooding in U-Shaped Valleys Within Urban Areas: A Case Study of Some Stream Channel Systems in Yaounde and Its Environs, Southern Cameroon Plateau
 , Richard Tanwi Ghogomu 1 , Bernard Njom 1 and Mero Yannah 2
 2Institute of Geological and Mining Research, Cameroon
Received Date: May 20, 2026 / Accepted Date: Jun 25, 2026 / Published Date: Aug 10, 2026
Copyright: ©2026 Roger Bissaya, et al. This is an open-access article distributed under the terms of the Creative Commons Attribution License, which permits unrestricted use, distribution, and reproduction in any medium, provided the original author and source are credited.
Citation: Bissaya, R., Ghogomu, R. T., Njom, B., Yannah, M. (2026). Critical Hydrological Dynamics and Flooding in U-Shaped Valleys Within Urban Areas: A Case Study of Some Stream Channel Systems in Yaounde and Its Environs, Southern Cameroon Plateau. World J Forest Res, 5(2), 01-12.
Abstract
This paper examines the hydrological dynamics and flooding of U-shaped valleys in urban areas, with projection to some stream channel systems in Yaounde and its environs. So, it relies on analysis of unmodified (or natural) stream channel systems, assuming that the quantity of water of an unmodified stream channel system is directly related to the size it usually carries and that it tends to bring back during high discharges or floods. The drainage basins are usually elongated, with the time of concentration depending on the trunk stream length, e.g., 9.35 hours for the Mefou watershed and 5.21 hours for the Mfoundi sub-watershed. The streams continuously adjust the shape of their channels; for instance, in the Mefou River, the floodplain straight channel segments do occur with sinuous line, thus the sediments are deposited to form bars. Such path and deposition of sediments result in meandering. During extremely high discharges, the water flows in a braided pattern around islands and bars. Although generally characterized by dense, dendritic drainage patterns, the stream channel systems sometimes exhibit a remarkable centripetal drainage pattern associated with flood basins. Since the river discharge usually exceeds the capacity of the channels at U-shaped valley junctions, such as the low-lying areas at Nkolbisson, Midtown, Nguem, Etoa, and Mehandan, floodings are recurrent.
Keywords
Geomorphology, Watershed, Discharge, Meandering, Flooding, Cameroon
Introduction
Geomorphic hazards are regarded as related to landscape changes that affect human systems; with processes that produce the changes being rarely geomorphic in nature, but better regarded as atmospheric or hydrologic [1]. However, since understanding of atmospheric or hydrologic hazards includes research into the characteristics of the particular events which impact the natural systems, in this study, we focused on the geomorphic settings (i.e., shapes of valleys) and the way that they affect hydrological dynamics and flooding. A stream is any body of flowing water confined within a channel, regardless of size. It flows downhill through local topographic lows, carrying away water over the earth’s surface [2]. A stream carves its channel in the absence of human intervention, and the channel carved is broadly proportional to the volume of water that must typically be accommodated (Figure 1). However, the stage of the stream may exceed the bank height at the flood stage. Therefore, many stream channel systems exhibit hydrological dynamics which lead to flooding. Understanding the behaviour of stream channel systems (or watersheds) in urban areas is essential for flood protection, urban planning, design of civil engineering structures, and water management. The analysis of the stream channel systems is most often carried out by studying its hydrological response to precipitations. This response is measured by analysing hydrographs or discharges. Ideally, hydrological parameters are calculated based on flow series measured over a long period. If this is not possible, hydrological models are used to fill in the gaps (see e.g. [3]). Some stream channel systems have irregular profiles due to the topography; this is the case for most of the river profiles in Yaounde and its surrounding. Indeed, the Yaounde region's topography is characterized by hills and plateaus with convex slopes and numerous V-shaped or U-shaped (or flat-bottomed) valleys. Thus, the stream hydrological systems present a V-shaped valley with a moderate longitudinal slope in their upper reaches, and a U-shaped valley with a gentle longitudinal slope in their lower reaches (Figures 1 and 2). It is therefore normal that the hydrological dynamics differ upstream and downstream of the watercourse. The upstream section is fairly well drained, while the downstream section is poorly drained. The U-shaped valleys could therefore be the cause of poor drainage. So, this study relies on unmodified (or natural) stream channel systems, assuming that the quantity of water of an unmodified stream channel system is directly related to the size it usually carries and that it tends to bring back during high discharges or floods (channelization which is intended to increase velocity of water flow in urban areas is an obstruction to the stream natural dynamic). Indeed, in Yaounde and its surroundings, there are two main aggravating factors to the flooding, namely the low-lying areas and the centripetal junction pattern. Furthermore, we assume that with the construction of backfill bridges (i.e. structures built over the U-shaped valley using backfill and flume) to transportation and settlement occupation which is intended to extend development in floodplain, the already poorly drained downstream stream sections now behave like water reservoirs which are vulnerable to the rise in discharge during heavy rainfall.

Figure 1: (a) Streams and Their Drainage Basins in Yaounde and Its Environs (within a 3D relief model). (b, c) Longitudinal Profiles of the Mefou and Mfoundi Rivers

Figure 2: Landforms Overview. (a) Topographic Map of Yaounde and its Environs, with Profile Lines Indicated. (b, c) Topographic Profiles; (d) Cross-Section
Physical Environment (Climate, Water Flows, and Landforms)
Climate and Water Flows
Climate
Classic climate patterns (see Table 1) do not reveal unusual weather conditions. Therefore, using recent meteorological data from satellite sensors covering 2020 - 2024, we present the current climate trend for Yaounde and nearby areas to highlight emerging climatic parameters. The data (see Table 2) indicate below-normal interannual rainfall, while average monthly temperatures are roughly consistent with the norm. Monthly rainfall patterns show more wet months at the expense of drier ones, with increased relative humidity [4]. This disruption of the ecological seasons affects the climate. Indeed, the climate remains divided into four seasons: a long dry spell from mid-November to February, a short rainy season from March to June, a short dry season from July to mid-August, and a long rainy season from mid-August to mid-November. Yet rainfall significantly alters these seasonal patterns. The month of peak rainfall shifts from October to September, while January remains the driest month. Rainfall in July and August is increasing, while that in November is decreasing. The periods of maximum and minimum temperatures, in January-February and July-August, remain steady. Nonetheless, recent weather trends should not be considered definitive, as climate remains a fragile resource sensitive to various interventions, and regions frequently face unusual weather conditions.
|
Parameter |
Jan. |
Feb. |
Mar. |
Apr. |
May |
Jun. |
Jul. |
Aug. |
Sept. |
Oct. |
Nov. |
Dec. |
Tot./Moy. |
|
P (mm) |
21.27 |
47.59 |
138.98 |
178.77 |
207.77 |
158.40 |
71.52 |
89.66 |
226.99 |
282.15 |
114.74 |
24.49 |
1562.33 |
|
T (°C) |
24.50 |
25.47 |
25.06 |
24.56 |
24.29 |
23.49 |
22.78 |
22.82 |
23.34 |
23.42 |
23.87 |
23.91 |
23.96 |
|
Hr (%) |
72.5 |
71 |
75.5 |
78.5 |
80 |
80.5 |
82.5 |
82.5 |
81 |
81.5 |
78 |
77.5 |
78.4 |
|
Ia |
7.4 |
16.1 |
47.52 |
62.01 |
72.70 |
56.74 |
26.16 |
32.56 |
81.8 |
101.39 |
40.6 |
8.67 |
|
|
|
d |
d |
sd |
w |
w |
sd |
sd |
sd |
w |
w |
sd |
d |
|
P: precipitations; T: temperatures; Hr: relative humidity; Ia: aridity index; d: dry month; w: wet month; sd: sub-dry month
Table 1: Synthesis of Climate Data for Yaounde and its Surroundings Collected at the Mvan-Yaounde Meteorological Station from 1929 to 2009
|
Parameter |
Jan. |
Feb. |
Mar. |
Apr. |
May |
Jun. |
Jul. |
Aug. |
Sept. |
Oct. |
Nov. |
Dec. |
Tot./Moy. |
|
P (mm) |
2.76 |
8.78 |
131.84 |
140.85 |
176.61 |
142.42 |
129.28 |
143.96 |
255.46 |
238.61 |
91.34 |
19.43 |
1481.16 |
|
T (°C) |
24.43 |
25.72 |
24.96 |
24.37 |
24.57 |
23.45 |
22.89 |
22.86 |
22.79 |
23.24 |
23.87 |
24.56 |
23.94 |
|
Hr (%) |
71.95 |
71.65 |
82.60 |
87.24 |
88.59 |
88.33 |
88.00 |
88.12 |
89.59 |
89.35 |
85.18 |
75.98 |
83.90 |
|
Ia |
0.96 |
2.95 |
45.26 |
49.17 |
61.30 |
51.09 |
47.17 |
52.58 |
93.49 |
86.14 |
32.36 |
6.75 |
|
|
|
d |
d |
sd |
sd |
w |
w |
sd |
w |
w |
w |
sd |
d |
|
P: precipitations; T: temperatures; Hr: relative humidity; Ia: aridity index; d: dry month; w: wet month; sd: sub-dry month
Table 2: Synthesis of Climate Data for Yaounde and its Surroundings, Collected from NASA's Global Weather Website for the Period from 2020 to 2024. Calibration was Performed using Data from the Following Eight Sensors: A (N3.5°; E11.25°), B (N3.5°; E11.875°), C (N4.0°; E11.25°), D (N4.0°; E11.875°), E (N4.0°; E11.5°), F (N3.92°; 11.42°), G (N3.75°; E11.5°), and H (N3.84°; 11.42°)
Temporal Dynamics of Extreme Rainfall Occurrences and Water Flows
A comprehensive assessment of extreme rainfall events in Yaounde and its environs involves a statistical processing and measured data, as illustrated in Table 3. This examination spans various temporal scales, including annual and multiannual intervals, with rainfall quantities exceeding 50 mm per day considered extreme events [5,6]. The statistical distribution of daily rainfall was studied using the truncated Pearson III law and a Goodrich law (see [3]). Obviously, these data are not exempt from the limitations inherent in overestimations and/or underestimations, but remain reliable. At least, the extreme rainfalls may occur two to five times per year, and may be quite abundant anyway (i.e. up to 111.0 mm or 145.5 mm). However, surface run off and interflow, which are the second factors of the rise up of the stage levels in the streams (behind rainfalls) are very large during the rainy season (i.e. from September to November). The classical climate tendency indicates that the average rainfall of that period is 114.75 mm to 282.15 mm (see Table 1). Also, in that period, when soil is saturated, surface and subsurface flows usually get into the stream before they infiltrate and reach the groundwater flow. Moreover, in the city, artificial flows such as flow through drains get into the stream without infiltration.
|
Statistical data |
Measured data |
||||||||||
|
Daily rainfall return periods (mm) |
Maximum observed (mm) |
N.y.o.u.* |
|||||||||
|
Per year |
1 time every: |
||||||||||
|
10 times |
5 times |
2 times |
1 time |
2 years |
5 years |
10 years |
20 years |
50 years |
100 years |
||
|
33.5 |
43.8 |
57.8 |
68.5 |
79.3 |
93.8 |
104.7 |
115.8 |
130.4 |
141.5 |
111.0 |
34 |
*: Number of years of observation used
Table 3: Temporal Dynamics of Extreme Rainfall Occurrences in Yaounde and its Environs (after [3])
General Landforms in the Southern Cameroon Plateau
The southern Cameroonian plateau is a vast, relatively dissected planation surface comprising three main units. The Yaounde plateau lies at 600 to 1000 m (see Figure 3), overlooking two lower plateaus to the north and south: the area from Obala to the Linte escarpment and the Ebolowa-Ambam surface [7-9]. (1) The northern terrain, stretching from Obala to the Linté escarpment, is traversed by the Sanaga River. Elevation ranges from 600 m near the Yaounde Plateau to 900 m near the Adamawa Plateau [9]. This area includes the Yoko (1060 m), Linte, and Badjère (1468 m) massifs. (2) To the south, the Ebolowa-Ambam region, averaging 600 m, features hills and numerous depressions along watercourses. Approaching the Ntem River in the far south, the elevation decreases to about 500 m. (3) The central plateau is deeply carved by a dendritic hydrographic network into elongated hills, forming a succession of convex hills [7,10]. This terrain is dominated by the Mbam-Minkom (1295 m), Nkolondom (1221 m), and Eloumden (1209 m) massifs. The transition from the southern Cameroonian plateau to the coastal plain to the west or to the Congo Basin to the southeast is marked by intermediate relief with elevations between 300 m and 600 m [8,11,12].

Figure 3: Map of Altitude Classes. Note that, within 1027 km2 Total Surface, High-Relief Unit Covers Approximately 15% (157 km2), the Central Plateau Unit Covers Approximately 50% (510 km2), and Low-Relief Unit Covers Approximately 35% (360 km2)
Formation of Landforms
The formation of landforms involves internal processes (endogenic dynamics), driven by tectonic activity; or external factors (exogenic dynamics), as well as climate-related exogenic processes (weathering and erosion) [13]. In Yaounde and nearby areas, this subject remains debated, as aspects of tectonic activity, weathering, and erosion are not yet fully understood. (1) Regarding endogenic dynamics, the morphometric features discussed earlier, along with preliminary work on the tectono-morphological aspect in Yaounde and its surroundings have revealed links among morphological units, arranged along orographic and hydrographic lineaments (N-S and E-W) and along intermediate orientations (NW-SE and SW-NE). This compartmentalization created a series of blocks that influenced the underlying rock in Yaounde and its environs (see Figure 2c) (e.g., [14-16]). Consequently, the basement is segmented by key fractures (see Figure 2d) [17]. (2) For exogenic dynamics, the Yaounde region, which is an area of dense forest, is characterized by high humidity and abundant rainfall. The rocks are highly decomposed, resulting in lateritic soil several meters thick [18-21]. The exogenic dynamic sometimes occurs within differential erosion which erodes the lateritic soil, forming steep-sided ravines dominated only by intact smooth rocky domes or remnants of hard rock, also called inselbergs [19-22]. The thalwegs correspond to areas where solutions are drawn off and soluble constituents are eliminated.
Based on the above analysis, we may conclude that the landforms in Yaounde and its environs have been shaped successively by two closely related and perfectly compatible dynamic processes. Initially, tectonic activity developed the relief in blocks. Later, weathering and erosion produced the smooth, rocky domes and convex-ridge relief. Overall, tectonic, weathering, and erosion are the driver control of landforms.
Materials and Methods
Data
This study used Landsat images in combination with the digitized shaded-relief map from the SRTM (Shuttle Radar Topographic Mission) dataset (Path: N03E011.hgt) and the NA-32-XXIV Yaounde 3d and 4c topographic map sheets of CGN [23]. However, the satellite images rely on unmodified (or natural) stream channel systems, assuming that the quantity of water and shape of an unmodified stream channel system is directly related to the size it usually carries (or that it tends to bring back during very high discharges and floods).
Analysis of the Drainage Basin Pattern and Morphometry
• Drainage pattern
A drainage pattern describes how water channels are arranged in a given geographical area. These patterns are distinctive because they are determined by a combination of regional steepness, variable rock resistance, variable climate, variable hydrology, land relief, and structural controls imposed by the underlying rock [2,24]. Howard and other analysts proposed classifying drainage patterns into several basic types. However, to identify and classify drainage patterns within watersheds in Yaounde and its environs, sectors with homogeneous characteristics were isolated [25].
• Perimeter and surface area of drainage basin
The perimeter and surface area influence flow rates, that is, the duration and volume of flow. In this study, the required digital mapping solution was derived from the digitized shaded-relief map of the SRTM database, Path: N03E011.hgt file.
• Shape of drainage basin
The shape of the drainage basin influences the hydrograph at the outlet. An elongated shape favors lower peak flood flows, whereas a fan shape favors higher flood flows. The morphological parameters were measured using the Gravelius compactness index, KG, defined as the ratio of the watershed's perimeter to that of a circle with the same area (Eq. 1) [26]:

Where: KG: Gravelius compactness index, A: watershed area (km²), P: watershed perimeter (km). The classification is as follows: if KG is close to 1, the watershed is nearly circular; if KG is greater than 1, the watershed is elongated.
• Hypsometric curve, median, and average altitude of the drainage basin
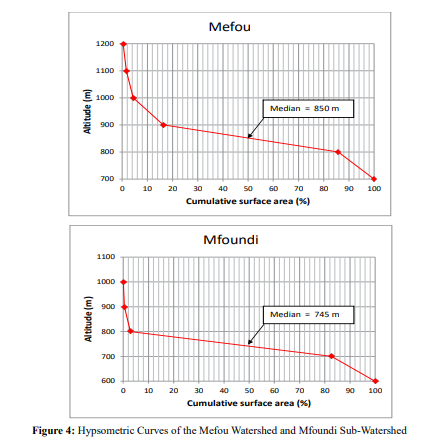
The hypsometric curve shows the percentage of area above a given altitude. It thus provides a synthetic view of the slope of the watershed or sub-watershed and, by extension, of their relief. To plot the hypsometric curve, we used numerical data from the Digital Elevation Model (DEM) to represent the topography of the Mefou watershed and the Mfoundi sub-watershed (see Tables 4 and 5). The median is directly derived from the hypsometric curve; it corresponds to the altitude at which the abscissa equals 50% of the total watershed surface area. The average altitude is defined as follows (Eq. 2):

With: Hmax : average altitude of the sub-watershed; A : area between two contour lines (km ); hi: average altitude between two contour lines (m); A: total area of the watershed or sub-watershed (km2).
• Concentration time of the drainage basin
The concentration time is the time required for runoff to travel from the hydraulically furthest point in the watershed to its outlet. This was determined using Kirpich's method, given in the following formula (Eq. 3) [27]:

With: tc: time of concentration (h), L: maximum length of the water path in the watershed or sub-watershed (m), S: average flow slope (m/m).
Analysis of the Stream Channel Patterns in a U-Shaped Valley
The stream channel is the conduit for water being carried by the stream; thus, the stream can continuously adjust its channel shape and path as the amount of water passing through the channel changes. In U-shaped valleys, the channel may appear straight, but even in these segments, water typically flows in a sinuous pattern with the deepest point shifting from near one bank to the other [3,24]. Velocity is highest in the zone overlying the deepest part of the stream. The channel can also meander due to changes in the stream's flow velocity. On the other hand, the U-shaped valley channel can be braided when the stream segment has highly variable discharge. In this study, analyses of U-shaped valley channel patterns and hydrological dynamics were based on high-resolution color satellite images, specifically 2013 aerial photographs from Google Earth, which depict unaltered stream channel systems. Photogrammetric criteria, such as color, shape, size, and texture, guided photo interpretation. Thus, vegetation appears green with a granular texture, water is yellow-brown (sometimes dark), and soil is brown with a smooth texture. Settlement appears in light colors and angular shapes. The spatial relationships among vegetation, water, soils, and settlement are defined by their locations and associations.
Results and Interpretations
Drainage Basin Pattern and Morphometry
(1) The hydrographical setting shows a predominantly dense dendritic drainage pattern, shaped by the crystalline basement, which resists erosion. However, the northwest sector, where relief is relatively high, exhibits a radial drainage pattern, indicating the influence of high relief on drainage. Meanwhile, the lowland areas exhibit a centripetal drainage pattern associated with flooding basins. Moreover, underlying deformational features, such as crosscutting faults (or relief blocks), may have influenced the rectangular (or parallel) drainage pattern observed in the east sector. The study area also exhibits a hydrographic network subdivided into two main drainage basins with almost opposite flow patterns. They are: a) the north-south flowing streams that belong to the Nyong River watershed (southern part of the map); and b) the south-north flowing streams that belong to the Sanaga River watershed (northern part of the map) (Figures 1a and 2a).km, with a surface area of 406.53 km². The length of the trunk stream (the Mefou River) was estimated at approximately 38.83 km. The perimeter of the Mfoundi sub-watershed was estimated at 40.07 km, and its surface area at 96.75 km². The length of the trunk stream (the Mfoundi River) was estimated at 20.07 km. (3) Meanwhile, the Gravelius compact index of the Mefou watershed is slightly higher (1.4) than that of the Mfoundi sub-watershed (1.2), suggesting that both drainage basins are slightly elongated. (4) The hypsometric curves for the Mefou watersheds show both high- and plateau-relief zones, unlike the Mfoundi, which isgenerally a plateau (Tables 4 and 5, or Figure 4). These curves yield medians of 850 m and 745 m for the Mefou and Mfoundi watersheds, respectively. Similarly, the average altitude of the Mefou watershed is 758.46 m, slightly higher than that of the Mfoundi sub-watershed at 735.95 m. A significant difference of 91.54 m between the average altitude and the median in the Mefou watershed indicates the predominance of irregular slope gradients within this drainage basin. (5) Using the time of concentration equation (Eq. 3) for both drainage basins, a time of concentration of 9.35 hours was obtained for the Mefou watershed and 5.21 hours for the Mfoundi sub-watershed.
|
Altitude (m) |
Ai (km2) |
Percentage (%) |
Cumulative percentage (%) |
hi (m) |
hmin (m) |
|
1200 – 1100 |
1.51 |
0.373 |
0.373 |
1150 |
1100 |
|
1100 – 1000 |
5.26 |
1.294 |
1.667 |
1050 |
1000 |
|
1000 – 900 |
11.12 |
2.735 |
4.402 |
950 |
900 |
|
900 – 800 |
48.23 |
11.863 |
16.265 |
850 |
800 |
|
800 – 700 |
282.38 |
69.461 |
85.726 |
750 |
700 |
|
700 – 600 |
58.03 |
14.274 |
100 |
650 |
600 |
|
Total |
406.53 |
100.00 |
|
|
|
Table 4: Digital Topographic Data from the Mefou Watershed. Note: Hmoy uses Ai and hi, Whereas the Hypsometric Curve uses Ai and hmin. Hmoy Lies between 800 m and 700 m
|
Altitude (m) |
Ai (km2) |
Percentage (%) |
Cumulative percentage (%) |
hi (m) |
hmin (m) |
|
1100 - 1000 |
0.04 |
0.041 |
0.041 |
1050 |
1000 |
|
1000 - 900 |
0.38 |
0.393 |
0.434 |
950 |
900 |
|
900 - 800 |
2.32 |
2.398 |
2.832 |
850 |
800 |
|
800 - 700 |
77.22 |
79.814 |
82.646 |
750 |
700 |
|
700 - 600 |
16.79 |
17.354 |
100 |
650 |
600 |
|
Total |
96.75 |
100.00 |
|
|
|
Table 5: Digital topographic data for the Mfoundi sub-watershed. Note: Hmoy uses Ai and hi, while the hypsometric curve uses Ai and hmin . Hmoy lies between 800 m and 700 m
Geometry and Dynamics of Stream Channels
The majority of streams in Yaounde and nearby areas continuously adjust their channel shape and path as water volume changes. In the Mefou River, for example, straight channel segments occur alongside a sinuous water flow line (Figure 5a). Velocity is highest in the zone overlying the deepest parts of the streams. Therefore, in these areas, sediments are readily transported within pools. The banks closest to the areas of highest velocity are usually eroded, forming cut banks. On the other hand, where the velocity of the stream is low, sediments are deposited to form bars. Moreover, in the Mefou River, the straight channel segments eventually evolve into meandering channel segments, where erosion takes place on the outer parts of the meander bends (where the velocity of the stream is highest), while sediment deposition occurs along the inner meander bends (where the velocity of the stream is low). Such deposition of sediments results in exposed point bars (Figure 5b). Because meandering continuously erodes on the outer meander bends and deposits sediment along the inner meander bends, the stream channel tends to migrate back and forth across its flood plain. However, in the Mefou River, for example, meandering channel segments usually evolve into braided channels during periods of high discharge (Figure 5c). The sediment zones that were exposed during periods of low discharge become flooded, so that the water flows in a braided pattern around the islands and bars, dividing and reuniting as it flows downstream. Moreover, during periods of very high discharge, the entire stream channel may be filled with water, with the islands becoming submerged bars. During such high discharge, some islands could erode, but sediment could be redeposited as the discharge decreases, forming new islands or submerged bars. Islands may become less susceptible to erosion once vegetation establishes.

Figure 5: Overview of the Main Channel Patterns in the Mefou River; (a) Straight Channel Segment, (b) Meandering Channel Segment, and (c) Braided Channel Segment (Imagerie ©2013 Digital Globe). Water Flows along a Line Connecting the Deepest Points in the Stream or Over the Broad Floodplain During FloodsStream or Over the Broad Floodplain During Floods
Stream Junctions (or Low-Lying Areas) in Yaounde and its Environs
The confluence angle of the stream system in Yaounde and its environs was determined using the structural features of the area. These features reflect the underlying basement, composed of metamorphic rocks and numerous structural lineaments. Consequently, flow is either parallel or crosswise, resulting in dendritic and rectangular drainage patterns. As a result, the nature and characteristics of the valleys, along with the flow directions of consequent streams, produce several junction patterns. However, two main junction patterns were observed, namely, the centripetal pattern and the acute or perpendicular pattern. (1) The centripetal junction pattern develops in low-lying or cone-of-depression areas where numerous streams converge or flow toward a central low area, forming a water-accumulating zone or basin, or Carter Lake. In fact, a series of streams that originated from the surrounding elevated land surface come together at a specific low central area (see Figure 6a). (2) The acute or perpendicular junction pattern is formed when the master streams flow through a broad valley, and their tributaries from the steep sides of parallel or perpendicular ridges meet the longitudinal main stream at an acute angle or almost a right angle (see Figure 6b).
Generally, at junctions, water converges; thus, these streams widen their channels by overflowing their banks and submerging the adjoining low-lying area or basin. Therefore, the rivers discharge usually exceeds the channels volume in U-shaped valley junction in Yaounde area, causing the rivers to overflow onto the area surrounding the channels namely, Nkolbisson, Midtown, Nguem, Etoa, Mehandan, etc. (see Figure 7).

Figure 6: Junction Pools in U-Shaped Valleys. Junctions that Involve (a) the Mfoundi River and Odza River, and (b) the Mefou River and its Tributary (Imagerie ©2013 Digital Globe)
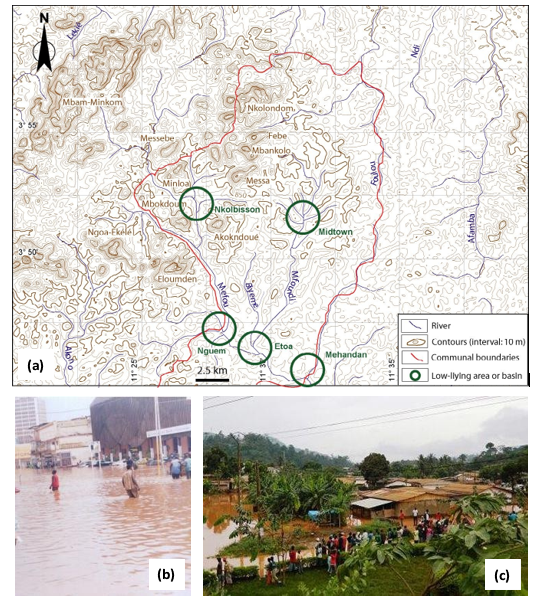
Figure 7: (a) Overview of the Main Low-Lying Areas or Basins in Yaounde and the Stream Junctions Therein. (b) Flooding of the Junction Pool of the Mfoundi River and Its Tributaries at Avenue Kennedy (Midtown Basin) (the Image is Derived From [29]). (c) Flooding of the Junction Pool of the Mefou River and its Tributaries at Nkolbisson (Nkolbisson Basin) (the Image is Derived from [30])
Conclusions
This paper investigates hydrological dynamics and flooding in U-shaped valleys within urban areas, focusing on stream channel systems in Yaounde and its environs. The results show that the drainage pattern in the area is generally dense and dendritic. However, a remarkable centripetal drainage pattern is associated with the flooding basins. Drainage basins are usually elongated. Their time of concentration depends on the length of the trunk stream, yielding 9.35 hours for the Mefou watershed and 5.21 hours for the Mfoundi sub-watershed. The streams continuously adjust the shape of their channels. In the Mefou River, for example, straight channel segments with sinuous outlines lead to sediment deposition and bar formation. Such a path and sediment deposition are responsible for meandering along the water course. During very high discharges, the water flows in a braided pattern around the islands and bars. Overall, river discharge in this area often exceeds the capacity of the channels in U-shaped valley junctions, such as low-lying areas at Nkolbisson, Midtown, Nguem, Etoa, Mehandan, etc., leading to recurrent flooding.
Appendix: Strategy for Limiting Flooding Damages in Yaounde and Other U-Shaped Valleys from Urban Areas
Indeed, the cities are undergoing urbanisation; so that some stream channel systems are modified with the occupation and canalisation. However, the quantity of waters of the stream channel systems are directly related to the size they usually carry and that they tend to bring back during high discharges or floods. The worst flooding recorded that occurred in stream junctions in Yaounde and its environs usually force people from their homes, and sometimes lead to casualties. Throughout the 1980s, 1990s, and 2000s, more than fifty more or less dramatic and spectacular floods were recorded in the midtown and surrounding neighborhoods; Figures. 7b, c and Table 6 present some of the most important ones. What people often fail to realise is that floodplain development can increase the likelihood or severity of flooding. In fact, buildings occupy volume that water formerly could fill, and a given discharge then corresponds to a higher stage (water level); as consequence, floods that occur are more serious. Overall, the most straightforward strategy to limit damage in Yaounde and other U-shaped valleys from urban areas is by limiting their urbanisation
|
On May 15, 1983, a major flood in downtown Yaounde caused damage estimated at 5 million CFA francs (Cameroon Tribune No. 2668). |
|
On August 26, 1986, torrential rain (87 mm) swept away the bridge built at the Municipal Roads by the Transcamerounais Office (Cameroon Tribune No. 3656). |
|
On September 27, 1990, floods and landslides caused enormous damage and killed 8 people, after a rainfall of 46.8 mm (Cameroon Tribune No. 4730). |
|
On September 12, 1997 and February 8, 2000, the city of Yaounde was cut in two and traffic blocked by the Mfoundi which flooded the Central Post Office and Mfoundi Street with more than a meter of water (Cameroon Tribune No. 6432). |
|
|
|
On May 29, 2007, the city of Yaoundé was cut off and traffic blocked by flooding of the Mfoundi River, which inundated the Central Post Office, Kennedy Avenue, and other thoroughfares. The estimated damage included: business activities halted, shops closed, merchandise damaged, offices |
|
|
Table 6: Examples of Dramatic Floods Observed in Yaounde and its Environs
References
- Gares, P. A., Sherman, D. J., & Nordstrom, K. F. (1994). Geomorphology and natural hazards. In Geomorphology and natural hazards (pp. 1-18). Elsevier.
- Montgomery, C. W. (2003). Environmental geology – 6th edition, Northern Illinois University, Mc Graw Hill, 125-148.
- Olivry, J. C. (1986). Fleuves et rivières du Cameroun.Monographies hydrologiques ORSTOM, (9).
- NASA. (2025). (National Aeronautics and Space Administration), Power access data viewer.
- Boardman, J. (2015). Extreme rainfall and its impact on cultivated landscapes with particular reference to Britain. Earth Surface Processes and Landforms, 40(15), 2121-2130.
- Nikumbh, A. C., Chakraborty, A., & Bhat, G. S. (2019). Recent spatial aggregation tendency of rainfall extremes over India. Scientific reports, 9(1), 10321.
- Morin, S. (1981). L'évolution actuelle des milieux naturels au Cameroun. Travaux de l'Institut de Géographie de Reims, 45(1), 117-139.
- Kuete, M. (1987). Les horizons à produits grossiers des profils pédologiques du Sud-Cameroun forestier. In Séminaire régional sur les latérites: sols, matériaux, minerais (pp. 121-140).
- Kuete, M. (1990). Les paléoformes quaternaires du Sud-Cameroun forestier. Lanfranchi et Schwartz éds.: Les paysages quaternaires de l'Afrique centrale atlantique. Didactiques ORSTOM, Paris, 161-166.
- Kadomura, H. (1977). Some aspects of geomorphology in the forest and savanna areas of Cameroon with special reference to south-north variations. Geomorphological studies in the forest and savanna areas of Cameroon. An interim report of the Tropical African Geomorphology Research Project 1975,76, 7-36.
- Morin, S. (1979). Géomorphologie. Les Atlas Jeune Afrique, 13-15.
- Melingui,A., Gwanfogbe, M., Nguoghia, J. (1989). Géographie du Cameroun. Nouvelle edition. CEPER, EDICEF, p 119.
- Cotet, P.V. (1965). La géomorphologie et ses subdivisions – Quelques considerations generales. Cahiers de Géographie du Québec, 10(9), 101-107.
- Bissaya, R., Ghogomu, R. T., Akissebini, S. M., Njom, B., Gomssi, E. L., & Kanouo, N. S. (2018). Geomorphological approach in active tectonics for the cartography of landslide and rock fall hazards in the North-West part of the region of Yaounde-Cameroon. The International Journal of Engineering and Science, 7, 73-96.
- Bissaya, R., Madi, B., Ngamy, A. K., Onana, J. B., Njom, B., Ghogomu, R. T., & Medjo, R. E. (2023). Deformation styles of Neoproterozoic and Post-in Yaounde, southern Cameroon: the polyphase deformation, the strike-slip fault systems, and their geodynamic implications. Arabian Journal of Geosciences, 16(8), 457.
- Onana, J. B., Njom, B., Owono, F. M., Yannah, M., Ango,T. A. O., & Ondoa, J. M. (2023). Relative active tectonic in the metamorphic rocks of the Yaounde group: insights from geomorphic indices and topographic analysis. Journal of Mountain Science, 20(10), 2946-2974.
- Vicat, J. P., Mvondo, H., Willems, L., & Pouclet, A. (2002). Phénomènes karstiques fossiles et actuels au sein des formations métamorphiques silico-alumineuses de la nappe pan-africaine de Yaoundé (Sud-Cameroun). Comptes Rendus. Géoscience, 334(8), 545-550.
- Vallerie, M. (1973). Contribution a l’etude des sols du centre sud cameroun types de differenciation morphologique et pedogenetique sous climat subequatorial. ORSTOM [Ofice de la recherche scientifique et technique outre-mer].
- Derruau, M. (2010). Les formes du relief terrestre: notions de géomorphologie. Armand Colin.
- Eno Belinga, S. M., & Beyala, K. (1982). Géologie dynamique des paysages de fer de la ville de Yaoundé, secteur Nord. Annales Faculté des Sciences, 51-56.
- Yongue-Fouateu, R. (1986). Contribution à l’étude pétrologique de l’altération et des faciès de cuirassement ferrugineux des gneiss migmatitiques de la région de Yaoundé. Th. Doc. 3e cycle, Univ. de Yaoundé, 214p.
- Segalen, P. (1967). Les sols et la géomorphologie du Cameroun. Office de la Recherche Scientifique et Technique Outre-Mer.
- CGN. (1984). (Centre Géographique National),. Carte du Cameroun au 1/50 000. Imprimée par SOPECAM.
- Christopherson, R.W. (2012). Geosystems – 8th edition, Prentice Hall, 398-410.
- Howard, A. D. (1967). Drainage analysis in geologic interpretation: a summation. AAPG bulletin, 51(11), 2246-2259.
- Gravelius, H. (1914). Morphometry of drainage basins. Elsevier, Amsterdam
- Kirpich, Z. P. (1940). Time of concentration of small agricultural watersheds. Civil engineering, 10(6), 362.
- Zogning Moffo, M. O. (2005). Risques d’inondations à Yaoundé: le cas de la zone confluence du Mfoundi au centre-ville et des quartiers péricentraux, bassin versant de l’Ekozoa.
- PANGIRE. (2009) (Plan d’Action National de Gestion Intégrée des Ressources en Eau),. Etat des lieux du secteur eau et environnement, rapport provisoire, MINEE, 235 p.
- Cameroun-info. (2012). Inondations à Yaoundé.