

Research Article - (2026) Volume 11, Issue 1
Assessment of Adult Outpatient Waiting Time for Consultation and its Associated Factors at Debre Tabor Comprehensive Specialized Hospital, Northwest Ethiopia, 2025
Received Date: Jul 21, 2025 / Accepted Date: Nov 27, 2025 / Published Date: Jan 20, 2026
Copyright: ©2026 Arega Asnakew, et al. This is an open-access article distributed under the terms of the Creative Commons Attribution License, which permits unrestricted use, distribution, and reproduction in any medium, provided the original author and source are credited.
Citation: Setie, A., Mekete, G., Asnakew, A., Abeje, G. (2026). Assessment of Adult Outpatient Waiting Time for Consultation and its Associated Factors at Debre Tabor Comprehensive Specialized Hospital, Northwest Ethiopia, 2025. J Nur Healthcare, 11(1), 01-12.
Abstract
Introduction: Outpatient departments are crucial for hospital access but face complaints due to long wait times. High patient-to-doctor ratios, lengthy card searches, and slow registrations. To address these issues, strategies like referral prioritization and cancellation policies are employed.
Objective: To assess adult outpatient waiting time for consultation and its associated factors at Debre Tabor Comprehensive Specialized Hospital, Northwest, Ethiopia, 2024.
Method: Facility based cross sectional study design was conducted among1058 clients visited OPD, from April 01/2024 to May 1/ 2024 in Debre Tabor comprehensive specialized hospital. The study participants were selected using a systematic random sampling method. Then the data was collected using face-to-face interview techniques. SPSS version 27also used for data analysis. Multivariable binary logistic regression model was fitted and adjusted odds ratios with 95% confidence interval was computed to determine the strength of association between each variable with waiting time at OPD. Variables with P-value < 0.05 will be considered as statistically significant.
Result: The mean (+SD) of waiting time at OPD was 90.02±36.148 minutes (95% CI: 87.89- 92.35).Patients aged 45- 64 years (AOR:2.11(1.07-4.16), male patients (AOR: 1.68(1.14-2.47), patients who residing in urban (AOR:1.53(1.05- 2.24),patients in cashier waiting areas (AOR:0.36(0.20-.64), patients whose charts transported by porters (AOR:0.17(0.05-0.57),patients served by punctual staff (AOR :0.54(0.32-0.89), patients receiving staff briefs on the OPD workflow (AOR:0.34(0.09-0.33),were associated with long waiting at OPD.
Conclusion and Recommendation: In this study the overage waiting time at OPD, bellow the WHO acceptable waiting time of 50 minutes was 13.8%. Contributing factors to long wait times included age (45-64 years), male gender, urban residency, and registration inefficiencies. To meet WHO standards, healthcare facilities should streamline registration, improve staff punctuality, and enhance OPD communication. Targeted interventions for vulnerable groups, particularly older males and urban residents, are essential to reduce wait times and improve patient satisfaction.
Keywords
Waiting for Consultation, Outpatient Department
Abbreviations and Acronyms
The study utilizes several acronyms and abbreviations to improve readability. These include
AOR (Adjusted Odds Ratio)
DC (Data Collection)
ED (Emergency Department)
ETB (Ethiopian Birr)
GC (Gregorian Calendar)
KM (Kilometer)
OR (Odds Ratio)
LOS (Length of Stay)
OPD (Outpatient Department)
PI (Principal Investigator)
RCT (Randomized Control Trial)
TCWT (Total Clinic Waiting Time)
SPSS (Statistical Package for Social Science)
UK (United Kingdom), and US (United States)
COPD (Chronic Obstructive Pulmonary Disease)
Epi Info (Statistical Software for Epidemiology)
FEV1 (Forced Expiratory Volume in one second)
FVC (Forced Vital Capacity)
NCDs (Non-Communicable Diseases)
PEF (Peak Expiratory Flow)
PEFR (Peak Expiratory Flow Rate)
PFT (Pulmonary Function Test)
Terms related to sanitation workers include SW (Sanitation Workers) and SWP (Solid Waste Pickers), while WHO refers to the World Health Organization.
Introduction
Background
The outpatient department is thought of as the entrance to hospital services, and it is here that a patient's first impression of the hospi- tal is formed [1]. Patient satisfaction can be impacted by how long patients believe they waited during outpatient office appointments and by correcting doubt, correct wait time information may in- crease patient satisfaction [2]. The recommended national waiting time for OPD is suggested to be <50 minutes [3]. Yet patient hap- piness, access to care, health outcomes, trust, willingness to return, and hospital revenue are all impacted by waiting times in hospital outpatient clinics [4]. In dental clinic, an average outpatient wait time was 84.84 minutes. Patient satisfaction with wait time, hospi- tal condition, and quality of care ranged from 60% to 80%. Patient perceptions of wait time, justification, intention to return, and will- ingness to recommend were significantly tied to satisfaction [5]. A significant part of minimizing wait times is increasing the amount of office personnel, doctors, and equipment. The cost element is discovered to be one of the least significant elements in shortening the wait time [6]. The average wait time in primary healthcare unit at Malysiawas 41 minutes from registration to doctor appointment and about 99% of patients had to wait less than 30 minutes to re- ceive their medication [7,8]. In the surgery and nephrology de- partments, the wait times were 17.92 minutes and 126.56 minutes, respectively [7].
The main reasons for the lengthy wait times for patients at the Debre Markos and Felege Hiwot hospitals, respectively, were the high patient to doctor ratios (40.5%, 28.9%, long card searches (28.9%, 31.5%), and long registration times (25.4%, 732.5%) [9]. Patients who saw a trainee spent less time waiting to see a doctor, spent more time in total with a doctor, and were more satisfied with the wait time [10]. There is little evidence to establish the relation- ship between waiting time and clinic quality [11]. According to the findings of the study conducted in a hospital in Lithuania, a longer wait time was substantially correlated with the following reasons for absence: Work-related issues, health issues resolved at a differ- ent healthcare facility, unspecified personal issues, and unspecified absence reasons .However, referral prioritization and attendance and cancellation policies were the most often employed waiting time management techniques for reducing long patient wait times in the OPD [12]. Some international and national recommenda- tions such as using simple techniques and analysis, without adding more resources, significant gains in accessibility for patients wait- ing for care can be made [13].
Another strategy to shorten the lengthy wait times at the interna- tional level that focused on doctor- tailored methods for cutting down on outpatient wait times revealed a 30% drop in the likeli- hood that patients would endure protracted waits [14].The need for healthcare facilities and hospital administrators to address gaps in human resources, infrastructures, and other internal procedures and institutional systems aimed at reducing waiting times and en- suring an effective health care was also demonstrated by an at- tempt to reduce waiting times at OPD in Ethiopia, specifically in the Amhara region [9].
However, due to the failure of those initiatives, OPD waiting times for treatments in Ethiopia continue to increase up to 185 minutes each patient visits on Monday, with early arrivals more likely, to experience lengthier wait times than late arrivals [3]. Additionally, the age of the patients (>50yrs) location (rural dweller), low num- ber of doctors with high patient flow and respectively, as well as the clients' educational and occupational statuses, the clients' wait- ing area (OPD), and the clients' receipt of prompt service are im- portant factors [15]. In comparison to developed countries, wait- ing times are typically longer in developing countries. Therefore, by examining outpatient waiting times and the factors influencing them in this particular hospital, the study aims to provide tailored insights that can inform local healthcare policies and practices. Understanding these dynamics is crucial for improving patient care, enhancing operational efficiency, and addressing the unique challenges faced in the Ethiopian healthcare system. This local- ized approach aims to contribute to the broader goal of optimizing healthcare delivery and patient satisfaction in the region.
Methods And Materials
Study Design, Setting and Population
A facility-based cross-sectional study was conducted at Debre Ta- bor Comprehensive Specialized Hospital from April 1 to May 1, 2024. Debre Tabor is located 103 km from Bahir-Dar (capital of Amhara National Regional State) and 666 km from Addis Ababa (capital of Ethiopia). The town comprises 6 urban and 4 rural ke- beles. According to the 2019 census by the local Statistical Agen- cy of Debre Tabor town (LSD), the population is 60,563 (52.6% female). The hospital reported 263,028 outpatient visits in 2016 EPY (Ethiopian Physical Year), with cataract, glaucoma, pneumo- nia, vision examination, and dyspepsia being the top 5 conditions. In 2015 EPY, approximately 4372 patients were allocated monthly across 8 outpatient departments (OPDs), excluding chronic OPD and ART clinic.
Sample Size Determination and Sampling Procedure
To determine the sample size for this study, a single population proportion formula was used, focusing on the prevalence of long outpatient waiting times. A 40.5% prevalence rate was taken from previous studies at Felege Hiwot and Debre Markos hospitals. Us- ing a 95% confidence interval (Z=1.96) and a 5% margin of error, the initial sample size (nâ??) was calculated as 370. Adding a 10% non-response rate (37), the final sample size was 407. Study partic- ipants were selected using systematic random sampling based on daily queue and registration profiles. With 263,028 patients treated at the Debre Tabor Comprehensive Specialized Hospital's OPDs, the sample was proportionally allocated across the OPDs. A Kth interval of 4 (4372/1058) was used to select participants from each OPD. The distribution of participants across OPDs was as follows: OPD1 (140), OPD2 (145), OPD3 (102), OPD4 (117), OPD5 (148), OPD6 (148), OPD7 (124), and OPD8 (108). Data collection was planned for one month, and participants were selected at every fourth interval from each OPD, based on their respective propor- tions.
Operational Definitions
Waiting Time –Waiting time is the amount of spending time from first registration of patient up to first consultation with physicians and measured from the registration of patients to consultation time at outpatient department. Study participants who spent <50 minutes for consultation were considered as short and acceptable. However, if the study participants spent ≥50% minutes for OPD consultation considered as long waiting time [3].
Data Collection Tools and Procedures
Data was collected using structured interview questionnaires de- veloped from a review of related articles, particularly studies from the Amhara region and Addis Ababa. The questionnaire, covering sociodemographic, facility/service-related, and work process-re- lated factors influencing waiting times, as well as time spent in waiting areas, was pre-tested on 5% of patients at Felege Hiwot Comprehensive Specialized Hospital to assess validity, acceptabil- ity, and adaptability. The questionnaire was prepared in English, translated into Amharic, and back-translated to English. Self-ad- ministered questionnaires were provided to literate patients, while data collectors assisted those unable to read or write. Two BSc-holder nurses were recruited and trained for half a day on data collection procedures, consent acquisition, and ethical consider- ations. Data collection occurred in a private area to ensure patient confidentiality. The principal investigators performed the analysis, interpretation, and write-up.
Data Quality Control
Data quality was ensured by pre-testing the questionnaire on 5% of the total sample size at Felege Hiwot Comprehensive Specialized Hospital (similar population characteristics). Amendments were made based on pre-test findings to improve clarity, completeness, validity, and content. Close supervision and feedback were pro- vided to correct errors. Data collectors received a half-day training from the principal investigator on study objectives, consent proce- dures, and maintaining confidentiality. Supervisors and the princi- pal investigator checked collected data daily for completeness and took corrective measures as needed.
Data Processing and Analysis
Data was checked for completeness, consistency, and validity be- fore being entered into EPI-info 7.2.1 and analyzed using SPSS 27. Both descriptive and analytical methods were used, including bivariable and multivariable logistic regression to identify signif- icant factors (p < 0.20) influencing waiting times. These factors were then used in a multivariable model. Statistical significance was set at p < 0.05 (95% CI). Model fit was assessed using the Hosmer-Lemeshow test. Chi-square tests assessed associations, and Omnibus tests determined the fit of predicted data. Nagelk- erke R Square indicated the explanatory power of independent variables. Results were presented using text, figures, tables, and summary statistics.
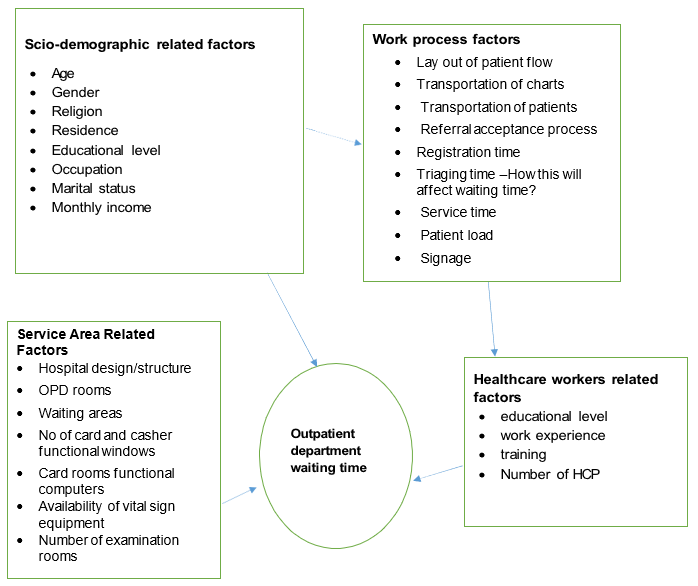
Figure 1: Conceptual Framework for the Study of Assessment Waiting Time for Consultation and its Associated Factors among Patients Attending at Adult OPD of Debre Tabor comprehensive Specialized Hospital, Northwest, Ethiopia, 2024(1,2,3,4).
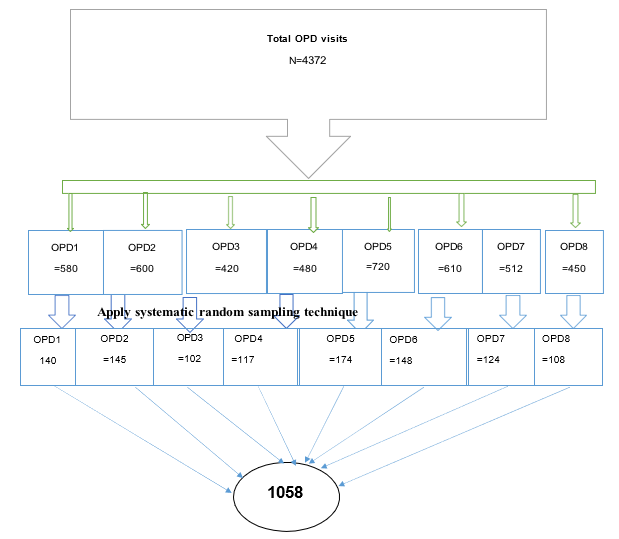
Figure 2: Schematic Presentations of Sampling Technique and Sampling Procedure of Outpatient Waiting in Debre Tabor Comprehensive Specialized Hospital, Ethiopia, 2024.

Figure 3: The Level of Waiting Times of Patients at OPD for Consultations in Debre Tabor Comprehensive Specialized Hospital, Ethiopia, 2024.
|
variables |
Ratio (unexposed: exposed) |
Factors affecting waiting time among patients attending at Adult OPD |
|
|
|
Refer. |
||||
|
long waiting |
Short waiting |
AOR |
power |
n1 |
NR 10% |
nf |
|
|||
|
Residence |
urban |
0.35:1 |
16.3% |
5.7% |
2.25 |
80% |
962 |
96.2 |
1058 |
(5) |
|
Rural |
1:1 |
7.34% |
7.34% |
- |
- |
- |
- |
- |
|
|
|
Date of visit |
Monday |
0.44:1 |
22.5% |
9.95% |
2.64 |
80% |
367 |
36.7 |
404 |
(5) |
|
Friday |
1.3:1 |
9% |
11.4% |
- |
- |
- |
- |
- |
|
|
|
Arrival time |
Early morning |
0.6:1 |
28.2% |
15.6% |
3.22 |
80% |
159 |
15.9 |
175 |
(5) |
|
Afternoon |
1.8:1 |
2.4% |
4.3% |
- |
- |
- |
- |
- |
|
|
Table 1: Sample Size Calculation based on Find out Factors Affecting Waiting Time Among Patients Attending at Adult OPD of Debre Tabor Comprehensive Specialized Hospital, Northwest, Ethiopia, 2024.
|
Variables |
Characters |
Frequency |
Percent (%) |
|
Age |
18-44 |
647 |
63.3 |
|
|
45-64 |
289 |
28.3 |
|
|
65+ |
86 |
8.4 |
|
Gender |
Male |
502 |
49.1 |
|
|
Female |
520 |
50.9 |
|
Religion |
Orthodox Christian |
803 |
78.6 |
|
|
Protestant |
63 |
6.2 |
|
|
Muslim |
156 |
15.3 |
|
Residence |
Urban |
486 |
47.6 |
|
|
Rural |
536 |
52.4 |
|
Marital status |
Single |
345 |
33.8 |
|
|
Married |
578 |
56.6 |
|
|
Divorced |
37 |
3.6 |
|
|
Widowed |
62 |
6.1 |
|
Educational level |
Unable to read and write |
259 |
25.3 |
|
|
Able to read and write |
276 |
27.0 |
|
|
Primary school |
25 |
2.4 |
|
|
High school |
165 |
16.1 |
|
|
Diploma and above |
297 |
29.0 |
|
Occupation |
Student |
165 |
16.1 |
|
|
Housewife |
195 |
19.1 |
|
|
Daily labor |
105 |
10.3 |
|
|
Merchant |
227 |
22.2 |
|
|
Private |
207 |
20.3 |
|
|
Government |
123 |
12.0 |
|
Monthly income (ETB) |
< 4000 |
645 |
63.1 |
|
|
≥4000 |
377 |
36.9 |
Table 2: Socio-Demographic Characteristics of Patients in Debre Tabor Comprehensive Specialized Hospital, Ethiopia, 2024(n=1022).
|
Factors |
Waiting time |
COR with 95% CI |
AOR with 95% CI |
p-value |
|
|
Short |
Long |
||||
|
Age |
|||||
|
18-44 |
89(13.8%) |
558(86.2%) |
1.67(0.94-2.92) |
1.81(0.97-3.38) |
0.061 |
|
45-64 |
34(11.8%) |
255(88.2%) |
1.99(1.06-3.731) |
2.11(1.07-4.16 |
0.031 |
|
65+ |
18(20.9%) |
68(79.1%) |
1 |
1 |
1 |
|
Sex |
|||||
|
Male |
56(11.1%) |
446(88.8%) |
1.56(1.08-2.24) |
1.68(1.14-2.47) |
0.009 |
|
Female |
85(16.3%) |
435(83.7%) |
1 |
1 |
1 |
|
Residence |
|
|
|
1.53(1.05-2.24) |
0.026 |
|
Urban |
55(11.3%) |
431(88.7%) |
1.50(1.04-2.15) |
1 |
1 |
|
Rural |
86(16.0%) |
450(84.0%) |
1 |
|
|
|
Income (in ETB) |
|||||
|
<4000 |
78(12.1%) |
567(87.9%) |
1.46(1.02-2.09 ) |
1.95(1.32-2.88) |
0.001 |
|
≥4000 |
63(16.7%) |
314(83.3%) |
1 |
1 |
1 |
|
Areas were waiting a long time |
|||||
|
Triage waiting areas |
18(9.7%) |
1617(90.3 |
1.16(0.62-2.16) |
0.90(0.47-1.701) |
0.736 |
|
Casher waiting areas |
34(26.4%) |
%) 95(73.6%) |
0.35(0.20-0.61) |
0.36(0.20-.64) |
<0.001 |
|
Card room area |
60(13.4%) |
387(86.6%) |
0.81(0.50-1.29) |
0.89(0.55-1.46) |
0.659 |
|
OPD waiting areas |
29(11.1%) |
232(88.9%) |
1 |
1 |
1 |
|
Transportation of charts |
|||||
|
Yes |
138(14.8 %) |
796(85.2%) |
0.20(0.06-0.65) |
0.17(0.05-0.57) |
<0.001 |
|
No |
3(3.4%) |
85(96.6%) |
1 |
1 |
1 |
|
Served in chronological order |
|||||
|
Yes |
118(14.8%) |
677(85.2%) |
0.65(0.40-1.04) |
0.67(0.41-1.10) |
0.115 |
|
No |
23(10.1%) |
204(89.9%) |
1 |
1 |
1 |
|
Punctual staffs |
|||||
|
Yes |
120(15.7 %) |
646(84.3%) |
0.48(0.30-0.78) |
0.54(0.32-0.89) |
0.017 |
|
No |
21(8.2%) |
235(91.8%) |
1 |
1 |
1 |
|
Any staff briefs regarding the workflow in OPD |
|||||
|
Yes |
82(13.3%) |
586(87.7%) |
0.46(0.31-0.68) |
0.34(0.09-0.33) |
0.02 |
|
No |
59(16.7%) |
295(83.3%) |
1 |
1 |
1 |
Table 3: Factors Associated with Waiting Times of Patients at OPD in Debre Tabor Comprehensive Specialized Hospital, Ethiopia, 2024.
|
Variables |
Character |
Frequency |
Percent (%) |
|
Waiting time in minutes |
<50 |
141 |
13.8 |
|
|
≥50 |
881 |
86.2 |
|
Stayed too long since arrived |
Yes |
712 |
69.7 |
|
|
No |
310 |
30.3 |
|
Reasons to wait long |
Number of few data clerk(s) on desk |
109 |
15.3 |
|
|
Number of few doctor (s) to attend the service on time |
166 |
23.3 |
|
|
Patients were too many |
315 |
44.2 |
|
|
Long queue of patient for service. |
122 |
17.1 |
|
Frequency of medical visit in this hospital |
<3 |
777 |
76.0 |
|
|
≥3 |
245 |
24.0 |
|
Areas were waiting a long time |
Triage waiting areas |
185 |
18.1 |
|
|
Casher waiting areas |
129 |
12.6 |
|
|
Card room area |
447 |
43.7 |
|
|
OPD waiting areas |
261 |
25.5 |
|
Reasons |
Late arrives at OPDs |
29 |
2.8 |
|
|
Doctors arrived late at OPDs |
23 |
2.3 |
|
|
Due to loss of cards |
577 |
56.5 |
|
|
High patient load in the OPDs |
111 |
10.9 |
|
|
Late chart transfer from card room to OPDs |
20 |
2.0 |
|
|
Long queue |
173 |
16.9 |
|
|
long queue at card and casher room |
46 |
4.5 |
|
|
Too many patients were at triage and card room areas |
43 |
4.2 |
|
Activities engaged, while waiting to see the doctor |
Watching television |
183 |
17.9 |
|
|
Sitting simply |
761 |
74.5 |
|
|
Reading newspaper or magazine |
48 |
4.7 |
|
|
Go to café |
30 |
2.9 |
|
Activity doing prefer mostly |
Reading |
237 |
23.2 |
|
|
Chatting |
204 |
20.0 |
|
|
Watching TV |
367 |
35.9 |
|
|
Listing health education talks |
214 |
20.9 |
|
The hospital staffs are punctual |
Yes |
766 |
75.0 |
|
|
No |
256 |
25.0 |
|
Any staff briefs regarding the workflow in OPD |
Yes |
668 |
65.4 |
|
|
No |
354 |
34.6 |
|
Any one give explanation about work flow to reach OPD |
by record clerks |
48 |
7.2 |
|
|
by porters |
122 |
18.3 |
|
|
by card room workers |
204 |
30.5 |
|
|
by health professionals |
275 |
41.2 |
|
|
by seeing the banners |
19 |
2.8 |
|
Any health talks given while in the waiting area |
Yes |
480 |
47.0 |
|
|
No |
542 |
53.0 |
|
Suggestions given to reduce waiting time to reach OPD |
Arrives early morning at hospital |
291 |
28.5 |
|
|
Ask health workers to facilitate services at each OP |
170 |
16.6 |
|
|
Improve systems of card room how to transfer charts to each OPD |
134 |
13.1 |
|
|
Increase OPD service room |
39 |
3.8 |
|
|
Respect office hours to get better and quick services |
263 |
25.7 |
|
|
using transportation to arrives early morning to hospital |
125 |
12.2 |
|
Any other suggestion |
All health workers to be punctual |
104 |
10.2 |
|
|
All heath workers should enter early |
214 |
20.9 |
|
|
Better to avail drugs and diagnostic materials |
465 |
45.5 |
|
|
Use Electronic medical record to prevent card lost |
239 |
23.4 |
Table 4: Facility Related Factors of Patients in Debre Tabor Comprehensive Specialized Hospital, Ethiopia, 2024(n=1022).
|
Variables |
Character |
Frequency |
Percent (%) |
|
Waited for a long time to receiving services |
Yes |
788 |
77.1 |
|
No |
234 |
22.9 |
|
|
Served in a chronological order manner (first come first served) |
Yes |
795 |
77.8 |
|
No |
227 |
22.2 |
|
|
Satisfied with the services provided |
Yes |
608 |
59.5 |
|
No |
414 |
40.5 |
|
|
Factors lead to dissatisfaction |
Long registration time |
201 |
19.7 |
|
Record clerk was not on the desk on time |
62 |
6.1 |
|
|
The record clerk was too harsh |
58 |
5.7 |
|
|
Disruption of queue by staff and other patients |
84 |
8.2 |
|
|
Registration materials were not available/inadequate |
9 |
0.9 |
|
|
Feel comfortable by hospital service |
Yes |
648 |
63.4 |
|
No |
374 |
36.6 |
|
|
Things makes it uncomfortable |
Lack of adequate/comfortable seats |
191 |
51.1 |
|
Lack of fans/air conditioners |
22 |
5.9 |
|
|
Waiting area is not neat |
59 |
15.8 |
|
|
Waiting area is having bad smell |
38 |
10.2 |
|
|
Poor /lack of toilet facilities |
64 |
17.1 |
Table 5: Service-Related Factors of Patients in Debre Tabor Comprehensive Specialized Hospital, Ethiopia, 2024(n=1022).
|
Variables |
Characters |
Frequency |
Percent (%) |
|
Having information charts/Signage how go to OPD waiting area |
Yes |
440 |
43.1 |
|
No |
582 |
56.9 |
|
|
Patient and chart transportation service |
Yes |
934 |
91.4 |
|
No |
88 |
8.6 |
|
|
Means of transportation of charts |
Porters |
823 |
88.1 |
|
Patient him/her self |
66 |
7.1 |
|
|
Health professional |
25 |
2.7 |
|
|
Card workers |
20 |
2.1 |
|
|
Were you served in a chronological order manner (first come first served) |
Yes |
794 |
77.7 |
|
No |
228 |
22.3 |
|
Reason coming to this hospital |
Personal decision Referral sheet By recommendation |
432 467 123 |
42.3 45.7 12.0 |
|
Believe that the patient load is a barrier to your service |
Yes |
654 |
64.0 |
|
No |
368 |
36.0 |
Table 6: Work Process Related Factors of Patients in Debre Tabor Comprehensive Specialized Hospital, Ethiopia, 2024(n=1022).
|
Variables |
|
Frequency |
Percent (%) |
|
Get all the prescribed medicines at this hospital |
Yes |
620 |
60.7 |
|
No |
402 |
39.3 |
|
|
Reasons |
drugs shortage |
180 |
44.8 |
|
not procured |
67 |
16.7 |
|
|
has no clear information |
110 |
27.4 |
|
|
do not know |
39 |
9.7 |
|
|
Others |
6 |
1.5 |
|
|
Get all services which need medical device assistive in the hospital |
Yes |
738 |
72.2 |
|
No |
284 |
27.8 |
|
|
Referred out the hospital currently |
Yes |
187 |
65.8 |
|
No |
97 |
34.2 |
Table 7: Availability of Drugs and Medical Equipment of Patients in Debre Tabor Comprehensive Specialized Hospital,Ethiopia,2024(n=1022).
Ethical Consideration
Ethical clearance was obtained from the University of Gondar, College of Medicine and Health Sciences, Institute of public health and Department of Health Systems and policy. Letter of permission was granted to Debre Tabor Comprehensive specialized hospital. After obtaining permission from those organizations, the data collectors were going to collect data. The data was collected after clearly explained the purpose of the study to the participants and after obtaining informed consent from each study participant.
Results
Socio-demographic Characteristics of Patients
The study includes 1022 study participants, with a response rate of 96.6%. The mean (+SD) age of the study participants was 40.0±15.80 years. While the mean (+SD) of monthly income of the household was 4017.1±2770.162 ETB.Nearly two third, 647(63.3%) of the study participants were found the age group of 18-44 yearsand 520(50.9%) of the study participants were females. About eight in ten, 803(78.6%) of the study participants religious affiliation is orthodox. Less than half,536 (52.4%) of the study participants lived in rural areas. Nearly six in ten, 578(56.6%) of the study participants were married. While one quarter, 259(25.0%) of the study participants not able to read and write. One fifth,227(22.2%) of the study participants were merchants.
Level of OPD Waiting Time
In this study the mean waiting time at OPD below the WHO acceptable waiting time of 50 minutes was 13.8% (95% CI:11.8- 16.0). However nearly nine in ten, 86.2% (95%CI:84.0-88.2) of the study participants waited at OPD greater than the national acceptable waiting times (>50 minutes. The mean (+SD) of waiting time at OPD was 90.02±36.148 minutes (95% CI:87.89- 92.35).
Factors Associated with Waiting Times of Patients at OPD
The Bivariate analysis output indicated that age, sex, residence, income, areas where waiting a long time, transportation of charts, served in chronological order,punctual staffs and any staff briefs regarding the workflow in Powder associated with long waiting at outpatient department at p-values below 0.2.Finally, one variable was eliminated and 8 variables were factors associated with the outcome variables at p value less than 0.005.
Patients who aged 45-64 years were more likely 2.11 times wait longer for OPD consultation than patients aged 65+ years (AOR:2.11(1.07-4.16). Male patients were more likely 1.68 times wait longer for OPD consultation compared to females (AOR: 1.68(1.14-2.47).
Patients who residing in urban were more likely 1.53 times experienced longer waiting times for consultation thanrural residents (AOR:1.53(1.05-2.24). Patients with an income of less than 4000 ETB were more likely wait longer for OPD osculation by1.95 times than patients who earned ≥4000 ETB (AOR:1.95(1.32-2.88). Patients in cashier waiting areas were less likely wait longer for OPD consultation by 64times than waited at OPD (AOR:0.36(0.20-.64). Patients whose charts transported by porters were less likely wait longer for OPD consultation by 83% times than those patients whose charts do not transported by porters (AOR:0.17(0.05- 0.57) .Patients served by punctual staff were less likely wait longer for OPD consultation by 46% times than who served by not punctual staffs (AOR :0.54(0.32-0.89).Patients receiving staff briefs on the OPD workflow were less likely waited for OPD consultation by 66% times reduced the longer waiting times compared than staff briefs on the OPD workflow(AOR:0.34(0.09-0.33).
Facility related Factors
The mean (+SD) the number of OPD visits of the patients was 2.72±1.676 times. The mean (+SD) the number of OPD visits of the patients was 2.72±1.676 times. More than two third, 712 (69.7%), of the study participants felt that they waited too long after arriving. About, 315 (44.2%). of the long waiting time was due too many patients. Study participants identified the card room areas as the locations where long wait times were most frequently reported, accounting for 447 (43.7%), followed by the OPD wait- ing areas, which accounted for 261 (25.5%). More than a half, 577(56.5%), followed by nearly one fifth, 173(16.9%) of the rea- sons for long waiting at OPD were due to loss of cards and long queue respectively. Majority, 761(74.5%) of the study participants engaged activities such as sitting simply, while waiting to see the doctor.One-third of the study participants, primarily preferred activities like watching TV. Two-thirds of the study participants, or 668 (65.4%), reported receiving briefings from staff about the workflow in the OPD.
Three in ten study participants, or 204 (30.5%), indicated that they received information about the workflow in the OPD from card room staff. More than half of the study participants, 542 (53.0%), reported not receiving any health-related talks while in the waiting area. One-quarter of the study participants, or 263 (25.7%), along with 465 (45.5%), provided suggestions to reduce waiting times in the OPD. These suggestions included respecting office hours for improved and quicker services and ensuring better availability of drugs and diagnostic materials.
Services related Factors
More than two third, 712 (69.7%), of the study participants felt that they waited too long after arriving. A significant proportion of the study participants, 795 (77.8%), and less than two-thirds, 608 (59.5%), reported being served in a chronological order (first come, first served) and expressed satisfaction with the services provided in the OPD. Nearly 201(19.7%) of the study participants express their dissatisfaction due to long registration time. Less than two third, 648(63.4%) of the study participants were feel comfortable by hospital service provided. More than a half, 191(51.1%) of the study participants felt discomfort due to lack of adequate/comfort- able seats. Majority, 761(74.5%) of the study participants engaged activities such as sitting simply, while waiting to see the doctor.
Work Process related Factors
The study showed that, or 440 (43.1% of participants), reported having access to information charts or signage that guide them to the OPD waiting area. The majority of study participants, 934 (91.4%), indicated that patients with chart transported by porters. Nearly nine in ten, 823(88.1%) of the study participants’ charts transportation was done by porters. During chart transportation, approximately 794 (77.7%) of the study participants reported that services are provided in a chronological order (first come, first served). Less than half, 467 (45.7%), came to the hospital with a referral sheet. Nearly two-thirds, 654 (64.0%), believed that the patient load acts as a barrier to the service.
Availability of Drugs and Medical Equipment
Less than two-thirds of the study participants, or 620 (60.7%), re- ported receiving all the prescribed medicines at this hospital. How- ever, less than half of the study participants, totaling 180 (44.8%), did not receive all prescribed medications due to a shortage of drugs in the hospital. The majority, 738 (72.2%), reported receiv- ing all necessary services that required medical assistive devices in the hospital. Nearly two-thirds, 187 (65.6%), indicated that they were currently referred out of the hospital for investigations.
Discussion
This study aims to evaluate adult outpatient waiting times for OPD consultation and the factors associated with them at Debre Tabor Comprehensive Specialized Hospital in Northwest Ethiopia in 2024. An institutional-based cross-sectional design was employed, and data were collected using structured questionnaires.In this study, only 13.8% (95% CI: 11.8-16.0) of participants experienced an OPD waiting time below the WHO acceptable limit of 50 min- utes. Conversely, nearly 86.2% (95% CI: 84.0-88.2) waited longer than this threshold. The mean waiting time at OPD was 90.02 ± 36.148 minutes (95% CI: 87.89-92.35). This study finding is in line with the study conducted in African nations like Nigeria re- vealed that the average time spent getting to the hospital was 83 minutes [16]. This similarity may stem from shared challenges in African healthcare systems, including high patient volumes, limit- ed resources, and infrastructural constraints, which often result in prolonged outpatient waiting times. Cultural and socioeconomic factors influencing healthcare access and service delivery may also contribute to these comparable waiting times across regions.
Hover this study finding is higher than the study conducted in Adare General Hospital in Hawassa City( 65.42 minutes),(15) ,Mozambique (43.5 minutes),(17),Northern Tanzania (35.0 min- utes to 22.5 minutes),(18) ,(47 minutes),(8),Raja Perempuan Zain- ab (23.0 minutes),(19),Gujarat Medical Education Research So- ciety Hospital(within 10 minutes to 20 minutes ),(1),Riyadh (23 minutes),(20),Chinese public tertiary general hospital (3.49 min- utes to 8.70 minutes),(21),Institutes of Health's cross-sectional re- search o(41 minutes),(7),Vietnam ( 50.41 minutes),(22),India( 20.3 minutes),(4). Factors contributing to this discrepancy may include higher patient volumes due to the hospital's referral status, inade- quate staffing levels that limit the capacity to manage patient flow, inefficient appointment scheduling leading to bottlenecks, and lim- ited availability of medical resources such as diagnostic equipment and treatment facilities. Additionally, a lack of streamlined pro- cesses for patient triage and registration, insufficient training for staff in managing high patient loads, and systemic issues within the healthcare infrastructure can exacerbate waiting times.
Hover this study finding is lower than the study conducted in Western Nigeria (137.02 ± 53.64 minutes), Ethiopia varies from region to region and ranged from 41 minutes to 185 minutes (3, 23), South Africa (122 minutes), and Western India (2.10 hours), (25), respectively [23,24].
This variation may be due to significant regional differences in healthcare infrastructure, resource allocation, and patient man- agement practices in Ethiopia. The shorter waiting times at Debre Tabor Comprehensive Specialized Hospital could indicate more efficient operations or a lower patient load compared to other facil- ities. Furthermore, effective regional health policies and communi- ty initiatives may have optimized outpatient services, resulting in shorter waiting times than those seen in other countries.
Patients aged 45-64 years were found to have 2.11 times longer waiting times compared to those aged 65 and older, suggesting that middle-aged patients may encounter more complex healthcare needs or higher demand for services. Similarly, female patients experienced longer waiting times, being 1.68 times more likely to wait compared to males, which aligns with findings that highlight gender differences in healthcare access and utilization patterns [26]. Geographic location also played a significant role; patients residing in urban areas were 1.53 times more likely to experience longer waits than their rural counterparts. This urban-rural dispari- ty is consistent with other studies indicating that urban settings of- ten face higher patient volumes, leading to increased waiting times [15]. Income level further influenced waiting times, with patients earning less than 4000 ETB being 1.95 times more likely to wait longer than those earning more , suggesting that socioeconomic factors can create barriers to timely healthcare access. Interest- ingly, patients in cashier waiting areas were 64 times less likely to have longer waiting times than those at the outpatient depart- ment indicating the efficiency of financial transactions in reducing delays. Moreover, the transportation of patient charts by porters significantly reduced waiting times by 83%, highlighting the im- portance of logistical support in healthcare settings. Staff punctu- ality also emerged as a crucial factor; patients served by punctu- al staff had 46% shorter waiting times compared to those served by non-punctual staff. Finally, receiving staff briefs on outpatient workflow led to a 66% reduction in waiting times, emphasizing the need for effective communication and training within health- care teams. This multifaceted understanding of waiting times is supported by various studies, including a comprehensive analysis of 5,475 patients where the number of outpatient clinics and phy- sician work hours were linked to wait times [27]. Other studies corroborate that older patients and those visiting certain depart- ments, such as internal medicine, contribute to increased waiting times [28]. In Haiti, factors such as hospital flow understanding and staff participation were identified as significant contributors to lengthy wait times [29]. Furthermore, research at Adare Gener- al Hospital revealed that demographics, patient flow, and waiting area conditions significantly affected waiting times (15). Overall, these findings suggest that a combination of demographic, socioeconomic, and organizational factors contribute to varying waiting times experienced by patients across different settings.
Conclusion
This study reveals that outpatient waiting times at Debre Tabor Comprehensive Specialized Hospital exceed the WHO's accept- able limit of 50 minutes, with 86.2% of participants waiting longer. The mean waiting time was 90.02 ± 36.148 minutes, indicating significant improvement is needed. While 77.8% of participants reported being served in order and expressed satisfaction, many faced discomforts due to long registration times and inadequate seating. Key reasons for prolonged waits included lost cards and long queues. Moreover, over half of the participants did not re- ceive health talks during their wait. Patients aged 45-64 years and female patients experience longer waits, likely due to complex health needs and service utilization patterns. Urban residents face increased waiting times compared to those in rural areas, possibly due to higher patient volumes and late arrival patients have short waiting time. Moreover, lower income levels correlate with ex- tended waits, highlighting socioeconomic disparities in healthcare access. Efficient processes, such as chart transportation by porters and staff punctuality, can substantially reduce waiting times.
Authors’ Contribution
AA has generated the idea of this research, and GM, AS and GA contributed to data collection and statistical analysis. This manu- script was written by AS and revised by GM AS, and GA. All au- thors took their responsibility for the accuracy of the analysis and the contents of the study. Lastly, the final draft of the manuscript was read and approved by all authors.
References
- Patel, R., & Patel, H. R. (2017). A study on waiting time and out-patient satisfaction at Gujarat medical education research society hospital, Valsad, Gujarat, India. Int J Community Med Public Health, 4(3), 857-863.
- Lin, W. C., Goldstein, I. H., Hribar, M. R., Sanders, D. S., & Chiang, M. F. (2020, March). Predicting wait times in pediatric ophthalmology outpatient clinic using machine learning. In AMIA Annual Symposium Proceedings (Vol. 2019, p. 1121).
- Biya, M., Gezahagn, M., Birhanu, B., Yitbarek, K., Getachew, N., & Beyene, W. (2022). Waiting time and its associated factors in patients presenting to outpatient departments at Public Hospitals of Jimma Zone, Southwest Ethiopia. BMC Health Services Research, 22(1), 107.
- Sriram, S., & Noochpoung, R. (2018). Determinants of hospital waiting time for outpatient care in India: how demographic characteristics, hospital ownership, and ambulance arrival affect waiting time. Int J Community Med Public Health, 5(7), 2692-8.
- Motloba, P. D., Ncube, O., Makwakwa, L. N., & Machete, M.L. (2018). Patient waiting time and satisfaction at a Tertiary Dental School. South African Dental Journal, 73(6), 400-405.
- Abdelmaged, M. A. M. (2021). Investigating the Impact of Omni-health Integration on Waiting Time in Health Care Centers. ResearchBerg Review of Science and Technology, 1(1), 41-49.
- Ahmad, B. A., Khairatul, K., & Farnaza, A. (2017). An assessment of patient waiting and consultation time in a primary healthcare clinic. Malaysian family physician: the oficial journal of the Academy of Family Physicians of Malaysia, 12(1), 14.
- Thapa, R., Saldanha, S., Bucker, N., & Rishith, P. (2018). An assessment of patient waiting and consultation time in the outpatient department at a selected tertiary care teaching hospital. Journal of Evolution of Medical and Dental Sciences, 7(8), 984-989.
- Belayneh, M., Woldie, M., Berhanu, N., & Tamiru, M. (2017). The determinants of patient waiting time in the general outpatient department of Debre Markos and Felege Hiwot hospitals in Amhara regional state, North West, Ethiopia. Glob J Med Public Heal, 6(5), 2277-9604.
- Yousef A, Lauthen D, Ramsey C, Zhang X, Athas J, Jenusaitis M, et al. Trainees Associated with Improved Wait Times and Patient Satisfaction in a Multidisciplinary Clinic. The Laryngoscope. 2023.
- Mehra, P. (2016). Outpatient clinic waiting time, provider communication styles and satisfaction with healthcare in India. International journal of health care quality assurance, 29(7), 759-777.
- Deslauriers, S., Raymond, M. H., Laliberté, M., Lavoie, A., Desmeules, F., Feldman, D. E., & Perreault, K. (2017). Access to publicly funded outpatient physiotherapy services in Quebec: waiting lists and management strategies. Disability and rehabilitation, 39(26), 2648-2656.
- Johannessen, K. A., & Alexandersen, N. (2018). Improving accessibility for outpatients in specialist clinics: reducing long waiting times and waiting lists with a simple analytic approach. BMC health services research, 18(1), 827.
- Lee, H., Choi, E. K., Min, K. A., Bae, E., Lee, H., & Lee,J. (2022). Physician-customized strategies for reducing outpatient waiting time in South Korea using queueing theory and probabilistic metamodels. International journal of environmental research and public health, 19(4), 2073.
- BELGUDA, A. (2018). Determinants of Patient Waiting Time in Outpatient Departments at Adare General Hospital in Hawassa City, Southern Ethiopia (Doctoral dissertation, HU).
- Ogaji, D. S., & Mezie-Okoye, M. M. (2017). Waiting time and patient satisfaction: Survey of patients seeking care at the general outpatient clinic of the University of Port Harcourt Teaching Hospital. Port Harcourt Medical Journal, 11(3), 148-155.
- Wagenaar, B. H., Gimbel, S., Hoek, R., Pfeiffer, J., Michel, C., Cuembelo, F., ... & Sherr, K. (2016). Wait and consult times for primary healthcare services in central Mozambique: a time-motion study. Global health action, 9(1), 31980.
- Ishijima, H., Eliakimu, E., & Mshana, J. M. (2016). The “5S” approach to improve a working environment can reduce waiting time: Findings from hospitals in Northern Tanzania. The TQM Journal, 28(4), 664-680.
- Fahrurazi, F. E., Ibrahim, N. H., Mafauzy, N. M., Ismail, W.N. A. W., & Rusli, S. S. M. (2022). Factors affecting waiting time in Outpatient Pharmacy at Hospital Raja Perempuan Zainab II (HRPZ II). Journal of Pharmacy, 2(1), 1-7.
- Almusawi, M. A., Radwan, N. M., Mahmoud, N. E., Haji, A. M., & Alabdulkareem, K. I. (2023). Patient waiting time at primary healthcare centers in Riyadh Region, Saudi Arabia: A cross-sectional study. Dr. Sulaiman Al Habib Medical Journal, 5(3), 65-69.
- Sun, J., Lin, Q., Zhao, P., Zhang, Q., Xu, K., Chen, H., ... & Liu, Y. (2017). Reducing waiting time and raising outpatient satisfaction in a Chinese public tertiary general hospital-an interrupted time series study. BMC public health, 17(1), 668.
- Tran, T. D., Van Nguyen, U., Nong, V. M., & Tran, B. X. (2017). Patient waiting time in the outpatient clinic at a central surgical hospital of Vietnam: Implications for resource allocation. F1000Research, 6, 454.
- Usman, I. N., Olanrewaju, S. O., & Usman, S. O. (2020). Breast self-examination practice among female secondary school students in Osogbo, Western Nigeria. European Journal of Medical and Health Sciences, 2(2).
- Egbujie, B. A., Grimwood, A., Mothibi-Wabafor, E. C., Fatti, G., Tshabalala, A. M. E. T., Allie, S., ... & Oyebanji,O. (2018). Impact of ‘Ideal Clinic’implementation on patient waiting time in primary healthcare clinics in KwaZulu-Natal Province, South Africa: A before-and-after evaluation. South African Medical Journal, 108(4), 311-318.
- Bhambere, S. (2017). The long wait for Health in India-A study of waiting time for patients in a tertiary care hospital in Western India. International Journal of Basic and Applied Research, 7(12), 108-111.
- Ahmed, A. A., Ibro, S. A., Melkamu, G., Seid, S. S., & Tesfaye,T. (2020). Length of stay in the emergency department and its associated factors at Jimma Medical Center, Southwest Ethiopia. Open Access Emergency Medicine, 227-235.
- Aeenparast, A., Maftoon, F., Farzadi, F., & Mohammadi, A. (2015). Waiting Time for First Outpatient Visit in Specialty Level: Assessing the Provider Related Factors. Archives of Iranian Medicine (AIM), 18(3).
- Nguyen, S. T. T., Yamamoto, E., Nguyen, M. T. N., Le,H. B., Kariya, T., Saw, Y. M., ... & Hamajima, N. (2018). Waiting time in the outpatient clinic at a national hospital in Vietnam. Nagoya journal of medical science, 80(2), 227.
- Altema, J., Bien-Aime, K., Roger, M. C., & Blaise, W. (2020). Causes of long wait time in health consultation services and strategies to reduce them: an observational study in rural Haiti. The Lancet Global Health, 8, S33.