
Journal of Applied Material Science & Engineering Research(AMSE)
ISSN: 2689-1204 | DOI: 10.33140/AMSE
Impact Factor: 0.98

Review Article - (2024) Volume 8, Issue 1
A Comparative Study of PCA and LDA for Dimensionality Reduction in a 4-Way Classification Framework
2Networked Objects, Control and Communication Systems,National Engineering School, Tunisia
Received Date: Mar 26, 2024 / Accepted Date: Apr 12, 2024 / Published Date: Apr 26, 2024
Copyright: ©Â©2024 Besma MABROUK, et al. This is an open-access article distributed under the terms of the Creative Commons Attribution License, which permits unrestricted use, distribution, and reproduction in any medium, provided the original author and source are credited.
Citation: MABROUK, B., Jazzar, N., Hamida, A. B., Sellami, L. (2024). A Comparative Study of PCA and LDA for Dimensionality Reduction in a 4-Way Classification Framework. J App Mat Sci & Engg Res, 8(1), 1-6.
Abstract
Alzheimer's disease (AD), recognized as the second-most impactful neurological disorder and currently incurable, stands as the leading cause of dementia. An imperative research focus is efficiently diagnosing the stages of patients, distinguishing early or late Mild Cognitive Impairment and AD from those with normal cognitive function. Advancements in anatomical and diffusion-weighted imaging, coupled with machine learning techniques, have significantly progressed in this predictive domain. However, in real-world trials, datasets often contain numerous features, and the curse of dimensionality can introduce challenges such as increased computational complexity, overfitting, and diminished model interpretability. To address these issues, the present study explores the efficacy of Principal Component Analysis (PCA) and Linear Discriminant Analysis (LDA) as dimensionality reduction techniques. LDA, a supervised technique emphasizing class separability, surpasses PCA, particularly in selecting features that significantly contribute to discriminating between classes. The 3D-LDA features obtained were subsequently assessed across various machine learning algorithms, leading to the establishment of a 4-way classification framework that utilized the K-Nearest Neighbors model. The outcome of this evaluation yielded an impressive accuracy rate of 87% in predicting the four different classes.
Keywords
Alzheimer Disease; Principal Component Analysis (PCA); Linear Discriminant Analysis (LDA); Dimensionality Reduction; 4-Way Classification; Machine Learning Algorithms, K-Nearest Neighbors Model
Introduction
Each year, Alzheimer's disease impacts a significant portion of the global population, as indicated by a recent projection that estimates one in every 85 individuals will confront this condition by 2050 [1]. Ranked as the second-most impactful neurological disorder globally, dementia symptoms appear in approximately sixty to eighty percent of individuals diagnosed with Alzheimer's disease. Therefore, establishing an early diagnosis of the disease is a priority in recent research.
Magnetic resonance imaging, particularly in various modalities such as anatomical MRI and diffusion-weighted images (DWI), has significantly contributed to advancing different stages of Alzheimer's disease (AD) diagnosis. However, regardless of the modality employed, the challenge of dealing with a vast number of features relative to a limited number of samples necessitates careful consideration during feature extraction and dimensionality reduction. Indeed, two widely utilized techniques in the realm of dimensionality reduction are Linear Discriminant Analysis (LDA) and Principal Component Analysis (PCA). In one study, the authors employed PCA in conjunction with a Multi-Kernel Support Vector Machine (SVM) to achieve an impressive 84% accuracy in a 4-way classification based solely on structural MRI [2]. A noteworthy enhancement was achieved in through the utilization of Positron Emission Tomography (PET) images [3]. Subsequently, Principal Component Analysis (PCA) features were integrated with neural networks (NN) and support vector machine (SVM) classifiers, resulting in an impressive accuracy of 89.52%.
To achieve a similar objective, several researchers have opted to incorporate Linear Discriminant Analysis (LDA). In a specific investigation cited as centered on anatomical MRI images, the authors initiated their approach with a statistical t-test for feature selection [4]. The resulting subset was then inputted into the Kernel Principal Component Analysis (KPCA) module. Following this, the LDA method was utilized to project the KPCA coefficients into a more efficient linear discriminant space
Ultimately, the researchers employed a multi-kernel Support Vector Machine (SVM) to accomplish the 3-way classification task.
In the context of a 4-way classification scenario, the authors have advocated for the utilization of a statistical Pearson correlation method combined with Linear Discriminant Analysis (LDA) for feature selection. When applied to a brain connectome dataset extracted from diffusion-weighted images, they successfully demonstrated the efficacy of their methodologies in a multi-class classification context [5].
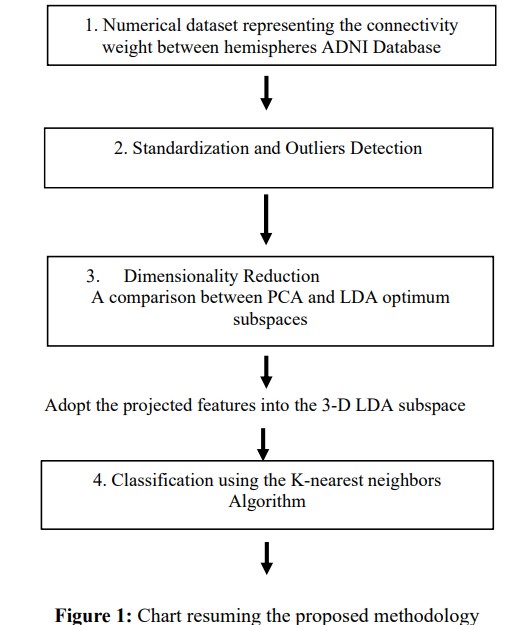
In the present investigation, both the PCA and LDA methods were implemented, leveraging their capacity to convert high- dimensional data into a lower-dimensional space while retaining crucial information. A comprehensive comparison of the derived features was conducted, and the efficacy of LDA features was assessed across multiple classifiers. Ultimately, a 4-way classification framework was constructed using the K-Nearest Neighbors algorithm. A flowchart summarizing the methodology proposed in this study is illustrated in Figure 1.
Materials and Methods
Materials
The images utilized in this study were gathered from the ADNI database (adni.loni.usc.edu), established with the primary aim of supporting Alzheimer's disease (AD) research. Automated image preprocessing was conducted in alignment with recent advancements in the field [6,7]. The key preprocessing steps included normalization, denoising, and artifact correction (addressing Eddy currents and bias fields), as well as skull stripping. Subsequently, co-registration between anatomical and diffusion-weighted images for each subject was performed, followed by boundaries creation, and streamlines generation.
The resulting output is the brain connectome, an 84 by 84 symmetric matrix where each element Wi,j represents the normalized connectivity strength between nodes I and J. From this connectome, we specifically focus on the numerical data representing connectivity between hemispheres, given their proven effectiveness in Alzheimer's disease detection [5].
The present study encompasses 237 subjects categorized into distinct groups: healthy controls, individuals diagnosed with early and late mild cognitive impairment, and subjects with Alzheimer's disease. Corresponding information for each group is summarized in Table 1.
|
Class |
Gender |
Age(mean) |
Size |
|
NC |
27 M/35 F |
72.25 |
62 |
|
EMCI |
34M/28 F |
77.78 |
62 |
|
LMCI |
31M/26F |
77.51 |
57 |
|
AD |
22 M/26 F |
74.68 |
4 |
Table 1: Demographic and clinical Information
Standardization and Outliers Detection
To ensure a more refined dataset, it is often crucial to standardize the samples. Standardization involves scaling the features to have a mean of 0 and a standard deviation of 1. This is important when the features in the dataset have different units or scales, ensuring that no single feature dominates the analysis due to its magnitude.
Another focus in the data preprocessing phase is on detecting outliers. Extreme data points that deviate substantially from most of the dataset have the potential to adversely affect the performance of certain machine learning models. Addressing these outliers at the outset of the process is crucial, as it paves the way for the development of more resilient models.
After experimenting with multiple outlier detection methods, we have adopted the Isolation Forest ensemble learning-based approach. This involves constructing a collection of isolation trees and combining their outcomes to identify outliers. We have set a 5% contamination rate and obtained satisfactory anomaly detection results.
Dimensionality Reduction
Indeed, there are 861 features, capturing the overall connectivity between forty-two nodes in both the left and right hemispheres. The abundance of features, when contrasted with the number of studied samples, introduces a challenge known as the curse of dimensionality. This circumstance results in an underdetermined matrix, presenting various challenges and issues. Particularly, the lack of a unique solution can amplify computational complexity and compromise model generalization. To streamline the dataset,enhance manageability, and potentially boost machine learning model performance, we choose to employ dimensionality reduction techniques. Thus, we experiment with two of the most used approaches: PCA and LDA.
Principal Component Analysis
Principal Component Analysis (PCA) is a well-known datadriven technique that decomposes high-dimensional data into its most statistically descriptive factors. According to the principalcomponents (PCAs) are determined as follows; let the data matrix X be represented as an n by m matrix [8]. Firstly, the row- wise mean, denoted as xÃÃÂ???, is computed. Then, the average matrix is subtracted from the matrix X, to obtain the mean-centered data, denoted as B. Noting that xÃÃÂ???, is determined as follows:
![]()
Where i is a given feature, n is the number of subjects, and j is the index of subject. Perform an eigen-decomposition of the covariance or correlation matrix C, with:
With λ being a diagonal matrix that summarizes the squares of the singular values (eigenvalues), and V denotes the corresponding eigenvectors. Once the eigenvalues are sorted in descending order, the corresponding eigenvectors signify the principal components.
The k components, which contribute to a higher percentage of variance, are selected to project the dataset. The resulting new space clearly captures more variability.
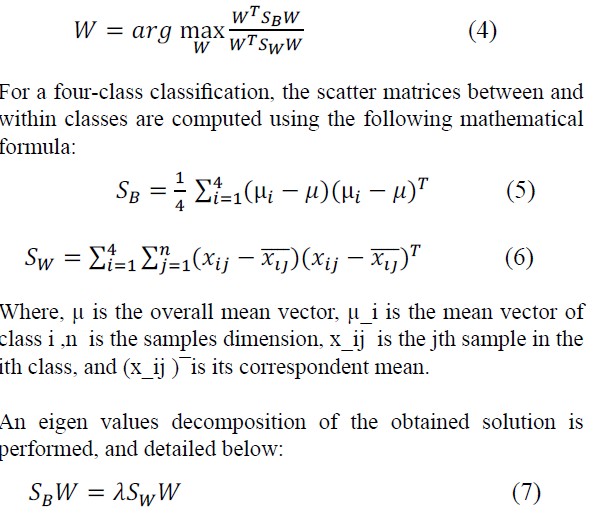
Linear Discriminant Analysis Another frequently employed dimensionality reduction technique is Linear Discriminant Analysis. It proves particularly valuable in identifying linear combinations of features that effectively separate two or more classes within a dataset. Essentially, LDA maximizes the separation between classes while simultaneously minimizing the variance within each class. According to [4,5], the fundamental concept in finding the discriminant component features, denoted by W, is to solve the generalized Rayleigh quotient:
Where λ is the eigenvalue.
Assuming S_Wis a non-singular matrix, we transpose the within- class variance matrix, leading to the simplification of Equation (7):
ðÂÂ??ðÂÂ??W–1ðÂÂ??ðÂÂ??BðÂÂ??ðÂÂ?? � λðÂÂ??ðÂÂ?? (8)
As the ðÂÂ??ðÂÂ??W–1ðÂÂ??ðÂÂ??B matrix has no more than n−1 non-zero eigenvalues, we ultimately derive three distinct eigenvectors, which we use to project our dataset.
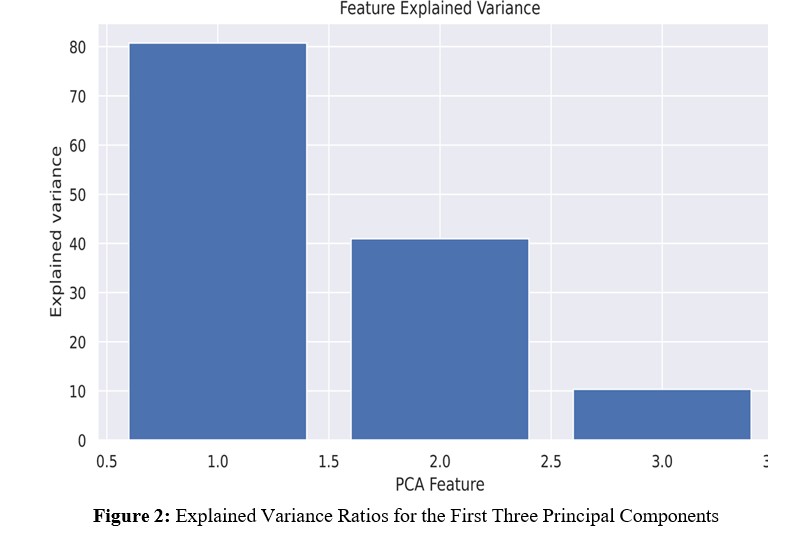
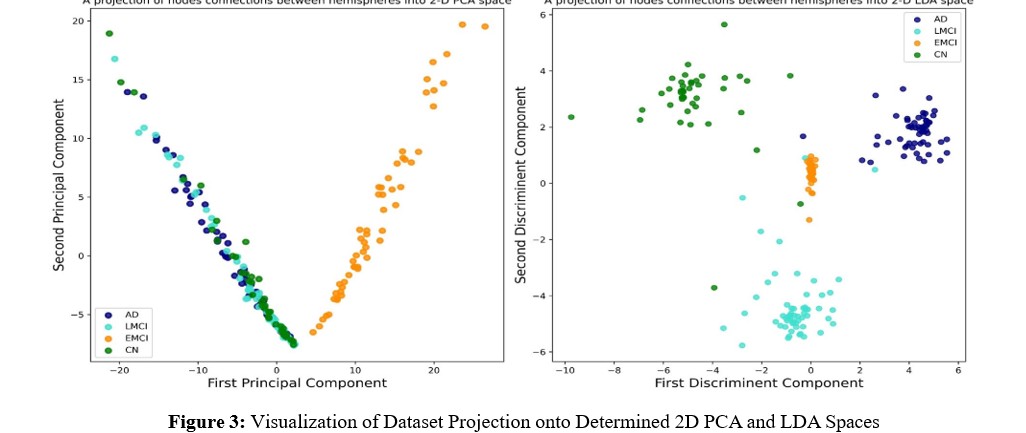
To assess the effectiveness of both PCA and LDA methods, we conducted experiments on our dataset. Regarding the PCA method, the explained variance ratios are presented in Figure 2. This figure illustrates the proportion of total variance explained by including each principal component. It is evident that the first two principal components exhibit notable efficiency, with the first capturing approximately 82% of the total variance and the second capturing around 42%.
For clarity, we performed a projection of the dataset onto the determined 2D PCA and LDA spaces, as illustrated in Figure 3. Analyzing this figure allows us to draw conclusions about the efficiency of the LDA method, indicating not only its effectiveness in dimensionality reduction but also its capability to enhance the separability between classes when compared to PCA. Following the thorough evaluation of the effectiveness of the LDA features, we made the decision to advance to the classification task utilizing these specific features.
Result and Evaluation
This study aimed to establish a comprehensive framework for a 4-way multiclass classification of Alzheimer's Disease. The LDA features obtained were split into an 80/20 ratio for training and testing multiple models, respectively. The selected classifiers included the Multi-Layer Perceptron (MLP), Support Vector Machine (SVM), Random Forest (RF), Decision Tree, Logistic Regression (LR), and K-Nearest Neighbors. We opted to assess their performances based on their respective accuracies [9]:

Among the cited models, the K-Nearest Neighbors algorithm achieved the highest accuracy, reaching 87%. In fact, we have implemented KNN in scikit-learn and experimented with multiple values for the n_neighbors parameter. Additionally, we explored the hyperparameter for weighting, considering both uniform and distance-based options.
A boundary decision plot is provided in Figure 4, which details the best-found results. This plot highlights the
Optimal choice of fifteen nearest neighbors with uniform weighting, leading to the most favorable outcomes.
In summary, in the context of a four-way classification scenario, Linear Discriminant Analysis and Principal Component Analysis serve distinct roles in extracting pertinent information from the data. PCA, an unsupervised technique, primarily focuses on capturing the maximum variance within the dataset across all classes. Nevertheless, its efficacy seems confined to the detection of the LMCI class, as indicated by Figure 3, whereas a noticeable overlap exists among the other cohorts. This overlapping poses challenges, especially in clinical trials where precise class separability is crucial.
Conversely, LDA, as a supervised method, explicitly takes class labels into account during its dimensionality reduction process. By maximizing the ratio of between-class variance to within- class variance, LDA significantly enhances the discriminative power of features for classification tasks. In our specific scenario.
LDA has successfully identified directions that maximize the separation between classes, thereby markedly improving the classifier's performance when compared to PCA.
Despite its undeniable efficiency in a multiclass classification context, a notable limitation of LDA method arises from its nature as a supervised method. While LDA is trained based on the available labeled data, its ability to adapt to unforeseen patterns or classes not present in the training set becomes a significant concern. In situations where the dataset for training is not fully representative of the diversity expected in real-world applications, LDA may struggle to generalize effectively.
This limitation underscores the importance of carefully considering the representativeness of the training data and the potential need for supplementary techniques or approaches to enhance the model's adaptability to novel and unseen samples.
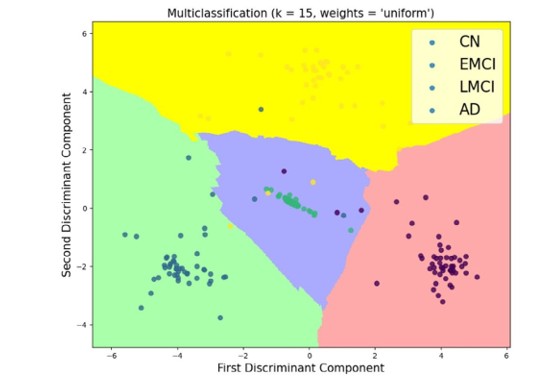
Figure 4: Illustration of the Decision Boundary Plot Using the k-Nearest Neighbors Algorithm for a 4-Way Multiclass Classification
Conclusion
In the current study, both PCA and LDA methods have played a substantial role in streamlining brain connectivity datasets, addressing multicollinearity concerns. Nevertheless, it becomes evident that LDA surpasses PCA by demonstrating greater efficiency in enhancing between-class separability and, consequently, improving the performance of machine learning algorithms in a 4-way classification. To overcome the limitations inherent in the LDA method and notably enhance accuracy when faced with unseen data, we plan to expand the dataset. This expansion will facilitate the utilization of deep learning techniques in subsequent phases of our research.
References
- Ghazal, T. M., & Issa, G. (2022). Alzheimer disease detection empowered with transfer learning. Computers, Materials & Continua, 70(3), 5005-5019.
- Alam, S., Kang, M., Pyun, J. Y., & Kwon, G. R. (2016, July). Performance of classification based on PCA, linear SVM, and Multi-kernel SVM. In 2016 Eighth International Conference on Ubiquitous and Future Networks (ICUFN) (pp. 987-989). IEEE.
- López, M., Ramírez, J., Górriz, J. M., Álvarez, I., Salas- Gonzalez, D., Segovia, F., ... & Alzheimer's Disease Neuroimaging Initiative. (2011). Principal component analysis-based techniques and supervised classification schemes for the early detection of Alzheimer's disease. Neurocomputing, 74(8), 1260-1271.
- Alam, S., Kwon, G. R., & Alzheimer's Disease Neuroimaging Initiative. (2017). Alzheimer disease classification using KPCA, LDA, and multiâ?ÂÂkernel learning SVM. International Journal of Imaging Systems and Technology, 27(2), 133- 143.
- Mabrouk, B., Hamida, A. B., Mabrouki, N., Bouzidi, N., & Mhiri, C. (2024). A novel approach to perform linear discriminant analyses for a 4-way alzheimer’s disease diagnosis based on an integration of pearson’s correlation coefficients and empirical cumulative distribution function. Multimedia Tools and Applications, 1-17.
- Mabrouk, B., Bouzidi, N., Mhiri, C., & Hamida, A. B. (2022, May). Combination of volumetric and topologic brain characteristics towards a diagnosis of alzheimer’s disease in his earlier stage. In 2022 6th International conference on advanced technologies for signal and image processing (ATSIP) (pp. 1-4). IEEE.
- Mabrouk, B., BenHamida, A., Drissi, N., Bouzidi, N., & Mhiri, C. (2023). Contribution of brain regions asymmetry scores combined with random forest classifier in the diagnosis of alzheimer’s disease in his earlier stage. Journal of Medical and Biological Engineering, 43(1), 74-82.
- Peng, C. C., Huang, C. Y., & Chen, Y. H. (2023). Principal Component Analysis-Based Logistic Regression for Rotated Handwritten Digit Recognition in Consumer Devices. Electronics, 12(18), 3809.
- Parikh, R., Mathai, A., Parikh, S., Sekhar, G. C., & Thomas, R. (2008). Understanding and using sensitivity, specificity and predictive values. Indian journal of ophthalmology, 56(1), 45-50.