
Journal of Research and Education(JRE)
ISSN: 2996-2544 | DOI: 10.33140/JRE


Research Article - (2024) Volume 2, Issue 2
YouTube Career Analysis with the Combination of Trending and Sentiments Analysis
2Department of Information Science University of Technology (Yatanarpon Cyber City) Pyin Oo Lwin, Myanmar
Received Date: Jun 01, 2024 / Accepted Date: Jul 08, 2024 / Published Date: Jul 25, 2024
Copyright: ©©2024 Khin Than Nyunt, et al. This is an open-access article distributed under the terms of the Creative Commons Attribution License, which permits unrestricted use, distribution, and reproduction in any medium, provided the original author and source are credited.
Citation: Nyunt, K. T., Khin, N. T. W. (2024). YouTube Career Analysis with the Combination of Trending and Sentiments Analysis. J Res Edu, 2(2), 01-5.
Abstract
The advances in technology users frequently utilize online platforms and direct applications to access YouTube. The amount of people who make a career from YouTube has also increased dramatically along with the growth in the number of people who use the platform nowadays. They are having trouble selecting a YouTube career since it is extremely hard to determine which of the many categories and channels is most popular and appropriate for a particular country. The user can choose a successful career path and potentially become a successful YouTuber if they are aware of the most popular category or channel. Consequently, it has been suggested that YouTube Trending Analysis can assist those who are struggling to decide on a professional life, especially those who want to use YouTube as a source of income. The most popular careers in the United States (U.S.), Japan, and India right now are determined based on the content criteria of each video in YouTube. Additionally, the proposed machine learning model compares with Naïve Bayes Classifier, a method-based approach, to do sentiment analysis. Linear regression model is used to get the predicted results from trending analysis, then user is given an accurate, robust, and genuine recommendation for the proposed model's outcome in the visualization.
Keywords
YouTube Trending Analysis, Web Content Mining Techniques, Statistical Analysis, Linear Regression Model
Introduction
Todays, YouTube allows user to post, watch and share video for free. Every day, all YouTube users receive billions of views and hundreds of millions of hours of video [1]. YouTube content creators submitted 10,000 as they can earn money by creating a channel on the site. To choose the right career in YouTube, a particular approach is to collect all the data regarding popular videos, such as the number of views each video has had on YouTube and the duration of its trend [1]. The YouTube API, which the YouTube developer has made public, may be used to collect the data. With the aid of these data, which show the dislike count of any user to the public, one may better understand the fundamental requirements for a video to be listed in YouTube's trending category. Since December 14, 2021, YouTube has ceased making various content analytics, such the number of dislikes, publicly available due to privacy concerns [2]. Rather than displaying a personalized video, trending presents an equivalent selection of popular videos to a large number of people nationwide. With each update 1 time for 15 minutes videos on the trending list may trend up or down [1]. Therefore, it is difficult to determine which channels and categories are trending. Because of this, it has become quite challenging for those who wish to use YouTube as a source of income and encounter multiple challenges when it comes to making a career decision [2]. Due to a great deal of data, it is not easy to review an observation made by viewers of each video and categorize it as positive, negative, or neutral using statistical counts. The decision-making process is still underway, and we haven't yet received an immediate, accurate response.
As a trending analysis system, this paper attempts to resolve this issue and assist anyone who is thinking about selecting a YouTube career. Based on four features—views, likes, comment, and negative count in each video content—this paper proposes to implement the trending analysis with the YouTube platform for the US, Japan, and India during the period of January 1, 2023, to December 15, 2023. Due to YouTube's deactivation for reasons related to privacy, the statistical total of dislikes has not been visible to the public since December 14, 2021. The dislike count has been altered based on the negative findings of the sentiment analysis conducted using the comment count (statistical value) is transformed to comment (categorical value). By doing this, we are able to suggest customers in trending analysis more precise findings. And also, performance has been computed, in order to demonstrate accuracy with the evidence of predicted result and actual result using Linear Regression Model.
Research Design
This paper is designed to the combination of trending analysis and sentiment analysis to choose the right career in the YouTube platform. This paper is composed of two main analysis that are YouTube trending analysis and YouTube sentiment analysis. The results from these analyses are combined and then recommend for the US, Japan, and India to help them decide the most suitable career choice for individuals who plan to earn a living from the platform.
In trending analysis, the statistical count of every YouTube video is extracted from the YouTube video content by using YouTube API_KEYS [2] in order to establish the parameters for the YouTube Trending Analysis. In order to accomplish this, we mainly used three features: views, likes, comments. The YouTube trending analysis we discovered was based just on views count, but in this study, the system-generated result will offer accuracy and correctness to users because the used of various features. The proposed algorithm for trending analysis has nine steps:
• Create new columns view_count_start & view_count_end from view_count column.
• Create new columns likes_start & likes_end from likes column.
• Create new columns comment_count_start & comment_count_ end from comment_count.
• Create new column tags_count from tags column. tags have [None] values in it. Converting them to Null values. Which indicates the number of tags used in particular video?
• Create new columns trending_date_start & trending_date_end from trending_date column.
• Create new column hoursTakenToTrend from trending_date_start & publishedAt columns.
• Create new column trendingDaysDuration from trending_date_ start & trending_date_end columns.
• Drop columns trending_date, likes, publishedAt, view_count as they are no longer required.
• Add new column to combine the negative result from sentiment analysis
• Extracted the published day of the week, published year of each video, published month of each video, published time of a day.
• Display the trending categories and channels
• Calculate the accuracy result using linear regression model
According to below references, they are generally only based on views and likes in trending analysis. In this system, analysis is done mainly based on features such as view, like, comment, hoursTaken-ToTrend, daysTakenToTrend, trendingDuration, tagCount, negative sentiment, etc [5,6]. The result is reasonable, correct, and full of ac¬curacy.
Figure 1 shows that is a correlation analysis using 5 features out of the extracted features to know whether dependence or independence. By conducting correlation analysis, we were able to find out how much is correlated between each feature. If the view count increases from that analysis, the like count will likely increase. Similarly, assume that if the number of likes increases, it is likely that the number of comments will also increase. It can be clearly seen that features such as views ratio like 0.91%, likes ratio comments 0.85%, and views ratio comments 0.90% are strongly correlated with each other. In trending analysis, we analyzed the statistical count of each feature on the trending videos. In addition, this analysis found out 16,17,15 PM which time of the 24-hour day is the most video upload time and has the potential to be trending seen in Figure 3. Furthermore, we were able to analyze which days of the week have the most video uploads and which days have the least video uploads. Friday is the most upload video almost 40000 and Saturday is the least video upload over 30000 in US as seen in Figure 3. Primarily based on research observations, the number of views each trending video was calculated, together with the number of likes and comments with barplot shown in Figure 2. More than 60,000 trending videos have more than 90% of views below 5 million. More than 99% of the users who liked over 7,000 trending videos were found to be under 2 million in number. It has been observed that nearly 99% of the 150,000 trending videos have less than 100,000 comments. According to this research, it was founded that there is a difference between trending the most and watching the most audiences on a video. Verify that, Figure 3, 4, 5 amply demonstrated this point using boxplot. From an audience perspective, the music category had the greatest number of views, likes, and comments in US. According to this research finding, it takes at least 10 hours for a video to trend.

Figure 1: Correlation Analysis Between Five Features


Figure 2: The Statistical Analysis of Views, Likes, And Comments Count on Trending Videos
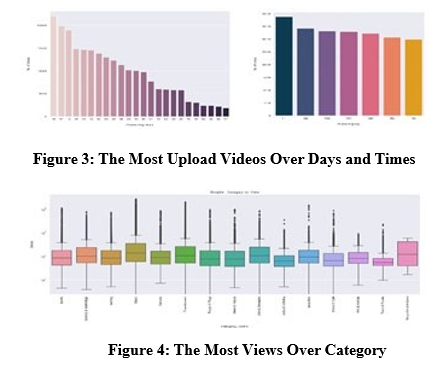
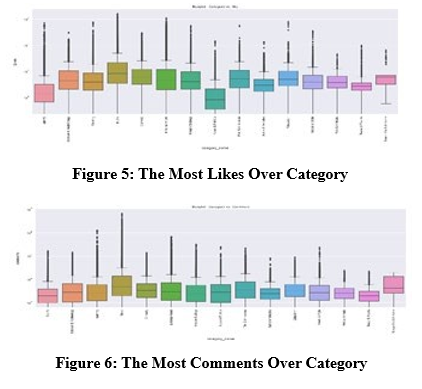


Figure 7: Sentiment Results and The Percentage of Negative Sentiment Result of Each Category
In sentiment analysis, we have utilized a feature associated with negative sentiment result in addition to the three features: views, likes, and comments that were previously described. Therefore, the total features views, likes, comments, and negative were mainly based. The comment count was used for sentiment analysis, and the negative result was achieved in place of the dislike feature. According to the below reference, even though it was based on the research, YouTube published the dislikes feature this time, but now the dislikes count is not known, so the sentiment analysis is done and the negative sentiment is contributed as a substitute for the dislike feature [3,4]. The left side of Figure 7 shows the positive and negative results from sentiment analysis of YouTube video comments by country, with the US being the only country with the results due to page limit. The right-side figure displays the percentage of negative sentiment given by audiences in each category obtained by conducting sentiment analysis.


Figure 8: The Most Trending Categories and Channels of US
This paper implemented the calculation of the most trending categories and channels of each country can be seen in Figure 8, combining the negative sentiment results and trending results. The left side of Figure 8 shows the most trending categories in the US in 2023, and the right side describes the most trending channels. Therefore, for those who are choosing a career to make a living on YouTube, in the US, we recommend that if user choose from the Top 5 categories Gaming, Entertainment, Music, Sports, and People & Blogs, user can become a successful YouTuber.
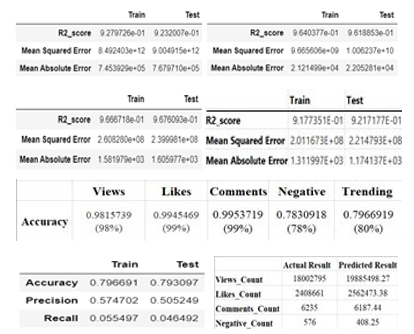
Figure 9: The Accuracy Result Using Linear Regression Model
Performance Evaluation
In accordance below reference, only Linear regression approach is used in this system. However, in this system, whether it is trending or not is more meaningful based on the time series [7]. Therefore, the trend linear regression approach based on the time series has been integrated and implemented, so it was able to produce more accurate results. Moreover In this paper, linear regression prediction and classification is used to predict trending based on the four features: views, likes, comments, and negative. This model is accomplished by using linear regression algorithm. Figure 9 shows the ratio of training 80% and testing 20% for each of the four features, which include views, likes, comments, and negatives. The R2 score, Mean Squared Error, and Mean Absolute Error values are also assessed well. Furthermore, in accordance with the research findings, Trending's Accuracy, Precision, and Recall values have been implemented. It is evident from examining each feature's accuracy value that this model is able to work effectively with the proposed trending algorithm.
Conclusion
This paper will be very helpful for those who are choosing a career to make a living on the YouTube social media platform for the US, Japan, and India, as well as content creators and YouTubers who are making a living as a professional life. In terms of how a video is trending, it is not decided based on views alone, but by considering views, likes, comments, and negative sentiment results, the results of this model are reasonable and specifically correct.
References
- Andry, J. F., Reynaldo, S. A., Christianto, K., Lee, F. S., Loisa, J., & Manduro, A. B. (2021, November). Algorithm of trending videos on youtube analysis using classification, association and clustering. In 2021 International Conference on Data and Software Engineering (ICoDSE) (pp. 1-6). IEEE.
- Nyunt, K. T., & Khin, N. T. W. (2023, February). Customized Criteria Based Trending Analysis for YouTube Platform. In 2023 IEEE Conference on Computer Applications (ICCA) (pp. 33-38). IEEE.
- Alkaff, M., Baskara, A. R., & Wicaksono, Y. H. (2020, November). Sentiment analysis of Indonesian movie trailer on YouTube using Delta TF-IDF and SVM. In 2020 Fifth International Conference on Informatics and Computing (ICIC) (pp. 1-5). IEEE.
- Wankhade, M., Rao, A. C. S., & Kulkarni, C. (2022). A survey on sentiment analysis methods, applications, and challenges. Artificial Intelligence Review, 55(7), 5731-5780.
- Eliganti, R., & Reddy, A. (2022). Youtube data analysis & prediction of views and categories. Sharvani, YouTube Data Analysis & Prediction of Views and Categories (April 6, 2022).
- HASAN, M. S., Sarker, B., Shrestha, D., Shrestha, R., & Shrestha, S. N. (2023). Trending YouTube Video Analysis.
- Rui, L. T., Afif, Z. A., Saedudin, R. R., Mustapha, A., & Razali,N. (2019). A regression approach for prediction of Youtube views. Bulletin of Electrical Engineering and Informatics, 8(4), 1502-1506.