


Research Article - (2024) Volume 9, Issue 2
Weighted Dual-Channel Model for Arrhythmia Detection using Single Electrocardiogram Signal
2Centre for Collaborative Research, Shanghai University of Medicine and Health Sciences, China
3College of Medical Imaging, Shanghai University of Medicine and Health Sciences, China
4Ruijin Hospital, Shanghai Jiao Tong University School of Medicine, China
5China Hospital Development Institute of Medical Intelligence Development, Shanghai, Jiao Tong University School, China
#Equally contribution
Received Date: Jun 13, 2024 / Accepted Date: Jun 28, 2024 / Published Date: Jul 05, 2024
Copyright: ©Â©2024 Liang Zhou, et al. This is an open-access article distributed under the terms of the Creative Commons Attribution License, which permits unrestricted use, distribution, and reproduction in any medium, provided the original author and source are credited.
Citation: Li, J., Fan, Z., Hou, Y., Zeng, Z., Lv, G., et al. (2024). Weighted Dual-Channel Model for Arrhythmia Detection using Single Electrocardiogram Signal. Cardio Open, 9(2), 01-14.
Abstract
The single-lead method plays a central role in arrhythmia warning, and its anomaly detection is of practical significance for the prevention of heart diseases. However, the detection performance is often limited due to the limited information content of single-lead electrocardiogram (ECG) signals. To address this issue, this paper proposes a weighted dual- channel arrhythmia classification model aimed at improving the detection performance of single-lead ECG signals. The model employs a parallel structure of CNN-LSTM and Transformer to capture both local and global features of the ECG signals. By applying weighted learning to the features from the two channels, the model achieves precise arrhythmia classification. Additionally, to alleviate the class imbalance problem, a weighted cross-entropy loss function is introduced, further enhancing the classification performance. Experimental results based on the MIT-BIH arrhythmia database demonstrate that the proposed model exhibits excellent performance in terms of overall accuracy, F1 score, and sensitivity, achieving 99.33%, 94.71%, and 99.33%, respectively. Compared with existing classification models, the proposed model shows superior classification performance and significant practical value, providing solid technical support for the auxiliary diagnosis of arrhythmias and bringing new possibilities for actual clinical applications.
Keywords
Arrhythmia Detection, Weighted Dual-Channel Model, Electrocardiogram, Transformer
Introduction
Cardiac arrhythmia is a common yet potentially dangerous heart condition that may lead to sudden cardiac arrest, stroke, and other serious cardiovascular events, even resulting in sudden death [1-4]. It is a major cause of mortality and morbidity globally, with millions of deaths attributed to arrhythmia-related cardiovascular events annually [5]. An especially worrying aspect is the presence of asymptomatic cardiac arrhythmias in many patients, who might even suffer a sudden fatal cardiac event without prior warning [6,7]. Therefore, early detection and diagnosis of arrhythmia are crucial for preventing cardiovascular events.
12-lead electrocardiography (ECG) has emerged as a vital diagnostic tool for screening and assessing cardiac abnormalities [8-10]. This non-invasive detection method allows comprehensive evaluation of the heart's electrical activity, providing rich information to aid in diagnosing various abnormalities and facilitating timely intervention and treatment. In real-world medical practice, obtaining a 12-lead ECG is often constrained by various factors, while single-lead ECG presents unique advantages with its simple acquisition method. It is easy to operate, fast, and widely applicable, not only for professional diagnosis in medical institutions but also in areas such as home monitoring and healthcare [11,12]. Single-lead ECG, as an important screening datum, provides robust support for early detection, diagnosis, and treatment of cardiac diseases such as arrhythmia. However, single-lead ECG information is relatively limited and may not accurately reflect the complex nature of heart diseases, thus posing certain limitations in diagnosis. This renders the detection of abnormal ECG signals through single- lead monitoring a challenging research task, requiring significant time and effort from cardiac specialists and researchers for in- depth exploration.
Fortunately, the rapid advancement of intelligent healthcare has provided new opportunities and research directions for addressing this issue. By leveraging advanced techniques such as signal processing, machine learning, and deep learning, we have the potential to achieve more precise and efficient screening and diagnosis of heart diseases. Teijeiro et al., addressed the problem of cardiac arrhythmia classification using abductive interpretation methods applied to short single-lead ECG recordings [13]. Mathews et al., utilized Restricted Boltzmann Machines (RBM) and Deep Belief Networks (DBN) for ECG signal classification, achieving average recognition accuracies of 93.63% for ventricular ectopic beats and 95.57% for supraventricular ectopic beats [14]. At the 2017 CinC Challenge, the RhythmNet model proposed by Xiong et al., achieved the fifth-place position, injecting new vitality into research and development in arrhythmia detection tasks and driving further exploration in this field [15].
From the aforementioned literature, it is evident that while significant progress has been made in improving the accuracy of multi-classification of single-lead ECG signals using deep learning, this field still faces a series of challenges and unresolved issues. One of the primary challenges is the susceptibility of single-lead ECG signals to noise and interference. These sources of interference may include poor electrode contact, muscle activity, and power line noise, which often obscure the true features of the electrocardiogram and consequently lead to classification errors [5]. Additionally, single-lead ECG data can only provide a local view of cardiac electrical activity. Due to the complex three-dimensional structure of the heart, single-lead data is relatively sparse and unable to comprehensively capture the electrophysiological information of the heart. This makes it difficult for models to adequately learn discriminative features during training, thereby affecting classification performance.
To address the challenges posed by the sparsity and information limitation of single-lead data, multi-channel feature learning offers a potential solution [16-18]. Multi-channel learning integrates information from different sources or perspectives, thereby enhancing the model's representational capacity and generalization performance. In the analysis of ECG signals, despite the limitations of single-lead data, leveraging multi- channel learning methods to capture both local and global information of the ECG signals through multiple channels assists the model in comprehensively understanding the cardiac electrophysiological state. This approach can partially compensate for the deficiencies of single-lead data and improve the accuracy of ECG signal classification. Addressing the aforementioned issues, this paper proposes a novel dual-channel weighted feature learning method combining CNN-LSTM with Transformer, aimed at extracting richer cardiac information from single-lead data and thereby enhancing the performance of ECG arrhythmia detection algorithms.
The main contributions of this paper are outlined as follows:
1. By integrating the CNN-LSTM and Transformer architectures, cooperative learning of local and global ECG signal features is achieved. This method automatically extracts multiple features from the input ECG signals, including deep spatial features, time-series features, and long-range dependency features.
2. This paper avoids the cumbersome manual feature extraction steps of traditional methods and instead utilizes the powerful representation learning capabilities of deep learning to achieve automated and efficient extraction of ECG waveform features. Moreover, to alleviate the impact of class imbalance on classification results, we employ weighted cross-entropy loss function for model optimization.
3. To validate the effectiveness of the proposed method, experiments on arrhythmia detection tasks were conducted on the MIT-BIH Arrhythmia Database, and the results were compared with state-of-the-art methods. Experimental results demonstrate that the proposed method performs excellently on various metrics, confirming its effectiveness and efficiency.
4. It is noteworthy that the proposed model only requires single- lead ECG data as input, making it widely applicable in practical scenarios, especially suitable for applications requiring real- time, continuous ECG monitoring, such as remote medical monitoring, health management, and sports science-related ECG monitoring scenarios.
The structure of this paper is as follows: In Section 2, we conduct an extensive review of the state- of-the-art research in the field of cardiac arrhythmia. In Section 3, we elucidate the theoretical foundations and implementation steps of the proposed methodology. In Section 4, we meticulously assess the performance metrics and compare them against baseline methods, demonstrating the efficacy of our proposed approach. In Section 5, we delve into a comparative analysis between our proposed model and existing methodologies. Finally, in Section
6, we summarize the key findings, discuss implications for further research, and identify potential avenues for extending the scope of our work.
Related Work
In recent years, the classification of cardiac arrhythmias in electrocardiograms has emerged as a research hotspot in the fields of medicine and artificial intelligence. Among them, the selection of feature extraction techniques is particularly crucial. Traditional machine learning methods are limited by manually designed features and struggle to learn sufficient patterns from limited training data, resulting in decreased classification performance on new data. In contrast, deep learning has the capability to automatically extract meaningful features from ECG signals. This section will delve into various feature extraction techniques, including CNN-based local pattern capture, RNN and LSTM-based temporal dependency analysis, Transformer- based self-attention mechanism and fusion of multi-channel information.
Convolutional Neural Networks (CNNs) extract local features from images using convolutional kernels, making them particularly suitable for image data processing. In the classification of ECGs, CNNs can extract morphological features from ECG signals and have a certain effectiveness in identifying diseases such as arrhythmias. Kiranyaz et al., proposed an adaptive 1D CNN model for directly extracting features from raw ECG data of patients and performing classification [19].
They successfully classified Ventricular Ectopic Beats (VEBs) and Supraventricular Ectopic Beats (SVEBs) with an accuracy of up to 99%. However, this method requires individual training for each patient, which is not only time-consuming but also computationally intensive. Acharya et al., developed a 9-layer deep CNN model for automatically identifying five different categories of heartbeats in ECG signals [20]. They achieved accuracies of 94.03% and 93.47% in diagnosis classification of original and noise-free ECG signals, respectively. However, the accuracies of CNN decreased to 89.07% and 89.3% when trained with highly imbalanced data (original dataset). Bhekumuzi et al., achieved high-accuracy arrhythmia classification by combining recurrence plot and CNN classifier, suitable for portable devices [21]. Its significant advantages include high accuracy and improved memory requirements. However, the problem of data imbalance was highlighted in the first-stage classification, resulting in accuracies of only 97.21%, sensitivity of 96.49%, and F1 score of 95.96%. Despite the significant achievements of CNN-based methods in ECG classification tasks, their ability to capture temporal information is relatively weak, which to some extent affects their performance in processing time-series data such as electrocardiograms. Therefore, many researchers further explore how to improve the accuracy and efficiency of ECG classification by combining other techniques.
Recurrent Neural Networks (RNNs) exhibit significant advantages in processing electrocardiogram (ECG) time- series data, effectively capturing the dynamic changes in ECG signals. However, when handling long sequences, RNNs often encounter the issues of vanishing or exploding gradients, which impact classification accuracy. To overcome this challenge, Long Short-Term Memory networks (LSTMs) have emerged, leveraging their unique gate mechanisms and memory units to better model long-term dependencies. Consequently, researchers frequently combine CNNs with LSTMs to enhance the model's capability in extracting features from ECG signals [22,23]. This combination enables LSTMs to more accurately capture long- term dependencies in ECG signals, significantly improving classification accuracy. Oh et al., proposed a CNN-LSTM model tailored for variable-length heartbeat data, developing a model capable of identifying and accurately performing five- classification tasks [24]. Through tenfold cross-validation, the model achieved an accuracy of 98.1%, sensitivity of 97.5%, and specificity of 98.7%. Jin et al., designed a dual-stage attention convolutional LSTM neural network that demonstrated significant effectiveness in capturing critical information at different levels of ECG signals, enabling accurate detection of multiple-label arrhythmias [25].
However, this study primarily relied on 12-lead ECG experiments, which may limit its generalizability and applicability in real-world settings. Additionally, some studies have found that although LSTM can learn long-term dependencies, its performance decreases with excessively long sequences due to the challenge of gradient vanishing [26]. Moreover, LSTM's computational complexity is relatively high, requiring more computational resources and time. The Transformer model is a neural network architecture based on self-attention mechanisms. In the context of ECG classification, Transformers excel at capturing dependencies between positions within input sequences, thereby effectively modeling long-range dependencies. This capability gives Transformers an advantage in processing time-series data such as ECG signals. Additionally, the self-attention layers in Transformer models facilitate parallel computation, making parallelization easier to achieve to some extent and enhancing computational efficiency.
Che et al., proposed a model framework that incorporates a Transformer network into CNNs to capture temporal information from ECG signals [27]. They introduced a new link constraint in the loss function to enhance the classification capability of embedded vectors. However, the achieved accuracy was only around 80%, indicating that the performance of various evaluation metrics still requires improvement. To address the application scenario of wearable electrocardiogram devices, Meng et al., developed a lighter-weight structure named LightConv Attention to replace the self-attention mechanism in the Fussing Transformer, ensuring a 99.32% accuracy while reducing parameter count [28]. Hu et al., proposed a model that utilizes single-lead data to simultaneously predict the positions and categories of all heartbeats within ECG segments, enabling end-to-end arrhythmia detection [29]. This model demonstrated good performance in various types of arrhythmia detection tasks, confirming its effectiveness and generalization capability in practical applications.
However, the self-attention mechanism of Transformer models requires significant computational resources and memory, potentially necessitating large-scale models and computational power for analyzing extensive electrocardiogram datasets. However, the multi-channel learning mechanism significantly enhances the model's generalization capability by allowing it to comprehend data from multiple dimensions. By integrating information from multiple channels, the model can more comprehensively capture the true representation of the data, compensating for the limitations of single-channel information. In this paper, we propose a parallel arrhythmia classification model based on dual-channel feature weighting, which relies solely on single-lead electrocardiogram signals as input, thereby reducing the complexity of data acquisition while retaining sufficient classification information. In this model, we combine the CNN-LSTM and Transformer architectures, where the former is utilized to learn local waveform features of the electrocardiogram signals, and the latter focuses on capturing long-range dependencies, thus strengthening the extraction of time-series features. Additionally, we employ a weighted cross-entropy loss function to address class imbalance issues, achieving precise four-class classification tasks.
Materials and Methods
ECG Signal Preprocessing
The raw electrocardiogram data in the arrhythmia database may contain noise, artifacts, and other non-cardiac signals, all of which could potentially affect the accuracy and reliability of subsequent analysis. Therefore, we employed noise removal, baseline correction, R-peak detection for heartbeat identification, as well as heartbeat segmentation and normalization to ensure data consistency and comparability. Figure 1 illustrates the workflow of the entire classification task.

Figure 1: The Workflow of the Entire Automated Classification Task
ECG Signal Baseline Calibration
ECG signals are typically subject to various types of noise interference, such as poor electrode contact, muscle movement, and power line interference. These noises can distort the morphological features of ECG signals, leading to erroneous information and inaccurate diagnoses. In diagnosing arrhythmias, baseline drift and fluctuations may obscure certain ECG features, thereby affecting physician interpretation. Therefore, baseline correction is performed to stabilize and smoothen the baseline of ECG signals, enhancing the visibility and clarity of true cardiac activity in the electrocardiogram.
We utilized a median filtering function to address baseline drift. Median filtering often employs a sliding window, wherein the pixel values within the window are sorted by magnitude, and the median value is selected as the output value for the current pixel. We chose an odd-sized window for filtering each data point, effectively eliminating transient, non-representative peaks. Additionally, we computed half the size of the filtering window to address boundary effects. Furthermore, we calculated the average value of the preserved portion in the filtered signal to adjust the final filtered signal, ensuring that the filtering process does not introduce systematic bias. Finally, we removed boundary effects from the filtered signal and subtracted the average bias to obtain the ultimate filtered signal. Through this approach, median filtering facilitates more precise and reliable processing of ECG signals, providing clearer signal quality for clinical diagnosis.
ECG Signal Denoising
Factors such as poor electrode contact, muscle movement, and respiration not only cause baseline drift or fluctuation, but also introduce noise interference. After denoising, the morphological features of ECG signals (such as QRS complexes and R peaks) are more easily and accurately detected, aiding physicians in assessing cardiac health status.
Wavelet transform is a method used for signal analysis, capable of simultaneously localizing signal features in time, space, and frequency domains. By decomposing the signal and utilizing processes of expansion and translation, wavelet transform can describe the time-frequency characteristics of signals in greater detail. In the processing of ECG signals, appropriate wavelet basis functions can be selected to decompose the signal, yielding coefficients at different scales, where large amplitudes represent the signal and small amplitudes represent noise. Through threshold processing to remove noise coefficients, decomposition into high and low-frequency sub bands, and multi-level decomposition to reconstruct the signal, denoising and analysis are achieved.
In this study, we employed the widely used Discrete Wavelet Transform (DWT) method. DWT applies wavelet functions to the signal in a discrete manner, sampling its frequency and position, thereby enabling signal decomposition and reconstruction. To begin with, we sample and discretize the continuous wavelet basis functions to obtain discrete wavelet basis functions. We then use scale transformations to perform scaling and translation on the wavelet transform. The formula for scale transformation can be mathematically expressed as:
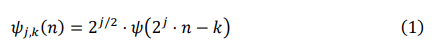
where n denotes the time index, k controls the translation, and j controls the scale of the wavelet basis function. The term ψ(2j. n-k) reflects the translation of the wavelet basis function in the time domain. The coefficient 2j\2) ensures that the energy of the wavelet basis function remains constant during scale transformation, accommodating the analysis needs at different scales. Therefore, ψj,k (n) represents the value of the wavelet basis function at discrete time index n under scale j and translation k.
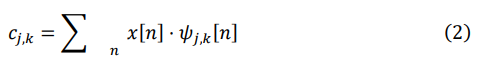
To capture features of the signal at different scales, we decompose the signal using wavelet basis functions of various scales. This decomposition process involves convolving the discrete signal x[n] with the scaled wavelet basis functions ψj,k [n] to obtain the decomposition coefficients cj,k. Mathematically, this process can be expressed as:
After decomposing the signal, we perform soft thresholding on the wavelet coefficients at each scale to remove noise while retaining the main features of the signal. The thresholding process is implemented by comparing the wavelet coefficients with a predetermined threshold λ. The calculation of the threshold λ considers the signal length N and is adaptively adjusted based on the median of the wavelet coefficients. The specific formula is:
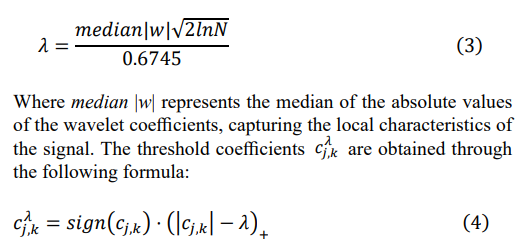
Here, sign(cj,k ) is a sign function that preserves the sign of the wavelet decomposition coefficients cj,k. The term (|cj,k| - λ)+ is a non-negative function ensuring that the processed coefficients remain non-negative. This process effectively removes the noise components in the signal while maximally retaining its main characteristics, thereby achieving a more precise analysis of the signal in the time-frequency domain.
R Peak Detection and Beat Separation
In ECG analysis, due to the intermittent nature of abnormal cardiac rhythms and the fact that not all cardiac cycles exhibit abnormal features, the analysis should focus on individual heartbeat cycles. We accurately locate and segment continuous heartbeat segments in the preprocessed signal, and analyze the rhythm type for each independent heartbeat.
Clinically, the RR interval is the time interval between two consecutive heartbeats and serves as an indicator of ventricular pulsation frequency [30]. The measurement of this interval reflects the rhythm and rate of the heart and is crucial for the analysis of arrhythmias. By using the RR interval as a reference to segment heartbeats, we ensure that each heartbeat cycle is fully analyzed, thereby improving the accuracy and reliability of diagnosis. The R-wave, as the most easily identifiable waveform in a heartbeat, has distinct amplitude and morphological features, making it an ideal reference point for locating heartbeat cycles.By accurately identifying the position of the R-wave, a fixed number of data points are extracted to represent a complete heartbeat cycle. In this experiment, we extract 99 points forward from the R-wave position and 201 points backward, forming a heartbeat sample containing 300 data points.
ECG Classification Model
In this study, as illustrated in Figure 2, we propose a multi-channel model for arrhythmia classification, integrating CNN-LSTM with Transformer, to achieve comprehensive extraction of local and global features from ECG signals. The CNN-LSTM module focuses on extracting relevant features from the ECG signals and understanding the temporal dependencies and correlations in the data, while the Transformer module highlights important features globally through attention mechanisms. This design allows the model to simultaneously capture the spatiotemporal information and dynamic changes in the ECG signals, thereby improving the accuracy and robustness of classification.

Figure 2: Weighted Dual-Channel Model Architecture
Extraction of Local Features
The success of CNN in the fields of computer vision and image processing has laid a solid foundation for its application in analyzing time-series data such as electrocardiograms. Through convolution operations, CNN efficiently captures local information in the signal and generates feature maps for the next layer. This method of extracting local information enables the model to focus on key features in the ECG signals while ignoring irrelevant details, thereby improving classification accuracy.
This model consists of three local feature extraction modules combined with an LSTM network to achieve in-depth mining of complex features in ECG signals. Each local feature module includes basic convolutional layers, batch normalization, ReLU activation function, and depth wise separable convolutional layers, whose organic combination enables the model to efficiently and stably extract local features. In each local feature extraction module, the basic convolutional layers are responsible for preliminary feature extraction from the input ECG signals, capturing local information through sliding windows. Subsequently, the batch normalization layer normalizes the output of the convolutional layers, improving the stability and convergence speed of the model. The introduction of the ReLU activation function further enhances the model's nonlinear expression capability. Depth wise separable convolution, as the core component of this module, offers significant advantages [31]. By decomposing standard convolution into depth wise convolution and pointwise convolution steps, it greatly reduces the number of parameters in the model, lowers computational complexity, and maintains high feature extraction capability. The formula for depth wise separable convolution is as follows:
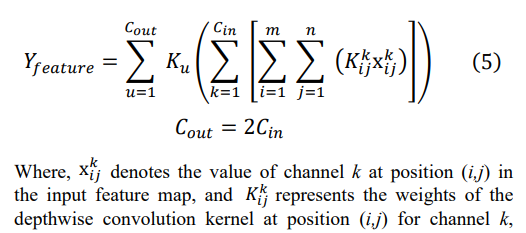
corresponding to channel u. Firstly, the input feature maps are convolved channel-wise using convolutional kernels of size 3x1, maintaining the same number of channels in the input. After performing depth wise convolution based on the input channels, we obtain a collection of feature maps with the same number of channels as the input. Subsequently, these feature maps are fused using pointwise convolution, the output channel number is set to twice the input channel number, aiming to enhance feature diversity and richness by increasing the number of channels, thereby improving the model's expressive power. Each additional channel can learn and extract different types of feature information, enabling the model to have a deeper understanding of the input data. This lightweight convolution design not only ensures model performance but also greatly simplifies the training and deployment process.
Meanwhile, to fully utilize the information in the original input signal, the model also incorporates the idea of residual networks, where the feature maps obtained through max pooling are added to the feature maps obtained through depth wise separable convolution. The specific operation is as follows:

This operation enriches the diversity of features, aiding the model in learning more information and alleviating the problem of gradient vanishing in deep networks. By repeating three such localized feature extraction modules, the model gradually extracts more diverse and richer local features. As the network depth increases, the number of filters and kernel sizes also gradually increase to adapt to more complex feature patterns.
Subsequently, we directly utilize the extracted features as input and feed them into an LSTM network for sequence modeling,enhancing the model's memory processing capabilities for ECG signal sequences. Compared to traditional RNNs, LSTM demonstrates outstanding ability in modeling long-term dependencies, effectively overcoming the limitations of RNNs in maintaining long-term memory. After processing through LSTM, we obtain a feature map containing local feature information, which is used for the subsequent four-class classification task.
Extraction of Global Features
When processing long sequential data, CNNs often struggle to effectively capture dependencies between distant elements due to the locality of convolution operations. In contrast, Transformers leverage self-attention mechanisms to directly compute dependencies between any two positions, enabling better capture of long-range dependencies [32]. In this section,we employ the encoder part of the Transformer model, allowing the bidirectional attention mechanism to better learn the global features of ECG signals.
In this phase, we first convert discrete ECG signal features into continuous vector representations to finely characterize the similarities and differences between features. Subsequently, we introduce positional encoding to provide unique identifiers for each position in the ECG signal, enabling the model to distinguish different positions of ECG waveforms and fully utilize positional information. This transformation and encoding process enhance the model's ability to capture complex relationships in ECG signals, aiding in more accurately capturing key features and improving the accuracy of ECG signal classification. Next, we adopt a multi-head self-attention mechanism to capture long- term dependencies and important features in ECG signals. The multi-head self-attention mechanism calculates the correlations between each position in the input sequence and all other positions, comprehensively considering variations in ECG signals and identifying dependencies. Specifically, the calculation formula for the multi-head self-attention layer is as follows:
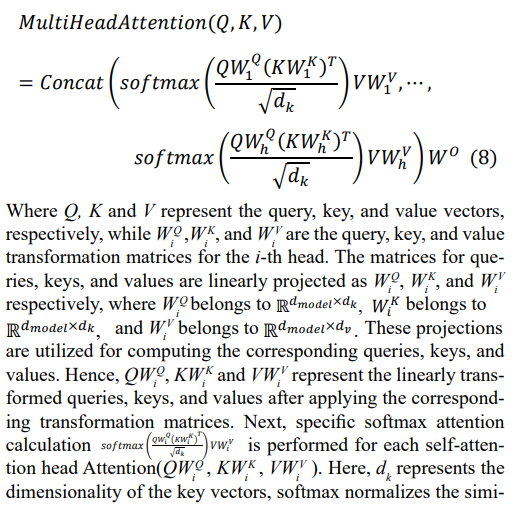
larity scores, computing the weights for each key vector, which are then multiplied with the corresponding value vectors V, and finally weighted by WV to obtain the output for the i-th head. By concatenating the outputs from multiple heads and multiplying by the output weight matrix WO, the final feature representation is obtained. This multi-head design allows the model to learn different attention weights in different subspaces, thereby com- prehensively capturing key information in the ECG signals.
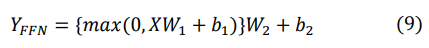
Additionally, the model utilizes feed-forward network layers to further transform the output from the previous layer and learn deep feature representations of ECG signals. Through two fully connected layers and ReLU activation functions in the feed- forward network, the model can learn more complex and abstract features. The structure of the feed-forward network layers is as follows:
Finally, we adopted a residual connection approach different from the original model to concatenate the aforementioned modules. Specifically, we placed layer normalization in the middle of the residual connection, rather than traditionally after the skip connections. This design helps stabilize the training process. Through layer normalization, we normalize the output of each layer to ensure consistent distribution of input data, thereby accelerating the convergence speed of the model and enhancing its performance. The specific formula for extracting the global model is as follows:
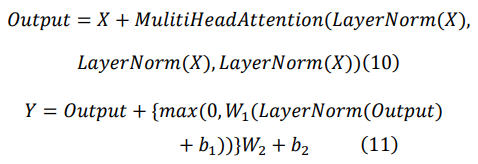
The transformer,with its distinctive self attention Mechanicism,effectively integrates different parts of the sequence, generating a feature representation imbued with rich contextual information. Through this model, we obtain a feature vector that comprehensively captures the global information in the input data.
Feature Fusion and Classification
After training both models, we obtained local and global features, and the next step is feature fusion. Despite the Transformer's excellent performance in capturing long-distance information, the CNN's ability to extract local features is crucial in abnormal classification tasks for electrocardiogram (ECG) signals. Specific waveform patterns in ECG signals, such as P waves and QRS complexes, are essential diagnostic criteria, and CNNs, with their convolutional operations, excel at precisely extracting these features, giving them an advantage in ECG signal processing. Therefore, in the feature fusion stage, given CNNs' excellent capability in extracting local features from ECG signals, we decided to experimentally determine the optimal weight distribution between local and global features. By assigning different weight factors to the local features, we conducted experiments on the ECG dataset and recorded changes in classification accuracy.
As shown in Figure 3, when the weight factor for local feature signals was set to 0.9, a significant inflection points in classification accuracy occurred. Prior to this point, classification accuracy gradually increased with an increase in the proportion of local feature weight; however, thereafter, classification accuracy began to exhibit a declining trend. Hence, based on the analysis and comparison of experimental results, we ultimately determined that, in the task of abnormal classification of ECG signals, the optimal weight factor for local features is 0.9. This weight factor setting not only fully considers CNNs' advantages in local feature extraction but also ensures the effective fusion of global features in the model, thereby enhancing the overall classification performance.

Figure 3: Accuracy Under Different Localized Feature Weight Ratios
Based on the above analysis, we adopt a 9:10 weight ratio to perform weighted fusion of local and global features, thereby generating a feature vector that integrates information from both. This feature vector encompasses both the subtle local variations in ECG signals and reflects their global trends and correlations. Finally, this feature vector undergoes processing through two fully connected layers to accomplish the output of the classification task.
Weighted Loss Function
In handling the task of classifying cardiac arrhythmias, data imbalance is a common issue. Although data augmentation is a commonly used solution, it may lead to several issues when dealing with electrocardiogram signals. Firstly, augmented data may not accurately reflect the diversity and complexity of signals in clinical environments. Secondly, augmentation may introduce additional noise and artifacts, thereby disrupting model training. Additionally, excessive reliance on augmented data may render the model insensitive to subtle variations in real data. Therefore, in this study, we chose to directly utilize imbalanced data and mitigate the issue of data imbalance by employing a weighted cross-entropy loss function to better adapt to real clinical environments. The core idea of this approach is to weight the loss for different classes, increasing the contribution of loss for sparse classes, thereby enhancing the model's ability to classify rare sample classes. The calculation formula is as follows:
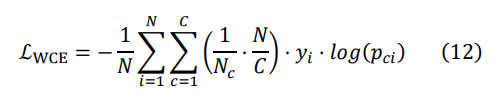
Wherein, N denotes the total number of samples, C represents the total number of classes, Nc stands for the number of samples in class c, yi denotes the true label of sample i, pci signifies the predicted class of sample i, pci and ![]() denotes the weight foreach class. Specifically, we compute a corresponding weight coefficient for each class based on its sample quantity and multiply it by the loss for that class. Thus, classes with a larger proportion have a smaller weight in the loss calculation, thereby achieving balanced treatment of imbalanced data.
denotes the weight foreach class. Specifically, we compute a corresponding weight coefficient for each class based on its sample quantity and multiply it by the loss for that class. Thus, classes with a larger proportion have a smaller weight in the loss calculation, thereby achieving balanced treatment of imbalanced data.
Model Structure and Hyperparameters
The experiment rigorously employed a ten-fold cross-validation strategy to ensure the reliability of model training and testing results. In each fold, the dataset was divided into a 70% training set and a 30% test set, and trained for 10 epochs to thoroughly evaluate the model's performance. During model training, Conv1D operations were utilized with a stride set to 1 to effectively extract local features from the ECG signals. Setting the attention heads to 8 was based on various experiments demonstrating that increasing the number of attention heads helps to learn more information. Additionally, the batch size was set to 128 to stabilize the model and facilitate convergence during training through mini-batch training. To optimize model parameter updates, the Adam optimizer was chosen, which dynamically adjusts the learning rate based on gradient magnitudes and past gradient information to accelerate training and improve model performance. To prevent overfitting during training, a dropout value of 0.2 was set. This strategy balances model complexity while enhancing its generalization ability, ensuring good performance even on unseen data. Detailed hyperparameters are listed in Table 1.
|
Hyperparameter |
Value |
Notation |
Meaning |
|
Batch size |
128 |
- |
Number of samples fed into model each time |
|
Epochs |
100 |
- |
Number of times the entire dataset is used for training |
|
Model dimension |
128 |
dmodel |
Embedding output size & dimensions of Q, K, V |
|
Attention heads |
8 |
dh |
Number of heads in each multi-head module |
|
Dropout rate |
0.2 |
- |
Fraction of Neurons ignored to prevent overfitting |
Table 1: The Values of Model Hyperparameters
Results
Arrhythmia Database
Thedataset used in this study is the MIT-BIHArrhythmia Database. In the field of arrhythmia research, the MIT-BIH Arrhythmia Database provides a crucial dataset consisting of 48 complete annotated half-hour two-lead dynamic electrocardiogram (ECG) recordings. These recordings, meticulously annotated and validated, encompass not only normal cardiac rhythms but also various types of arrhythmias such as ventricular premature beats, atrial premature beats, ventricular fibrillation, and atrial fibrillation. The database involves 47 subjects and includes 48 ECG recordings, divided into two categories: one comprising 23 records of common ECG patterns numbered 100 to 124, and the other comprising 25 records of clinically uncommon arrhythmia types numbered 200 to 234. The two-lead ECG recordings consist of MLII (Modified Limb Lead II) and chest leads. The MLII lead was chosen for analysis in this study due to its ability to provide a clear view of cardiac electrical activity, especially the P wave, which is crucial for diagnosing sinus rhythm. Additionally, the MLII lead demonstrates excellent performance in reducing signal interference during motion, making it suitable for analyzing arrhythmias.
In the ECG analysis research, we excluded four signals (102, 104, 107, 217) from the database due to poor signal quality that prevented further processing of beats. To maintain standardization of data from different patients during feature extraction and classification, this study adopted the standards of the American Association for Medical Instrumentation (AAMI) to categorize arrhythmias into four classes. As the Q class (Unclassified beat) data lacks clear clinical significance, it was disregarded in this study. Table 2 provides detailed information on the different types of heartbeats recorded in the MIT-BIH Arrhythmia Database and the number of ECG signals for each type after heartbeat segmentation.
|
Heartbeat type |
Annotations |
Name |
Abbreviated |
Number of raw ECG |
|
Normal (N) |
Normal beat |
NOR |
N |
86915 |
|
Left bundle block beat |
LBBB |
L |
|
|
|
Right bundle block beat |
RBBB |
R |
|
|
|
Nodal (junctional)escape beat |
NE |
j |
|
|
|
Atrial escape beats |
AE |
e |
|
|
|
Supraventricular (S) |
Atrial premature beat |
AP |
A |
2379 |
|
Aberrated atrial premature beat |
aAP |
a |
|
|
|
Nodal(junctional) premature beat |
NP |
J |
|
|
|
Supraventricular premature beat |
SP |
S |
|
|
|
Ventricular (V) |
Premature ventricular contraction |
PVC |
V |
6973 |
|
Ventricular escape beat |
VE |
E |
|
|
|
Fusion (F) |
Fusion of ventricular and normal beat |
Fvn |
F |
801 |
Table 2: AAMI Standard Classification and Number of Heartbeats
Experimental Platform and Evaluation Indicators
The experiments in this study were conducted using the Python 3.9 programming language and the PyTorch deep learning framework. The operating system of the experimental equipment was Linux, with an RTX4090 graphics card and 11GB of memory.
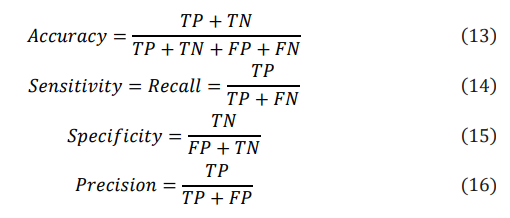
In multiclass classification, evaluating model performance typically involves metrics such as accuracy (the proportion of correctly predicted instances), sensitivity (the rate of correctly identifying positive samples), precision (the proportion of true positive predictions among all positive predictions), and specificity (the proportion of correctly identified negative samples). This study employed the metrics of average precision, recall, specificity, precision, and macro F1-score to assess classification performance. The specific formulas for calculating these metrics are as follows:
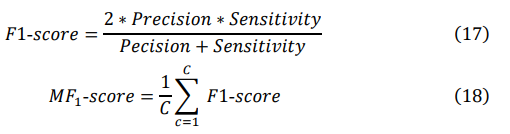
The F1 score, which simultaneously considers both precision and recall, is a key metric for evaluating model performance. The macro F1 score (MF1) is particularly suitable for imbalanced datasets, as it ensures that each class contributes equally to the final F1 score. These metrics help us to comprehensively understand the model's performance. The specific formula is as follows, where C represents the number of classes:
Experiment results
ECG Signal Preprocessing
In processing the raw electrocardiogram (ECG) data from the MIT-BIH Arrhythmia Database, the primary task is preprocessing to eliminate baseline drift and noise. As shown in Figure 4(a), the original signal can be observed through a window simulation of the waveform using the first 3000 sampling points. Taking the ECG signal from record 121 in the dataset as an example, the results after denoising and baseline drift correction are demonstrated. It can be observed from Figure 4(b) that the issue of baseline drift is effectively addressed, while Figure 4(c) clearly illustrates that the denoised ECG signal becomes smoother, significantly enhancing the quality of the ECG signal data. Following preprocessing, the next step is heartbeat segmentation. This step is crucial as it allows us to separate individual heartbeats from continuous ECG records, providing a clear starting point for further analysis. The accuracy of heartbeat segmentation directly affects the subsequent identification and classification of arrhythmias.

Figure 4: Comparison of Electrocardiograms Before and After Processing
ECG Classification
Through the implementation of 10-fold cross-validation, we systematically monitored the performance of the proposed model during the training process. As shown in Figure 5, as training progresses, the model's loss rate gradually approaches zero, while the accuracy remains stable at a high level close to 1. This result indicates that our model demonstrates excellent learning capability during the training process.

Figure 5: Graph of Accuracy and Loss Rate of the Proposed Model
The analysis of model performance indicates that the model exhibits high accuracy in identifying various categories of arrhythmias. Table 3 provides detailed numerical values of the model's precision, sensitivity, specificity, precision, and F1 scores for each category on the MIT-BIH dataset. Of particular note is the exceptional performance for class N, with all metrics approaching 100%. This is primarily attributed to the abundance of class N samples, allowing the model to effectively learn and accurately identify this type of arrhythmia. For class V, the model also demonstrates high precision, reaching 98.17%, confirming the model's capability in capturing and distinguishing complex ventricular arrhythmias. Although class S maintains precision above 98%, its sensitivity and specificity are relatively lower. This could be attributed to the inclusion of various subtypes of supraventricular arrhythmias in class S, coupled with a relatively limited dataset, posing challenges for the model in distinguishing these subtypes. However, class F exhibits the poorest performance across all metrics, primarily due to the scarcity of relevant data. Improving the classification performance of class F, particularly in the context of limited data, will be a focal point of our future research efforts.
|
Classification |
Evaluation parameters |
Heartbeat type |
|||
|
N |
S |
V |
F |
||
|
Proposed model |
Accuracy/% |
99.48 |
98.08 |
98.17 |
92.71 |
|
Specificity/% |
99.87 |
91.03 |
97.06 |
84.36 |
|
|
Sensitivity/% |
99.87 |
91.05 |
97.08 |
84.37 |
|
|
Precision/% |
99.48 |
98.08 |
98.18 |
92.72 |
|
|
F1-score/% |
99.68 |
93.87 |
97.56 |
87.75 |
|
Table 3: Experiment Results of CNN-LSTM Classification
Discussion
Comparative Study
The proposed multi-channel weighted fusion-based ECG classification model achieves efficient classification of ECG data under the AAMI standard. Comparative analysis with previous models demonstrates significant advantages in accuracy, F1 score, sensitivity, specificity, and overall accuracy. In terms of performance metrics, compared to state-of-the-art baseline methods, our model outperforms with an accuracy of 99.33% and an MF1 score of 94.71%.
In existing research which shows in Table 4, apart from four references, most studies have developed models based on CNN frameworks, achieving accuracies generally exceeding 99% [33- 36]. This underscores the critical role of convolutional networks in ECG classification tasks. Reference, which integrates CNN with LSTM, demonstrates impressive performance with an accuracy of 99.32% and precision reaching 99.51% [37]. However, in other metrics such as sensitivity and specificity, its performance is relatively weaker, with sensitivity and specificity lower by 1.58% and 1.13%, respectively, compared to our proposed model. Reference, combining CNN, attention mechanisms,and LSTM, though exhibiting similar MF1 scores, falls slightly short compared to our model [38]. Compared to the latest (2024) research, our model also demonstrates significant advantages in comparison. Compared to Islam et al.'s study, although their method similarly integrates CNN with Transformer structures, our multi-channel learning feature approach is superior, with an increase in accuracy by 0.19% and an improvement in the MF1 score by 0.02% [39]. While Ghaish et al.'s study innovates based on Transformer, achieving higher accuracy than our results, both their sensitivity and specificity scores are slightly lower than ours by 0.45% [40]. Overall, our proposed model has achieved significant improvements in sensitivity and macro-F1 scores compared to previous models from past years. This indicates that the model can more accurately identify true disease patients in clinical practice and perform excellently in multi-class classification tasks. This fully demonstrates the potential and value of the new model in medical clinical applications.
|
Study |
Year |
Techniques |
Evaluation method |
Overall Acc (%) |
Recall (%) |
Sp (%) |
Pre (%) |
MF1 (%) |
|
Chen et al [37] |
2020 |
CNN-LSTM |
5-fold |
99.32 |
97.75 |
97.66 |
99.51 |
- |
|
Hammad et al., [33] |
2020 |
DL + GA + KNN |
5-fold |
98.00 |
94.10 |
98.65 |
86.55 |
89.70 |
|
Essa et al., [34] |
2021 |
CNN-LSTM + RRHOS-LSTM |
- |
95.81 |
69.20 |
94.56 |
74.97 |
71.06 |
|
Petmezas et al., [41] |
2021 |
CNN-LSTM |
10-fold |
- |
97.87 |
99.29 |
- |
- |
|
Kim et al., [38] |
2022 |
ResNet+ SE block + biLSTM |
5-fold |
99.20 |
91.23 |
99.82 |
92.23 |
91.69 |
|
Pokaprakarn et al., [35] |
2022 |
Seq2Seq + CRNN |
5-fold |
97.60 |
- |
- |
- |
89.00 |
|
Zhao et al., [36] |
2023 |
Attention-based TCN |
80% training and validation + 20% testing |
87.81 |
91.85 |
- |
89.81 |
89.46 |
|
training and validation + 20% testing |
87.81 |
91.85 |
- |
89.81 |
89.46 |
|
|
|
|
Ahmed et al., [42] |
2023 |
CNN |
75% training and validation + 25% testing |
99.0 |
94.0 |
99.0 |
93.0 |
93.0 |
|
Islam et al., [39] |
2024 |
CNN+ Attention+ Transformer |
80% training + 20% testing |
99.14 |
99.14 |
99.14 |
- |
94.69 |
|
H. El-Ghaish and E. Eldele [40] |
2024 |
MSC + CRM + BiTrans + CAL |
80% training + 20% testing |
99.35 |
- |
- |
- |
94.26 |
|
Ours |
2024 |
Proposed model |
10-fold |
99.33 |
99.33 |
98.79 |
99.30 |
94.71 |
Table 4: Comparison of our Method to Results Published in the Literature
Ablation Study
To delve into the contributions of each module within the framework to the model's performance, we designed and conducted an ablation study, the results of which are detailed in Table 5. Firstly, we tested the performance of the transformer and the proposed CNN model independently. The results indicate that the transformer model's performance across all metrics was unsatisfactory, with an MF1 value of only 64.63%. In contrast, the MF1 value reached 92.11% when using the CNN model alone. This stark contrast fully demonstrates the superiority of convolutional neural networks in ECG signal classification tasks, highlighting their powerful capabilities in feature extraction and classification.
Furthermore, we introduced the LSTM model to explore its role in improving classification performance. The introduction of LSTM significantly enhanced the model's ability to process temporal information, which is crucial for data with continuity and temporal characteristics like ECG signals. As a result, all metrics saw significant improvements, with values exceeding 99% except for MF1. Building upon this, we proposed an ensemble model aiming to combine the advantages of each module for better performance. Experimental results showed that compared to the standalone CNN model, the dual-channel weighted model saw improvements of 2.6% and 0.43% in MF1 and accuracy, respectively. Similarly, compared to the CNN-LSTM model, the dual-channel weighted model saw improvements of 2.11% and 0.28% in MF1 and accuracy, respectively. This significant performance enhancement is mainly attributed to the ensemble model's ability to fully utilize global information, thereby effectively enhancing cross-class classification capabilities. Compared to the dual-channel model, the introduction of a weighted mechanism resulted in a 0.02% increase in accuracy and a 0.17% improvement in MF1, demonstrating the necessity of weighting the channels for local feature extraction.
|
Model Type |
Overall Acc (%) |
Recall (%) |
Pre (%) |
F1 (%) |
MF1 (%) |
|
Transformer |
94.18 |
94.19 |
93.27 |
93.53 |
64.63 |
|
CNN |
98.90 |
98.90 |
98.88 |
98.85 |
92.11 |
|
CNN-LSTM |
99.05 |
99.05 |
99.05 |
99.03 |
92.60 |
|
Proposed model w/o weighted |
99.31 |
99.31 |
99.28 |
99.27 |
94.44 |
|
Proposed model |
99.33 |
99.33 |
99.30 |
99.29 |
94.71 |
Table 5: Performance Table for Model Ablation Experiments
Conclusions
This study proposes an efficient framework for automatic heartbeat classification, capable of accurately identifying four types of arrhythmic heartbeat patterns from the MIT-BIH Arrhythmia Database. The framework innovatively combines a dual-channel learning approach, integrating CNN-LSTM for local feature extraction and Transformer architecture for global feature extraction, thereby constructing an integrated and robust model. Through comparative experiments, the model achieves satisfactory results across various evaluation metrics including overall accuracy, F1 score, sensitivity, positive predictive value, and specificity, highlighting the superiority of the proposed method. Additionally, the model demonstrates excellent classification performance and rapid diagnostic speed, making it particularly suitable for applications in wearable ECG devices. However, we acknowledge that the model still has certain limitations. Firstly, the current model has not addressed the class imbalance issue, which limits further improvements in accuracy. Therefore, future research should focus on exploring effective methods to address class imbalance. Secondly, the present study mainly relies on the MIT-BIH Arrhythmia Database, which is relatively limited in diversity. To enhance the accuracy and generalization ability of the model, efforts should be made to expand the dataset scope, incorporating more diverse data sources, and exploring potential performance improvement measures.
Acknowledgement
Anhui Natural Science Foundation: Fault Diagnosis Research in Uncertain Environment under the Background of Industry 4.0 [Grant Number: KJ2021A0866]; National Natural Science Foundation of China [Grant Number: 82072228]; Natural General Research Project Fund of Shanghai University of Medicine & Health Sciences: Prediction of pediatrid septic shock in ICU combined with multiple source uncertainty and Bayesian Network (Grant Number: A1-0200-24-201009-5); Foundation of the Program of shanghai Academic Technology Research Leader under the Science and Technology Innovation Action Plan [Grant Number: 22XD1401300]; 5.National Natural Science Foundation of China [Grant Number: 62376152].
Author Contributions
Jiaqi Li: Writing-original draft, Data Curation, Software, Methodology, Investigation, Funding acquisition, Formal analysis, Conceptualization;
Zhiping Fan: Review & Editing, Supervision, Funding acquisition, Project administration;
Yuxin Hou: Data Curation, Formal analysis, Methodology, Investigation, Software;
Zi Zeng: Resources, Data Curation, Formal analysis, Methodology;
Gang Lv: Resources, Visualization;
Jiaqi Li: Review & Editing, Project administration, Funding acquisition;
Liang Zhou: Review & Editing , Supervision, Funding acquisition;
Tao Wu: Review & Editing, Project administration, Funding acquisition;
Qing Cao: Conceptualization, Methodology, Validation, Review & Editing, Project administration, Funding acquisition; All authors had the final responsibility to submit for publication.
Data Sharing Statement
To protect participant privacy, the raw data used in this study are not publicly available. However, the data generated and/ or analyzed during the study can be requested from the corresponding author.
Acknowledgments
The computations in this paper were performed on the ASTRA cluster supported by the Big-data platform of National Research Center for Translational Medicine at Shanghai.
References
- Antzelevitch, C., & Burashnikov, A. (2011). Overview of basic mechanisms of cardiac arrhythmia. Cardiac electrophysiology clinics, 3(1), 23-45.
- Hoffman, B. F., & Rosen, M. R. (1981). Cellular mechanismsfor cardiac arrhythmias. Circulation research, 49(1), 1-15.
- Fu, D. G. (2015). Cardiac arrhythmias: diagnosis, symptoms, and treatments. Cell biochemistry and biophysics, 73(2), 291-296.
- Wit, A. L., & Rosen, M. R. (1983). Pathophysiologic mechanisms of cardiac arrhythmias. American heart journal, 106(4), 798-811.
- Chatterjee, S., Thakur, R. S., Yadav, R. N., Gupta, L., & Raghuvanshi, D. K. (2020). Review of noise removal techniques in ECG signals. IET Signal Processing, 14(9), 569-590.
- Gopinathannair, R., Etheridge, S. P., Marchlinski, F. E.,Spinale, F. G., Lakkireddy, D., & Olshansky, B. (2015). Arrhythmia-induced cardiomyopathies: mechanisms, recognition, and management. Journal of the American College of Cardiology, 66(15), 1714-1728.
- Rienstra, M., Lubitz, S. A., Mahida, S., Magnani, J. W.,Fontes, J. D., Sinner, M. F., ... & Benjamin, E. J. (2012). Symptoms and functional status of patients with atrial fibrillation: state of the art and future research opportunities. Circulation, 125(23), 2933-2943.
- Ribeiro, A. H., Ribeiro, M. H., Paixão, G. M., Oliveira, D. M., Gomes, P. R., Canazart, J. A., ... & Ribeiro, A. L. P. (2020). Automatic diagnosis of the 12-lead ECG using a deep neural network. Nature communications, 11(1), 1760.
- Maron, B. J., Friedman, R. A., Kligfield, P., Levine, B. D., Viskin, S., Chaitman, B. R., ... & Council on Quality of Care and Outcomes Research, and American College of Cardiology. (2014). Assessment of the 12-Lead electrocardiogram as a screening test for detection of cardiovascular disease in healthy general populations of young people (12–25 years of age) a scientific statement from the American Heart Association and the American College of Cardiology. Journal of the American College of Cardiology, 64(14), 1479-1514.
- Schlegel, T. T., Kulecz, W. B., Feiveson, A. H., Greco,E. C., DePalma, J. L., Starc, V., ... & Pahlm, O. (2010). Accuracy of advanced versus strictly conventional 12-lead ECG for detection and screening of coronary artery disease, left ventricular hypertrophy and left ventricular systolic dysfunction. BMC cardiovascular disorders, 10, 1-11.
- Niu, Y., Wang, H., Wang, H., Zhang, H., Jin, Z., & Guo,Y. (2023). Diagnostic validation of smart wearable device embedded with single-lead electrocardiogram for arrhythmia detection. Digital Health, 9, 20552076231198682.
- Khunte, A., Sangha, V., Oikonomou, E. K., Dhingra, L. S., Aminorroaya, A., Mortazavi, B. J., ... & Khera, R. (2023). Detection of left ventricular systolic dysfunction from single-lead electrocardiography adapted for portable and wearable devices. npj Digital Medicine, 6(1), 124.
- Teijeiro, T., García, C. A., Castro, D., & Félix, P. (2017, September). Arrhythmia classification from the abductive interpretation of short single-lead ECG records. In 2017 Computing in cardiology (cinc) (pp. 1-4). IEEE.
- Mathews, S. M., Kambhamettu, C., & Barner, K. E. (2018). A novel application of deep learning for single-lead ECG classification. Computers in biology and medicine, 99, 53- 62.
- Xiong, Z., Nash, M. P., Cheng, E., Fedorov, V. V., Stiles,M. K., & Zhao, J. (2018). ECG signal classification for the detection of cardiac arrhythmias using a convolutional recurrent neural network. Physiological measurement, 39(9), 094006.
- Fotiadou, E., & Vullings, R. (2020). Multi-channel fetal ECG denoising with deep convolutional neural networks. Frontiers in Pediatrics, 8, 508.
- Ehiabhi, J., & Wang, H. (2023). A systematic review of machine learning models in mental health analysis based on multi-channel multi-modal biometric signals. BioMedInformatics, 3(1), 193-219.
- Ji, X., Li, Y., & Wen, P. (2023). 3DSleepNet: A multi- channel bio-signal based sleep stages classification method using deep learning. IEEE Transactions on Neural Systems and Rehabilitation Engineering.
- Kiranyaz, S., Ince, T., & Gabbouj, M. (2015). Real-time patient-specific ECG classification by 1-D convolutional neural networks. IEEE transactions on biomedical engineering, 63(3), 664-675.
- Acharya, U. R., Oh, S. L., Hagiwara, Y., Tan, J. H., Adam, M., Gertych, A., & San Tan, R. (2017). A deep convolutional neural network model to classify heartbeats. Computers in biology and medicine, 89, 389-396.
- Mathunjwa, B. M., Lin, Y. T., Lin, C. H., Abbod, M. F., Sadrawi, M., & Shieh, J. S. (2022). ECG recurrence plot- based arrhythmia classification using two-dimensional deep residual CNN features. Sensors, 22(4), 1660.
- Hou, B., Yang, J., Wang, P., & Yan, R. (2019). LSTM-based auto-encoder model for ECG arrhythmias classification. IEEE Transactions on Instrumentation and Measurement, 69(4), 1232-1240.
- Zheng, Z., Chen, Z., Hu, F., Zhu, J., Tang, Q., & Liang,Y. (2020). An automatic diagnosis of arrhythmias using a combination of CNN and LSTM technology. Electronics, 9(1), 121.
- Oh, S. L., Ng, E. Y., San Tan, R., & Acharya, U. R. (2018).Automated diagnosis of arrhythmia using combination of CNN and LSTM techniques with variable length heart beats. Computers in biology and medicine, 102, 278-287.
- Jin, Y., Liu, J., Liu, Y., Qin, C., Li, Z., Xiao, D., ... & Liu,C. (2021). A novel interpretable method based on dual- level attentional deep neural network for actual multilabel arrhythmia detection. IEEE Transactions on Instrumentation and Measurement, 71, 1-11.
- Al-Selwi, S. M., Hassan, M. F., Abdulkadir, S. J., & Muneer,A. (2023). LSTM inefficiency in long-term dependencies regression problems. Journal of Advanced Research in Applied Sciences and Engineering Technology, 30(3), 16- 31.
- Che, C., Zhang, P., Zhu, M., Qu, Y., & Jin, B. (2021).Constrained transformer network for ECG signal processing and arrhythmia classification. BMC Medical Informatics and Decision Making, 21(1), 184.
- Meng, L., Tan, W., Ma, J., Wang, R., Yin, X., & Zhang, Y. (2022). Enhancing dynamic ECG heartbeat classification with lightweight transformer model. Artificial Intelligence in medicine, 124, 102236.
- Hu, R., Chen, J., & Zhou, L. (2022). A transformer- based deep neural network for arrhythmia detection using continuous ECG signals. Computers in Biology and Medicine, 144, 105325.
- Brown, T. E., Beightol, L. A., Koh, J., & Eckberg, D. L. (1993). Important influence of respiration on human RR interval power spectra is largely ignored. Journal of applied physiology, 75(5), 2310-2317.
- Chollet, F. (2017). Xception: Deep learning with depthwise separable convolutions. In Proceedings of the IEEE conference on computer vision and pattern recognition (pp. 1251-1258).
- Vaswani, A., Shazeer, N., Parmar, N., Uszkoreit, J., Jones, L., Gomez, A. N., ... & Polosukhin, I. (2017). Attention is all you need. Advances in neural information processing systems, 30.
- Hammad, M., Iliyasu, A. M., Subasi, A., Ho, E. S., & Abd El-Latif, A. A. (2020). A multitier deep learning model for arrhythmia detection. IEEE Transactions on Instrumentation and Measurement, 70, 1-9.
- Essa, E., & Xie, X. (2021). An ensemble of deep learning- based multi-model for ECG heartbeats arrhythmia classification. ieee access, 9, 103452-103464.
- Pokaprakarn, T., Kitzmiller, R. R., Moorman, R., Lake,D. E., Krishnamurthy, A. K., & Kosorok, M. R. (2021). Sequence to sequence ECG cardiac rhythm classification using convolutional recurrent neural networks. IEEE journal of biomedical and health informatics, 26(2), 572- 580.
- Zhao, Y., Ren, J., Zhang, B., Wu, J., & Lyu, Y. (2023). Anexplainable attention-based TCN heartbeats classification model for arrhythmia detection. Biomedical Signal Processing and Control, 80, 104337.
- Chen, C., Hua, Z., Zhang, R., Liu, G., & Wen, W. (2020).Automated arrhythmia classification based on a combination network of CNN and LSTM. Biomedical Signal Processing and Control, 57, 101819.
- Kim, Y. K., Lee, M., Song, H. S., & Lee, S. W. (2022).Automatic cardiac arrhythmia classification using residual network combined with long short-term memory. IEEE Transactions on Instrumentation and Measurement, 71, 1-17.
- Islam, M. R., Qaraqe, M., Qaraqe, K., & Serpedin, E. (2024). Cat-net: Convolution, attention, and transformer- based network for single-lead ecg arrhythmia classification. Biomedical Signal Processing and Control, 93, 106211.
- El-Ghaish, H., & Eldele, E. (2024). ECGTransForm: Empowering adaptive ECG arrhythmia classification framework with bidirectional transformer. Biomedical Signal Processing and Control, 89, 105714.
- Petmezas, G., Haris, K., Stefanopoulos, L., Kilintzis, V., Tzavelis, A., Rogers, J. A., ... & Maglaveras, N. (2021). Automated atrial fibrillation detection using a hybrid CNN- LSTM network on imbalanced ECG datasets. Biomedical Signal Processing and Control, 63, 102194.
- Ahmed, A. A., Ali, W., Abdullah, T. A., & Malebary, S. J. (2023). Classifying cardiac arrhythmia from ECG signal using 1D CNN deep learning model. Mathematics, 11(3), 562.