
Current Research in Environmental Science and Ecology Letters(CRESEL)
ISSN: 2997-3694 | DOI: 10.33140/CRESEL

Research Article - (2025) Volume 2, Issue 1
Vulnerability of Rural Households to Climate-Induced Shocks: The Case of the Chiro District, Eastern Oromia, Ethiopia
Received Date: Feb 26, 2025 / Accepted Date: Sep 25, 2025 / Published Date: Oct 15, 2025
Copyright: ©Â©2025 Feyera Jira Tesso. This is an open-access article distributed under the terms of the Creative Commons Attribution License, which permits unrestricted use, distribution, and reproduction in any medium, provided the original author and source are credited.
Citation: Tesso, F. J. (2025).Vulnerability of Rural Households to Climate-Induced Shocks: the Case of the Chiro District, Eastern Oromia, Ethiopia. Curr Res Env Sci Eco Letters, 2(1), 01-27.
Abstract
Ethiopia is highly vulnerable to climate change and variability, particularly climate-induced shocks, which exert significant pressure on the livelihoods of rural households that depend on natural resources. The extent of household vulnerability varies based on adaptive capacity, exposure, and sensitivity to climate risks. However, local and context- specific vulnerability assessments remain limited, particularly in the West Hararghe zone and the Chiro district, creating gaps in effective planning and intervention strategies. This study evaluates the vulnerability of rural households to climate change and climate-induced shocks in Chiro district, Eastern Oromia, Ethiopia. A descriptive research design was employed, integrating both quantitative and qualitative approaches. Data was collected from 300 randomly selected households across four kebeles using household surveys, key informant interviews, focus group discussions, and direct observations. The vulnerability assessment framework was based on the Intergovernmental Panel on Climate Change (IPCC) dimensions—exposure, sensitivity, and adaptive capacity—analyzed using the Principal Component Analysis (PCA) method by integrating with the Livelihood Vulnerability Index (LVI). The results indicate that households participating in the Productive Safety Net Program (PSNP) were 4.15% more vulnerable than non-participants due to their lower aggregate adaptive capacity for livelihood assets. Additionally, PSNP households exhibited higher exposure and susceptibility to climate-induced shocks and biophysical stressors. These findings highlight the need for targeted interventions that enhance off-farm and non-farm livelihood opportunities, expand access to credit, and promote gender equality and women’s empowerment to strengthen resilience against climate change.
Keywords
Vulnerability Assessment, Principal Component Analysis, Exposure, Sensitivity, Adaptive Capacity, Livelihood Vulnerability Index, Climate Change, Rural Households, Productive Safety Net Program
Introduction
Climate change refers to long-term shifts in temperature, precipitation, and other atmospheric conditions, attributed directly or indirectly to human activities that alter the composition of the global atmosphere [1]. Recent trends indicate that global surface temperatures have risen more rapidly since 1970 than during any other 50-year period over the past 2000 years, with an observed increase of 0.99°C between 2001 and 2020 compared to pre-industrial levels [2]. Developing countries, particularly those reliant on rainfed agriculture, are highly susceptible to the adverse effects of climate change [2]. The lack of social, economic, and financial resources further exacerbates the vulnerability of African nations, limiting their ability to mitigate and adapt to climate-induced impacts [3]. Ethiopia, with its predominantly rainfed agricultural economy and subsistence farming practices, is among the most climate-vulnerable countries [4]. Limited economic resources, inadequate education, outdated farming technology, and weak infrastructure further constrain household adaptability, exacerbating their susceptibility to climate change [5].
Additionally, biodiversity and socioeconomic factors, including environmental degradation, deforestation, biodiversity loss, and increasing drought frequency, have significantly impacted rural livelihoods [6]. Land mismanagement, low per capita land tenure, and severe soil erosion have further reduced soil fertility, posing a threat to food security and household resilience [7]. In Oromia National Regional State, particularly the West and East Hararghe Zones, climate change effects have manifested in irregular rainfall patterns and rising temperatures, negatively impacting agricultural productivity [8]. Over the past 30 years (1986–2017), the mean minimum and maximum temperatures in these zones were recorded at 12.8°C and 27.2°C, respectively [9]. Similarly, the Chiro district has experienced increasing temperatures and declining rainfall from 1980 to 2010, contributing to severe land degradation, reduced grazing land, and low agricultural yields [10]. Despite the evident impacts, no empirical studies have specifically assessed the vulnerability of rural households in Chiro district to climate change and climate-induced shocks, highlighting the need for localized research.
Existing studies on smallholder farmers’ vulnerability to climate change in Ethiopia have predominantly been conducted at national or regional levels, overlooking local-level disparities in vulnerability [11]. Additionally, spatial analysis in previous research has produced contradictory findings regarding vulnerability patterns. For example, while identified lowland areas as the most vulnerable, reported that highland communities faced greater vulnerability [12,13]. This inconsistency suggests that other underlying factors, including socioeconomic and livelihood characteristics, may influence vulnerability levels. Most prior studies have employed a risk-hazard framework, which primarily focuses on external climatic risks, often neglecting the intrinsic socioeconomic determinants of vulnerability [14]. To address this research gap, this study applied the Principal Component Analysis (PCA) method to assess vulnerability by integrating the IPCC, framework exposure, sensitivity, and adaptive capacity in Chiro district, Eastern Oromia, Ethiopia [15]. By conducting context-specific and data-driven analyses, this study aimed to provide insights for policymakers and stakeholders to develop targeted interventions that enhance the resilience of rural households to climate-induced shocks.
Research Methodology
Description of the Study Area
This study was conducted in Chiro district, located in Eastern Oromia, Ethiopia. The district lies between 8°50'47''N and 9°10'0''N latitude and 40°40'0''E and 41°10'0''E longitude (Figure 1)

Figure 1: Locational Map of the Study Area (Source: Author’s Own Design using ArcMap 10.3)
It covers a total area of 68,314.73 hectares (Chiro Agriculture and Natural Resource Office, 2023). Based on 2021 census data, the district has a population of 245,091 people, comprising 125,498 males and 119,593 females. The altitude of the district ranges from 1,500 to 3,060 meters above sea level, with undulating topography and mountainous terrain. Due to its steep slopes and limited veg- etation cover, Chiro district is highly susceptible to erosion. Key environmental and socioeconomic challenges include drought, water shortages, soil erosion, flooding, scarcity of livestock for- age, and limited livelihood diversification, all of which signifi- cantly threaten food security and sustainable development. The dominant land use system in Chiro district is rainfed agriculture, which combines livestock rearing and crop production [16]. The primary staple crops include maize and sorghum, cultivated main- ly for household consumption under a rainfed system. In addition, cash crops such as khat and vegetables are grown using small- scale irrigation. However, agricultural productivity is constrained by rugged terrain, severe soil erosion, declining soil fertility, and deforestation [16]. Low agricultural yields, coupled with limited access to economic opportunities, contribute to food insecurity, making the district one of the areas supported by the Productive Safety Net Program (PSNP). The district experiences a bimodal and highly variable rainfall pattern. In the highland and midland agroecosystems, the main rainy season occurs from June to Sep- tember, followed by a short rainy season from March to May. In contrast, the lowland areas receive the main rainy season from July to September, with significant fluctuations in rainfall distribution, exacerbating climate-related risks for smallholder farmers.
Research Design
This study employed a descriptive research design incorporating mixed research methods to enhance the reliability and validity of the findings. A quantitative approach was used to collect and an- alyze data related to climate-induced shocks, socioeconomic con- ditions, rainfall, and temperature trends. Meanwhile, qualitative methods were employed to gather insights on household and com- munity perceptions of vulnerability to climate change and vari- ability. The integration of both methods ensured a comprehensive understanding of the subject matter.
Sample Size and Sampling Technique
A multistage sampling technique was adopted in this study. First, Chiro district was purposively selected from the 18 districts of the West Hararghe Zone due to its frequent exposure to climate change-induced shocks. Additionally, the district has been a focus of governmental and non-governmental (NGO) interventions, par- ticularly through the Productive Safety Net Program (PSNP) over the past 18 years. In the second stage, four kebeles—Arba Rekete, Medhicho#2, Saro, and Baka Kubi—were selected using a simple random sampling method.
The sample size was determined using Yamane’s (1967) formula at a 95% confidence level with 5% precision (e):
where n is the sample size,
N is the population size, and
e is the level of precision
Applying this formula, a total of 300 households were selected, consisting of 150 PSNP beneficiaries and 150 non-PSNP households. These households were randomly sampled from the 1,200 households in the selected kebeles to ensure a representative dataset for analysis.
Data Sources and Collection Methods
This study utilized both primary and secondary data sources. Pri- mary data was gathered through focus group discussions (FGDs) and structured questionnaires, which were pre-tested before use. The questionnaires were designed to collect information on the socio-economic, biophysical, and institutional aspects of the study area, with household surveys serving as the main data collection method. A literature review was conducted to identify key com- ponents and sub-components relevant to vulnerability, ensuring alignment with the local context. Based on this review, survey questions were formulated to capture data on the forty-nine indi- cators used to calculate the Livelihood Vulnerability Index (LVI). Additional details on these sections are provided in annexed Table 1- Table 3.
The study population included household heads and district ex- perts from the selected districts. The survey was conducted in Af- aan Oromo, the local language, to facilitate better communication. Enumerators with relevant experience and language proficiency were trained to administer the survey. Prior to data collection, the questionnaire was reviewed to clarify any ambiguities. The data collection process took place between October 2022 and Decem- ber 2022. Participants were required to sign consent forms before responding to the questionnaire or participating in interviews, en- suring ethical research practices. In addition to surveys, monthly time-series data on temperature and precipitation were obtained from the Ethiopian Meteorology Agency, covering the period from 1980 to 2021. A dataset spanning 42 years was used to an- alyze climate trends and assess the community’s vulnerability to climate-related shocks. Specific time-series data representing the Chiro district were extracted to provide localized insights. Further- more, four FGDs were conducted in each selected kebele, with each group consisting of 6 to 9 members, resulting in a total of 32 participants across all kebeles. The discussions included religious leaders, local community leaders, women’s representatives, and youth. The author facilitated each FGD using a guided checklist. Additionally, key informant interviews were conducted with de- velopment agents, food security officials, CARE staff, and natural resource management experts. Both FGDs and key informant in- terviews followed a structured format, using pre-prepared ques- tions and checklists. Field visits were also carried out to evaluate natural resource conditions and infrastructure availability within the study area.
Methods of Data Analysis
The Livelihood Vulnerability Index (LVI), along with the IP- CC-LVI, was used to evaluate the climate vulnerability of rural households depended on Ethiopia Productive safety net program (PSNP) in the Chiro district of Eastern Oromia, Ethiopia. The IPCC definition of livelihood vulnerability guided the calculation of LVI-IPCC. Microsoft Office Excel 2010 was utilized to esti- mate the LVI and create both the vulnerability spider chart and vulnerability triangle. The collected data was examined using both qualitative and quantitative approaches. The quantitative analysis, conducted with SPSS v23.0, evaluated 49 indicators. By integrat- ing these methods, a more comprehensive insight into livelihood vulnerability in different contexts was achieved. Thematic analysis was applied to the qualitative data obtained from key informant interviews and focus group discussions (FGDs). Data organiza- tion and analysis were carried out using XLSTAT, MS Excel, and SPSS.
Constructing the Vulnerability Index
This study utilized the LVI and LVI-IPCC frameworks, origi- nally introduced by Reference 17 and later refined by Reference 18, to assess climate vulnerability in wetland resource-dependent communities [17,18]. To align with previous research, the study modified key components and sub-components based on an exten- sive literature review of climate vulnerability studies. Building on Reference 18, three critical aspects were incorporated to enhance the LVI framework: Natural resources (to better assess household sensitivity), knowledge and education, and technology (to evaluate adaptive capacity) [18]. Additionally, the housing and land ten- ure component was divided into two distinct categories, following Reference 19, to provide a more detailed analysis of household sensitivity [19]. Recognizing the importance of long-term climate trends, Reference 9 suggested using extended temperature and pre- cipitation data for assessing natural disasters and climate variabili- ty [9]. Accordingly, this study analyzed 42 years of climate data in- stead of the traditional five-year period. Furthermore, in line with Reference 9, data on natural disasters were examined separately to measure the target population’s exposure to each event [9].
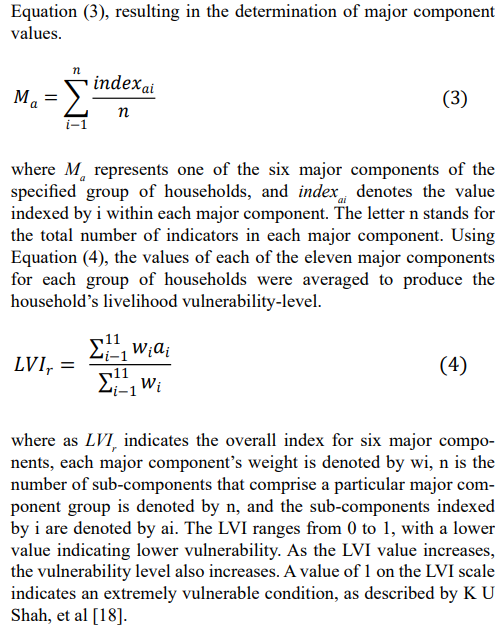
Through consultations with field-level experts, including agri- cultural extension workers, and an extensive literature review, the sub-components of major vulnerability factors were tailored to reflect local conditions. According to the IPCC, household and community vulnerability to climate variability and change is de- termined by three key factors: adaptive capacity, exposure, and sensitivity. Therefore, a comprehensive vulnerability assessment must incorporate these elements. The Livelihood Vulnerability In- dex (LVI) was developed using 49 indicators, distributed across the three vulnerability components: Exposure (9 indicators), sensi- tivity (10 indicators) and adaptive capacity (30 indicators) (Figure 2 – Figure 8).

Figure 2: Exposure to Vulnerability, Source: Own Survey Result (2023)
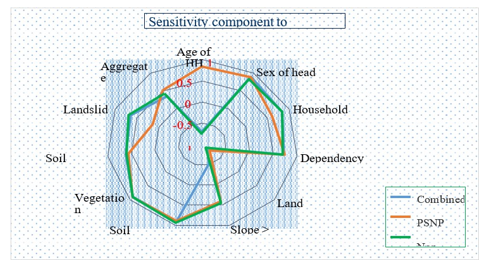
Figure 3: The Sensitivity Component to Vulnerability. Source: Own Survey Results (2023)

Figure 4: Social Capital Subcomponent, Source: Authors’ Survey Results (2023
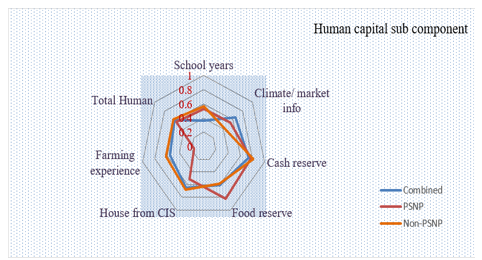
Figure 5: Human Capital Subcomponent, Source: Authors’ Survey Results (2023)
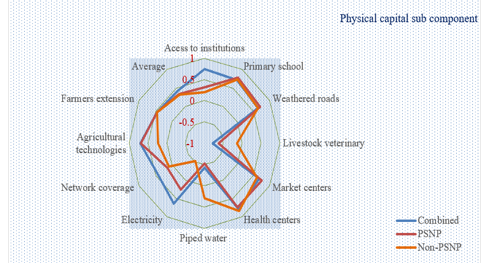
Figure 6: Physical Capital Subcomponent, Source: Authors’ Survey Results (2023)

Figure 7: Economic Capital Subcomponent. Source: Authors’ Survey Results (2023)
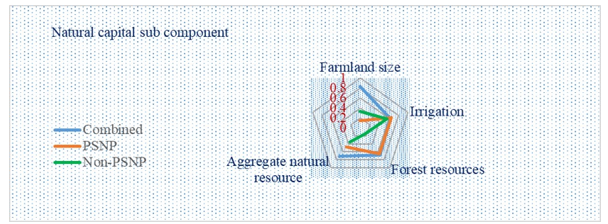
Figure 8: Natural Capital Subcomponent
• Adaptive Capacity: A system’s ability to adjust to climate change, including climate variability and extremes, determines its capacity to reduce potential damages, capitalize on opportunities, or manage consequences [15]. Adaptive capacity was assessed based on five subcomponents: Social capital, economic capital, human capital, physical capital and natural capital.
• Exposure: Exposure refers to a system’s degree of interaction with climate variability, change, and extreme weather events. It reflects climate fluctuations and the frequency and severity of natural disasters over time (short- or long-term) within a specific region [17]. To quantify exposure to natural disasters, this study analyzed the average number of extreme events recorded over the past 10 years.Additionally, climate variability was measured using the standard deviation of maximum and minimum monthly temperatures and precipitation over a 42- year period. Since household heads may struggle to recall past disasters accurately, a 5-year timeframe was used to collect disaster-related indicators.
• Sensitivity: In IPCC assessments, sensitivity measures the extent to which a system (natural or social) is influenced positively or negatively by climate variability or change. This component encompasses both biophysical (natural ecosystem) and socioeconomic factors, capturing how climate change directly or indirectly affects communities and their livelihoods [12].
Livelihood Vulnerability Index (LVI) Calculation
Assessing livelihood vulnerability is essential for identifying at- risk individuals and understanding the factors that contribute to their sensitivity to climate hazards. It also provides insights into how climate hazards impact communal systems and natural re- sources [20]. In the study area, communities face multiple natural hazards that threaten their agricultural land, livestock, and liveli- hoods. Key challenges include food insecurity, soil erosion, and drought, which further increase their vulnerability [21,22]. Three main factors influence vulnerability: sensitivity, exposure and adaptive capacity [23]. Vulnerability negatively affects adaptive capacity, while sensitivity and exposure are positively correlated with vulnerability [24]. Additionally, social identity influences how communities perceive climate risks and their ability to adapt to changing conditions [25]. The Livelihood Vulnerability Index (LVI) is a multidisciplinary tool that incorporates institutional, so- cial, economic, environmental, and physical factors [17]. It has been applied by Bedeke et al., and Asfaw et al., to assess local community vulnerability to climate variability and change [11,26]. Using the LVI-IPCC framework, the study identified three major components, which were further divided into fourteen sub-com- ponents. The selection of sub-components was guided by local conditions, literature reviews, field surveys, regional characteris- tics, expert opinions, data availability, and assumed cause-effect relationships. A detailed breakdown of these components and sub-components is provided in Figure 9.

Figure 9: Aggregate of Vulnerability Indices; Source: Own Survey Result (2023)
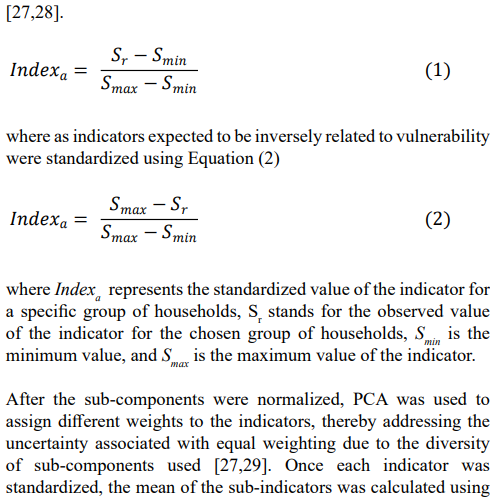
This study follows the methodology of Hahn et al., to determine household livelihood vulnerability [17]. The Human Development Index (HDI) approach which is commonly used to calculate life expectancy was applied to standardize the indicator values for sensitivity, exposure, and adaptive capacity [27]. Each household head was asked to rate the impact of various sub-components using continuous, nominal, or ordinal scales. The normalized values of each sub-component were then computed using Equation (1)
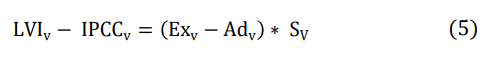
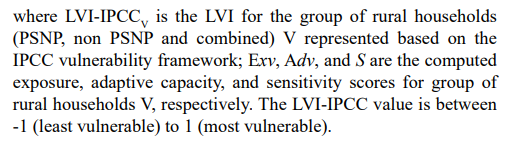
LVI according to the IPCC Approach
Results and Discussion
Demographic and Socioeconomic Characteristics of Households
The demographic and socioeconomic characteristics of the sur- veyed households were analyzed to assess their potential influence on vulnerability to climate change and climate-induced shocks.
• Gender and Marital Status: Among the 300 surveyed households, 57.3% were male-headed, while 42.7% were fe- male-headed. The Pearson chi-square test showed no statis- tically significant difference between the gender distribution of the two household groups (p = 0.102). In terms of marital status, the majority (84%) of household heads were married, followed by widowed (12%), divorced (3.7%), and single (0.1%) individuals.
• Age and Educational Status: The average age of house- hold heads was 37.82 years, with PSNP beneficiaries averag- ing 38.74 years, while non-PSNP households averaged 36.9 years. Education levels among the households revealed that 75% of respondents had attained elementary-level education. However, no significant difference was observed between the two groups in terms of educational attainment.
• Household Size and Dependency Ratio: The average house- hold size was 5.95 members among PSNP beneficiaries and 5.59 members among non-PSNP households. The dependen- cy ratio—calculated as the number of dependent household members—was slightly higher among PSNP households (1.36) compared to non-PSNP households (1.35), but this difference was not statistically significant (p = 0.980, t-test). These findings are consistent with Yibrah (2014), who exam- ined the impact of the PSNP program on poverty levels.
• Livelihood and Landholding Size: Most households depended on mixed farming for their livelihoods, with 93.7% involved in livestock rearing and 88% engaged in crop cultivation. A comparison of PSNP and non-PSNP households revealed that 92.7% of PSNP participants and 94.7% of non-PSNP households practiced animal husbandry. Additionally, 88.7% of PSNP households and 83.3% of non- PSNP households were engaged in crop farming. On average, non-PSNP households owned 2.58 tropical livestock units (TLUs), while PSNP households had 2.02 TLUs. The average farmland size was 0.75 hectares for non-PSNP households and 0.50 hectares for PSNP households, with the difference in landholding size being statistically significant (p = 0.000).
• Household Income and Access to Credit: The average annu- al income of PSNP households was 24,285.96 ETB, whereas non-PSNP households earned an average of 17,115.54 ETB per year. The t-test result (p = 0.002) indicated a significant difference in income between the two groups.
• Access to financial services varied significantly: 87.7% of PSNP households had access to credit services, compared to only 26% of non-PSNP households. The chi-square test (p = 0.0001) confirmed a statistically significant difference in cred- it accessibility between the two groups. These findings align with those of Zerihun (2020), who evaluated the impact of PSNP on household wealth, food security, and annual income in the Sidama Zone of southern Ethiopia.
Livelihood Vulnerability Analysis Results
The findings on vulnerability among rural households, both those enrolled in the PSNP program and non-participants, are presented in two phases. First, the analysis examines individual household profiles and the role of various indicators in shaping these profiles for both groups, along with an overall Livelihood Vulnerability Index (LVI). Next, the degree of vulnerability is assessed using the LVI-IPCC framework, which considers exposure, sensitivity, and adaptive capacity. While the LVI-IPCC identifies the key factors influencing vulnerability within these three dimensions, the LVI focuses on specific contributing elements for both participant and non-participant households.
Exposure Component to Household Vulnerability
Exposure is defined as the background climatic conditions, envi- ronmental changes, and extreme events that influence a system's ability to cope with stressors Reference [33]. This study assessed exposure based on historical climate trends and the frequency of extreme events in Chiro district. Findings from this study are consistent with assessments by the Reference 34, which identified droughts, erratic rainfall, and rising temperatures as the predom- inant climate change-induced shocks in Eastern and Western Ha- rarghe Zones [34].
A) Historical Climate Trends (1980–2021)
The author analyzed 42 years of temperature data (1980–2021), revealing a mean annual temperature of 18.35°C. Similarly, 42 years of rainfall data (1980–2021) indicated a mean annual precipitation of 1037.24 mm. The author analyzed 42 years of maximum and minimum temperature data (1980–2021), revealing 25.22°C and 11.47°C. In addition to household survey data, FGD panelists reported a decline in precipitation (85%) and a rise in temperature (78%) in the study area. These findings align with, that documents negative annual precipitation anomalies between 1988 and 2017 in various districts of the East and West Hararghe Zones, Ethiopia [9]. According to this study’s precipitation deficits ranging from 40% (Chiro) to 63% (Gursum). Furthermore, the results supported, which notes an increase in average annual temperatures between 1986 and 2017, with minimum and maximum temperatures rising to 12.80°C and 27.20°C, respectively, in the West and East Hararghe Zones [9].

Figure 10
B) Climate Data Analysis: Trends and Variability
• Temperature Analysis: The analysis of mean annual tem- perature data over the 42-year period (1980–2021) reveals a significant increasing trend. The linear regression model in- dicates that the temperature has been rising at a rate of 0.02 °C per year, with a high R-squared value of 0.85, suggesting that the model explains a large proportion of the variability in the data. The p-value for the trend is less than 0.05, confirm- ing that the increase in temperature is statistically significant. This upward trend aligns with global observations of climate change, where rising temperatures are a key indicator of warming trends. In addition to the trend, the temperature data exhibits low variability, with a standard deviation of 0.5 °C and a coefficient of variation (CV) of 2.5%. This indicates that the temperature has remained relatively stable over the years, with only minor fluctuations. However, the change point analysis using the Pettitt test identifies a significant shift in temperature trends around 1998. This change point suggests that the rate of temperature increase may have accelerated or shifted in some way after this year, possibly due to regional or global climatic factors.
• Rainfall Analysis: The analysis of annual rainfall data over the same 42-year period shows a significant increasing trend, with rainfall rising at a rate of 1.5 mm per year. The linear regression model has an R-squared value of 0.45, indicat- ing moderate explanatory power, and the p-value is less than 0.05, confirming the statistical significance of the trend. This suggests that, on average, the region has been experiencing slightly wetter conditions over time. However, the rainfall data exhibits high variability, with a standard deviation of 200 mm and a coefficient of variation (CV) of 20%. This high variability indicates that annual rainfall amounts can fluctuate significantly from year to year, which is typical for many re- gions with seasonal or monsoonal climates. The change point analysis using the Pettitt test identifies a significant shift in rainfall patterns around 2005. This change point could reflect alterations in regional weather systems, such as changes in monsoon intensity or the influence of large-scale climatic phenomena like El Niño or La Niña.
• Overall Interpretation: The results indicate that the region has experienced both warming and increased rainfall over the past 42 years. The temperature trend is consistent with global climate change patterns, while the rainfall trend suggests a shift toward wetter conditions, albeit with significant year-to- year variability. The detection of change points in 1998 for temperature and 2005 for rainfall highlights potential shifts in climatic conditions during these periods, which may be linked to broader environmental changes or anthropogenic influenc- es. These findings have important implications for climate ad- aptation and policy-making. The increasing temperature trend may lead to higher evaporation rates, heat stress, and impacts on ecosystems, while the increasing rainfall trend, combined with high variability, could result in more frequent extreme weather events such as floods or droughts. Understanding these trends and their drivers is crucial for developing strat- egies to mitigate and adapt to climate change in the region. In addition, (92%) of households surveyed also explained the occurrence of climate change and variability in the past de- cades. Moreover, 95% of key informants and nearly all FGD panelists confirmed that there is climate change and variabil- ity in terms of increasing temperature and rainfall variability in the district.
|
Variable |
Standard Deviation |
Coefficient of Variation (CV) |
Interpretation |
|
Mean Annual Temperature |
0.5 °C |
2.5% |
Low variability in temperature |
|
Annual Rainfall |
200 mm |
20% |
High variability in rainfall |
Table 1: Variability Analysis
|
Variable |
Trend Direction |
p-value |
Interpretation |
|
Mean Annual Temperature |
Increasing |
< 0.05 |
Significant increasing trend |
|
Annual Rainfall |
Increasing |
< 0.05 |
Significant increasing trend |
Table 2: Change Point Analysis (Mann-Kendall Test)
C) Extreme Climate Events and Exposure Levels
Nine key exposure indicators were identified and used to construct the household vulnerability index. A Principal Component Anal- ysis (PCA) of these nine indicators revealed that four principal components (PCs) accounted for 67.43% of the total variance, in- dicating the significant impact of climate exposure on rural live- lihoods. Major Climate Shocks Identified in the district included such as droughts, floods, locust infestations, fall armyworm out- breaks, hailstorms and livestock diseases. The analysis showed that PSNP households had a higher exposure index (0.56911) com- pared to non-PSNP households (0.55956) (Figure 2). These results align with the findings Ref 44, that reports that households in the Belg and Meher livelihood zones exhibited higher exposure risk indices than those in the Meher-Belg livelihood zone of northeast- ern Ethiopia [35].
In the Chiro district, major climate shocks such as droughts, floods, locust infestations, fall armyworm outbreaks, hailstorms, and live- stock diseases significantly impact household exposure and vul- nerability. Droughts reduce water availability and crop yields, leading to food insecurity and income loss for farming households. Floods damage homes, infrastructure, and agricultural land, ex- acerbating displacement and economic instability. Pest outbreaks like locust infestations and fall armyworms destroy crops, threat- ening household food supplies and livelihoods. Hailstorms can severely damage crops and property, further straining household resources. Additionally, livestock diseases, often worsened by cli- mate stress, reduce household assets and income for agro pasto- ralist communities. The combined effect of these shocks increases household exposure, forcing families to adopt coping mechanisms such as selling assets, reducing food consumption, or migrating, which can deepen long-term vulnerability to climate change.
Sensitivity Component to Livelihood Vulnerability
In this study, ten sensitivity indicators were identified, including age, sex, household size, dependency ratio, land degradation, forest degradation, slope, soil infertility, soil erosion, and landslides. The finding highlighted that natural ecosystem changes and socioeconomic vulnerabilities significantly contribute to climate sensitivity. Before normalizing the sensitivity indicators, four principal components (PCs) were extracted based on eigenvalues greater than 1, accounting for 66.02% of the total variance in household sensitivity. The analysis revealed that PSNP households had a higher sensitivity index (0.5222) compared to non-PSNP households (0.4358), indicating greater susceptibility to climate- induced shocks. The key contributing factors to higher sensitivity included female-headed households (0.837), large household size (0.861), higher dependency ratio (0.717), poor soil fertility (0.936), frequent landslides (0.677) and severe deforestation (0.913). The findings further showed that PSNP households (8.64%) were more vulnerable to biophysical and socioeconomic shocks (Figure 3).
The main factors that influenced the sensitivity levels in the district indicated herein
• Age and Gender: PSNP households had an older average age (38.7 years) compared to non-PSNP households (36.9 years) and a higher proportion of female-headed households (47.3%) than non-PSNP households (38%).
• Household Size and Dependency Ratio: The PSNP households had a higher average family size (5.95 members) and a higher dependency ratio (1.36) compared to non- PSNP households (5.59 members and 1.35 dependency ratio, respectively).
• Land Degradation: Unlike other sensitivity indicators, land degradation had a negative index (-0.882), indicating low sensitivity to land degradation among households. This was because 95% of PSNP households and 92% of non-PSNP households reported that land restoration efforts had been successful. The details of indicators that contributed to climate vulnerability were included in Figure 3.
In addition, insights from Focus Group Discussions (FGDs) con- firmed that land restoration efforts, including soil and water con- servation measures, had improved land conditions in the study area. However, participants strongly affirmed the presence of other biophysical challenges such as steep slopes, poor soil fertility, veg- etation degradation, and high risk of landslides.
Adaptive capacity component to livelihood vulnerability
The relationship between exposure, sensitivity, and vulnerability suggests that systems with higher exposure and sensitivity levels are more likely to experience greater climate-related vulnerability. However, adaptive capacity plays a crucial role in altering this dy- namic. Individuals or systems with stronger adaptive capacity are generally less vulnerable to climate change and variability. Adap- tive capacity refers to the ability to manage change and adjust to shifting conditions. Various socioeconomic factors influence this capacity, including economic status, adoption of agricultural tech- nologies, infrastructure development, and social capital [36]. A household’s ability to cope with and respond to climate changes depends significantly on access to and control over key resources [37].
The asset base is one of the five key dimensions of adaptive capacity, consisting of:
1. Social capital
2. Human capital
3. Financial capital
4. Physical capital
5. Natural capital
Access to and availability of these assets enables a system to adapt effectively to evolving environmental and economic conditions. This study used 30 indicators to measure household adaptive ca- pacity across five livelihood assets (Figures 4 - Figure 7). Ten principal components (PCs) were used, collectively accounting for 63.3% of the total variance, based on eigenvalues greater than 1. The PCA analysis revealed differences in adaptive capacity among households, with non-PSNP households demonstrating a higher overall adaptive capacity than PSNP households.
The Five Subcomponents of Adaptive Capacity are described herein
1. Social Capital
Social capital, including social bonding, social networks, and com- munity-based organizations (CBOs), plays a vital role in enhanc- ing adaptive capacity by fostering cooperation, knowledge sharing, and mutual support. Social bonding strengthens trust and solidar- ity among families, friends, and neighbors, enabling communities to mobilize resources, share information, and provide emotion- al and financial support during crises. Social networks facilitate the exchange of critical climate and market information, helping individuals make informed decisions on agriculture, business, and disaster preparedness. Meanwhile, CBOs, such as Iddir and Afosha, serve as safety nets by offering financial aid, emergency assistance, and collective problem-solving mechanisms. Togeth- er, these elements of social capital enhance resilience, enabling communities to better cope with climate shocks, recover from disruptions, and sustain livelihoods in the face of environmen- tal and economic uncertainties. As Reference 38 highlights, the phrase "it’s not what you know, but who you know" encapsulates the significance of social capital in adaptive capacity [38]. When individuals face challenges, they often rely on close relationships, including family, friends, neighbors, and community members as a final safety net. Social capital, therefore, serves as a critical asset, offering both practical support during adversities and opportuni- ties for economic and social advancement [38]. The study find- ings indicate that non-PSNP households exhibited higher social capital indices (0.57175) compared to PSNP households (0.0695), suggesting that stronger social connections enhance resilience in climate-vulnerable communities.
2. Human Capital
Human capital enhances adaptive capacity by equipping indi- viduals and communities with the knowledge, skills, health, and resources needed to respond effectively to climate and economic challenges. Key components such as education, training, farming experience, and health status enable people to adopt new technol- ogies, diversify livelihoods, and implement climate-smart prac- tices. Additionally, access to information, financial literacy, and social networks strengthens decision-making and problem-solv- ing abilities, allowing households to anticipate risks and recover from shocks. A healthy and well-educated population is also more capable of participating in economic activities and accessing op- portunities that enhance resilience and long-term sustainability. Ultimately, human capital plays a foundational role in improving livelihood security, reducing vulnerability, and strengthening com- munity adaptation to climate variability and other environmental changes.
Education and training play a crucial role in strengthening hu- man capital as part of adaptive capacity by equipping individuals with the knowledge, skills, and problem-solving abilities needed to respond effectively to climate change and livelihood challeng- es. Formal education enhances critical thinking, literacy, and ac- cess to information, enabling individuals to adopt climate-smart agricultural practices, manage resources efficiently, and diversify income sources. Similarly, vocational training and extension pro- grams provide practical skills in areas such as sustainable farming, water conservation, disaster preparedness, and financial manage- ment, allowing communities to adapt to environmental and eco- nomic changes, and strengthening their overall adaptive capacity. Knowledge of food and cash reserves is fundamental to adaptive capacity, as it empowers individuals and communities to anticipate risks, absorb shocks, and adapt to climate variability and econom- ic changes. By ensuring food security and financial preparedness, households become less vulnerable to crises and better positioned for long-term sustainability and development.
Access to climate and market information is essential for enhanc- ing adaptive capacity, as it empowers individuals and communi- ties to anticipate risks, optimize resources, and make informed decisions. By reducing uncertainty, increasing resilience, and improving economic opportunities, reliable information strength- ens livelihood security and long-term sustainability in the face of climate change and market fluctuations. Farming experience and ownership of a house with a corrugated iron sheet roof contribute significantly to human capital as part of adaptive capacity. Expe- rienced farmers possess valuable traditional knowledge and skills that help them anticipate climate patterns, implement adaptive farming techniques, and manage risks such as droughts and pests. This expertise enhances decision-making regarding crop selection, soil management, and water conservation, ultimately improving agricultural productivity and resilience. Meanwhile, owning a house with a corrugated iron sheet roof signifies better living con- ditions and financial stability, reducing vulnerability to climate-re- lated hazards like heavy rains and extreme heat. Such housing provides durability, safety, and protection, allowing households to allocate resources toward adaptation strategies rather than fre- quent home repairs. Together, farming experience and improved housing conditions strengthen human capital, enabling individuals and communities to better cope with climate variability and secure long-term livelihoods. Different authors have conducted similar research on the contribution of human capital for adaptive capaci- ty Reference [4,39].
3. Physical Capital
Physical capital refers to tangible, man-made assets used in the production of goods and services, such as machinery, buildings, infrastructure, and tools. It plays a crucial role in economic growth by enhancing productivity and efficiency [40]. Physical capital, such as infrastructure, technology, and equipment, enhances adap- tive capacity by providing essential resources for responding to environmental, economic, or social changes. Strong infrastructure, like roads, energy systems, and communication networks, im- proves resilience by ensuring accessibility and efficiency during crises. Advanced technology and machinery enable faster adap- tation in industries, agriculture, and disaster management. By supporting economic stability and innovation, physical capital strengthens a community or organization's ability to adjust and thrive in changing conditions. In this study, eleven indicators of physical capital contributed to adaptive capacity such as access to mobile networks, schools, roads, electricity, livestock veterinary, farm extension, agricultural technology, market centers, health fa- cilities and water sources.
Infrastructure plays a crucial role in enhancing adaptive capacity by providing essential services that improve resilience and support livelihoods. Schools equip individuals with knowledge and skills, enabling them to adapt to changing environments and economic conditions. Roads improve mobility, ensuring access to markets, health services, and emergency response, which is vital during crises. Electricity supports businesses, communication, and access to information, fostering economic stability. Livestock veterinary services help protect animal health, ensuring food security and the sustainability of pastoral communities. Food and non-food market centers create economic opportunities and enhance access to essen- tial goods, reducing vulnerability. Health facilities improve public health, reducing the impact of diseases and increasing workforce productivity. Drinking water sources ensure water security for households, agriculture, and livestock, which is fundamental for survival and economic activities. By strengthening access to criti- cal services, infrastructure enhances a community’s ability to cope with and adapt to environmental, social, and economic challenges.
Innovation technology indicators play a vital role in strengthening adaptive capacity by improving access to information, enhancing productivity, and fostering knowledge-sharing. Mobile network coverage enables real-time communication, access to weather forecasts, market prices, and early warning systems, helping com- munities respond effectively to risks. Improved farming technolo- gy, such as drought-resistant crops, mechanized tools, and preci- sion agriculture, increases agricultural productivity and resilience against climate variability. Farmer-to-farmer advisory services fa- cilitate knowledge exchange, allowing farmers to adopt best prac- tices, innovative techniques, and adaptive strategies to changing environmental and economic conditions. Together, these techno- logical advancements empower individuals and communities to make informed decisions, improve livelihoods, and enhance over- all resilience to challenges. The study's findings confirmed that PSNP households had higher physical capital indices (0.33545) compared to non-PSNP households (0.31173). This difference is attributed to the PSNP's contribution to local development by al- locating program budgets for constructing essential infrastructure, including roads, water systems, schools, and clinics. Additionally, the program has improved market access, strengthened disaster risk management and climate resilience, and enhanced nutrition, all of which have contributed to the higher physical capital indices among PSNP households. One author who has discussed the con- tribution of physical capital to adaptive capacity is reference [50]. In his work, highlights how physical capital, such as infrastructure and technology, enhances a community's ability to adapt to en- vironmental and economic changes by improving resilience and reducing vulnerability [40].
4. Economic Capital
Financial or economic capital refers to the monetary resources, as- sets, and investments that individuals, businesses, or communities use to sustain and grow economic activities. It includes savings, income, credit, loans, insurance, and financial investments that en- able people to access goods, services, and opportunities for devel- opment. Economic capital is essential for improving livelihoods, funding infrastructure, supporting businesses, and enhancing adap- tive capacity in response to economic and environmental challeng- es. Economic or financial capital enhances adaptive capacity by providing individuals and communities with the resources needed to invest in resilience-building strategies. Access to savings, credit, and insurance enables households to recover from shocks, invest in improved technologies, and diversify income sources. Financial capital also supports businesses, infrastructure development, and social services, reducing vulnerability to economic and environ- mental changes. By improving economic stability and access to es- sential resources, financial capital strengthens the ability to adapt to and mitigate risks effectively.
The six economic capital indicators play a crucial role in enhanc- ing adaptive capacity by strengthening financial stability and re- silience (Figure 8). Access to savings allows households to man- age risks and recover from shocks by providing financial security during crises. Credit availability enables individuals to invest in income-generating activities, agricultural improvements, and business expansion, fostering long-term adaptation. Livestock holdings serve as a financial buffer, providing food, income, and assets that can be sold during emergencies. Household income ensures economic stability, allowing families to afford essential services, education, and healthcare, which improve overall resil- ience. Household assets, such as land, tools, and durable goods, support livelihoods by enabling sustainable production and reduc- ing vulnerability. Lastly, women’s empowerment enhances adap- tive capacity by increasing household decision-making power, di- versifying income sources, and improving community resilience through education and resource access. Together, these indicators strengthen economic security, enabling households to better cope with and adapt to changing conditions. The study's findings re- vealed that PSNP households had a higher economic capital index (0.51917) than non-PSNP households (0.50233). This difference is mainly due to the higher annual income of PSNP participants (24,179.58 ETB) compared to non-PSNP households (18,192.77 ETB). Additionally, PSNP participants accumulated more assets (5,354.32 ETB) than non-participants (4,494.50 ETB). However, non-PSNP households had larger livestock holdings (2.58 TLU) than PSNP participants (2.02 TLU). In his work, examines finan- cial and economic assets in relation to social-ecological resilience and adaptation [41].
Natural Capital
Natural capital refers to the stock of natural resources and eco- systems—such as land, water, forests, biodiversity, and soil fer- tility—that support livelihoods and enhance adaptive capacity. In the context of adaptation, natural capital plays a critical role in buffering environmental shocks, sustaining agricultural productiv- ity, and providing essential ecosystem services like clean water, climate regulation, and disaster risk reduction. Communities with abundant and well-managed natural resources are more resilient to climate change and economic disruptions, as they can rely on these resources for food, income, and ecological stability. Effec- tive conservation and sustainable use of natural capital strengthen long-term adaptive capacity by ensuring resource availability for future generations. Farmland, irrigation water, and forest resources play a crucial role in enhancing adaptive capacity by supporting livelihoods, ensuring food security, and providing environmen- tal stability. Farmland allows communities to produce food and generate income, reducing their vulnerability to economic and climatic shocks. Productive agricultural land supports sustainable livelihoods and helps households adapt to changing environmental conditions. Irrigation water enhances agricultural resilience by en- abling year-round farming, reducing dependence on unpredictable rainfall, and improving crop yields. Access to reliable water sourc- es ensures food production even during droughts, strengthening food security and economic stability. Forest resources contribute to adaptation by providing essential ecosystem services such as climate regulation, soil conservation, and biodiversity protection. Forests also serve as a source of income, fuel, medicine, and food, offering alternative livelihoods in times of crisis. Together, these natural resources improve resilience, helping communities better withstand and adapt to environmental and economic challenges. In this study’s natural capital refers to access to farmland, irrigation water, and forest resources (Figure 9). The finding revealed that PSNP households had higher natural capital indices (0.47367) than non-PSNP households (0.34667). Several recent authors have con- tributed to research on natural capital, particularly in the context of adaptive capacity, sustainability, and resilience. Some key scholars and sources include [42,43].
Total Adaptive Capacity
Two of the most influential authors in the field of adaptive capac- ity are references [41,44]. A leading scholar in climate change adaptation, has extensively researched adaptive capacity, social resilience, and the role of institutions in adaptation [44]. His work highlights how social, economic, and environmental factors influ- ence communities' ability to adapt to climate change. Similarly, a prominent researcher in resilience and adaptive governance focus- es on how ecosystems, social systems, and economic structures interact to shape adaptive capacity [41]. He emphasizes the im- portance of biodiversity, ecosystem services, and adaptive man- agement in building resilience. The study revealed that non-PSNP households had a higher adaptive capacity index (0.45130) com- pared to PSNP households (0.39930). Accordingly, the non-PSNP participants had stronger social and human capital while PSNP participants had greater economic, physical, and natural capital.

Figure 11: Summary of Adaptive Capacity. Source: Authors’ Survey Results (2023)
Overall Vulnerability Assessment
In the context of climate change, vulnerability refers to the degree to which a system or community is susceptible to and unable to cope with adverse climate impacts. It is determined by three key factors: exposure, sensitivity, and adaptive capacity. Exposure re- fers to the extent to which a system experiences climate-related hazards, such as rising temperatures, extreme weather, or sea-level rise. Sensitivity indicates how significantly a system or population is affected by these changes, depending on factors like economic dependence on climate-sensitive sectors (e.g., agriculture) or frag- ile ecosystems. Adaptive capacity represents the ability to adjust, respond, or recover from climate impacts, influenced by resources like infrastructure, financial capital, knowledge, and governance. High exposure and sensitivity combined with low adaptive capac- ity result in greater vulnerability, making communities more sus- ceptible to climate risks.
The results showed that all household groups exhibited positive vulnerability index values, indicating varying degrees of vulner- ability to climate-induced shocks. Specifically: the PSNP house- holds had the highest vulnerability index (0.08868), the combined group had an index of 0.08170, and the non-PSNP households had the lowest vulnerability index (0.04718) (Figure 9). This suggests that PSNP households were the most vulnerable to climate change due to: higher exposure levels (0.56911) compared to non-PSNP households (0.55956), the greater sensitivity to biophysical and socioeconomic factors (0.52220) compared to non-PSNP house- holds (0.43580) and the lowest adaptive capacity (0.39930) than both combined households (0.51163) and non-PSNP households (0.45130). The findings of the studies highlighted the lower adap- tive capacity among PSNP households was primarily due to limit- ed social and human capital resources, making them less resilient to climate shocks. Findings from FGDs and key informant inter- views further supported this analysis, with 60% of PSNP house- holds and 55% of non-PSNP households identifying themselves as vulnerable due to limited adaptive capacity.
Two prominent current authors who have contributed significantly to the study of vulnerability in the context of climate change are references [29,45]. A leading scholar in climate vulnerability and risk assessment, has developed frameworks for understanding how social, economic, and environmental factors contribute to vulner- ability [44]. She introduced the Social Vulnerability Index (SoVI), which measures community vulnerability based on social and eco- nomic conditions.
Similarly, a well-known climate change researcher, focuses on the human dimensions of vulnerability and adaptation [45]. Her work explores how individual and collective responses shape resilience and adaptive capacity in the face of climate risks. Both authors provide essential insights into climate vulnerability, emphasizing the social, economic, and institutional factors that influence how communities respond to climate risks.
Conclusions and Recommendations
Conclusion
This study assessed the vulnerability of rural households in the Chiro district, Eastern Oromia, Ethiopia, to climate-induced shocks using the Livelihood Vulnerability Index (LVI) and the LVI-IPCC framework. The findings indicate that all household groups PSNP participants, non-PSNP households, and the combined group ex- hibit varying degrees of vulnerability. PSNP households were found to be the most vulnerable due to their higher exposure to climate-related hazards and lower adaptive capacity, despite ben- efiting from economic, physical, and natural capital resources. Their vulnerability stems mainly from limited access to social and human capital, higher dependency ratios, and greater sensitivity to biophysical and socioeconomic stressors. The study underscores the necessity of targeted interventions aimed at improving the resilience of PSNP households. Strengthening social and human capital through education, skills training, gender empowerment, and diversified livelihood opportunities can significantly reduce climate-induced vulnerabilities. Additionally, improving institu- tional support and fostering climate adaptation strategies can en- hance household resilience [46].
Recommendations
Based on the study findings, the following recommendations are proposed to enhance the resilience of rural households to climate change and improve their adaptive capacity:
1. Enhancing Social and Human Capital
• Improve access to education and vocational training to equip households with alternative livelihood skills.
• Promote gender equality and empower women to participate in economic and decision-making activities.
2. Strengthening Institutional Support
• Expand access to financial services, including microcredit and savings programs, to improve economic resilience.
• Improve access to climate and market information to enable farmers to make informed decisions regarding crop selection and management practices.
3. Diversifying Livelihood Strategies
• Encourage off-farm and non-farm employment opportunities to reduce reliance on climate-sensitive agricultural activities.
• Support small-scale irrigation and climate-smart agricultural practices to mitigate the impact of erratic rainfall and droughts.
4. Improving Infrastructure and Services
• Expand rural infrastructure, such as roads, electricity, and mobile network coverage, to facilitate market access and information flow.
• Strengthen healthcare and nutrition programs to improve overall community well-being and resilience.
5. Promoting Climate Resilience Policies:
• Develop and implement policies that integrate climate risk management into local development planning.
• Strengthen early warning systems and disaster preparedness measures to reduce the impact of climate-induced shocks.
Ethics Approval and Consent to Participate
This study was conducted in accordance with the ethical guide- lines for research involving human participants. Prior to data collection, informed consent was obtained from all respondents, ensuring their voluntary participation and understanding of the study's objectives. The consent process included clear explana- tions of the purpose of the research, the nature of participation, and the confidentiality of responses. No identifying information was recorded to protect participant anonymity. The research protocol adhered to the ethical standards outlined by the Climate Change Journal, which emphasizes respect for participant autonomy, con- fidentiality, and minimal risk. Ethical approval for this study was not required by an institutional review board, as the research in- volved non-invasive data collection through surveys, interviews, and focus group discussions, and no sensitive personal or medical information was gathered. However, all procedures were designed to align with the journal's commitment to ethical research practices and the principles of the Declaration of Helsinki.
Author Contribution Statement
As the sole author of this manuscript, I confirm that I am entirely responsible for all aspects of this work, including Conceptualiza- tion and study design, data collection, analysis, and interpretation, drafting and critical revision of the manuscript and final approval of the version to be published. No other individuals or entities con- tributed to the intellectual content or writing of this article.
Competiting Interest Statement
The research and publication processes were conducted inde- pendently without external influence or sponsorship.
Availability of Data and Materials Statement
The datasets and materials used and/or analyzed during this study are available from the author upon reasonable request for tempera- ture and rainfall data.
Publicly Accessible Climate Databases (where Applicable)
All processed data supporting the findings of this study are included within the manuscript (and/or supplementary files). Custom scripts or analytical tools developed for this research can be shared upon request, contingent on ethical and privacy considerations.
References
- Intergovernmental Panel on Climate Change. IPCC. (2023). FIFTY-EIGHTH SESSION OF THE IPCC Interlaken,Switzerland, 13 – 17 March 2023.
- Serdeczny, O., Adams, S., Baarsch, F., Coumou, D., Robinson, A., Hare, W., ... & Reinhardt, J. (2017). Climate change impacts in Sub-Saharan Africa: from physical changes to their social repercussions. Regional Environmental Change, 17, 1585-1600.
- Intergovernmental Panel on Climate Change. IPCC. (2014). Impacts, adaptation, and vulnerability WGII AR5 summary for policymakers.
- Tesfaye, S., Taye, G., Birhane, E., & van der Zee, S. E. (2019). Observed and model simulated twenty-first century hydro- climatic change of Northern Ethiopia. Journal of Hydrology: Regional Studies, 22, 100595.
- Gebreegziabher, Z., Mekonnen, A., Bekele, R. D., Bane, J., & Zewdie, S. A. (2018). Mapping vulnerability to climate change of the farming sector in the Nile Basin of Ethiopia: a micro-level perspective. In Agricultural Adaptation to Climate Change in Africa (pp. 28-54). Routledge.
- Mekonnen, Z., Woldeamanuel, T., & Kassa, H. (2019). Socio-ecological vulnerability to climate change/variability in central rift valley, Ethiopia. Advances in Climate Change Research, 10(1), 9-20.
- Tadesse, T., & Gebremedhin Zeleke, T. (2022). The impact of the productive safety net program (PSNP) on food security and asset accumulation of rural households’: evidence from Gedeo zone, Southern Ethiopia. Cogent Economics & Finance, 10(1), 2087285.
- Shumetie, A., & Alemayehu Yismaw, M. (2018). Effect of climate variability on crop income and indigenous adaptation strategies of households. International Journal of Climate Change Strategies and Management, 10(4), 580-595.
- Teshome, H., Tesfaye, K., Dechassa, N., Tana, T., & Huber, M. (2021). Analysis of past and projected trends of rainfall and temperature parameters in Eastern and Western Hararghe zones, Ethiopia. Atmosphere, 13(1), 67.
- Zeleke, T., Beyene, F., Deressa, T., Yousuf, J., & Kebede, T. (2021). Vulnerability of smallholder farmers to climate change-induced shocks in East Hararghe Zone, Ethiopia. Sustainability, 13(4), 2162.
- Asfaw, A., Bantider, A., Simane, B., & Hassen, A. (2021). Smallholder farmers’ livelihood vulnerability to climate change-induced hazards: agroecology-based comparative analysis in Northcentral Ethiopia (Woleka Sub- basin). Heliyon, 7(4).
- Tessema, I., & Simane, B. (2019). Vulnerability analysis of smallholder farmers to climate variability and change: an agro-ecological system-based approach in the Fincha’a sub- basin of the upper Blue Nile Basin of Ethiopia. Ecological Processes, 8, 1-18.
- Amare, A., & Simane, B. (2017). Climate change induced vulnerability of smallholder farmers: agroecology-based analysis in the Muger sub-basin of the upper Blue-Nile basin of Ethiopia. American Journal of Climate Change, 6(4), 668- 693.
- Yimam, D. A., & Holvoet, N. (2023). Assessing climate change vulnerability of smallholder farmers in northwest Ethiopia: application of a household intrinsic vulnerability index. International Journal of Climate Change Strategies and Management, 15(4), 537-560.
- Intergovernmental Panel on Climate Change. IPCC. (2007). Climate change 2007: synthesis report. Contribution of working groups I, II and III to the fourth assessment report of the intergovernmental panel on climate change, 95-212.
- Umer, N. (2019). Building resilient ecosystem and diversifying livelihood to enhance food security in Chiro Woreda, Oromia Regional State, Ethiopia.
- Hahn, M. B., Riederer, A. M., & Foster, S. O. (2009). The Livelihood Vulnerability Index: A pragmatic approach to assessing risks from climate variability and change—A case study in Mozambique. Global environmental change, 19(1), 74-88.
- Shah, K. U., Dulal, H. B., Johnson, C., & Baptiste, A. (2013). Understanding livelihood vulnerability to climate change: Applying the livelihood vulnerability index in Trinidad and Tobago. Geoforum, 47, 125-137.
- Huong, N. T. L., Yao, S., & Fahad, S. (2019). Assessing household livelihood vulnerability to climate change: The case of Northwest Vietnam. Human and Ecological Risk Assessment: An International Journal, 25(5), 1157-1175.
- Tavares, A. O., dos Santos, P. P., Freire, P., Fortunato,A. B., Rilo, A., & Sá, L. (2015). Flooding hazard in the Tagus estuarine area: the challenge of scale in vulnerability assessments. Environmental Science & Policy, 51, 238-255.
- Alam, G. M., Alam, K., Mushtaq, S., Sarker, M. N. I., & Hossain, M. (2020). Hazards, food insecurity and human displacement in rural riverine Bangladesh: Implications for policy. International Journal of Disaster Risk Reduction, 43, 101364.
- Sarker, M. N. I., Wu, M., Alam, G. M., & Shouse, R. C. (2020). RETRACTED: Livelihood resilience of riverine island dwellers in the face of natural disasters: Empirical evidence from Bangladesh.
- Parry, M. L. (Ed.). (2007). Climate change 2007-impacts, adaptation and vulnerability: Working group II contribution to the fourth assessment report of the IPCC (Vol. 4). Cambridge University Press.
- Alam, G. M., Alam, K., Mushtaq, S., & Clarke, M. L. (2017). Vulnerability to climatic change in riparian char and river-bank households in Bangladesh: Implication for policy, livelihoods and social development. Ecological Indicators, 72, 23-32.
- Frank, E., Eakin, H., & López-Carr, D. (2011). Social identity, perception and motivation in adaptation to climate risk in the coffee sector of Chiapas, Mexico. Global environmental change, 21(1), 66-76.
- Bedeke, S. B., Vanhove, W., Wordofa, M. G., Natarajan, K., & Van Damme, P. (2020). Vulnerability to climate change among maize-dependent smallholders in three districts of Ethiopia. Environment, Development & Sustainability, 22(2), 693-718.
- Opiyo, F. E., Wasonga, O. V., & Nyangito, M. M. (2014). Measuring household vulnerability to climate-induced stresses in pastoral rangelands of Kenya: Implications for resilience programming. Pastoralism, 4(1), 10.
- Simane, B., Zaitchik, B. F., & Foltz, J. D. (2016). Agroecosystem specific climate vulnerability analysis: application of the livelihood vulnerability index to a tropical highland region. Mitigation and Adaptation Strategies for Global Change, 21(1), 39-65.
- Cutter, S. L., Boruff, B. J., & Shirley, W. L. (2003). Social vulnerability to environmental hazards. Social Science Quarterly, 84 (2), 242–261.
- Gerlitz, J. Y., Macchi, M., Brooks, N., Pandey, R., Banerjee, S., & Jha, S. K. (2017). The multidimensional livelihood vulnerability index–an instrument to measure livelihood vulnerability to change in the Hindu Kush Himalayas. Climate and Development, 9(2), 124-140.
- Alam, G. M., Alam, K., & Mushtaq, S. (2016). Influence of institutional access and social capital on adaptation decision: Empirical evidence from hazard-prone rural households in Bangladesh. Ecological Economics, 130, 243-251.
- Dechassa, C., Simane, B., & Alamirew, B. (2017). Farmers’ livelihoods vulnerability to climate variability and change in Didesa Basin southern part of Abay Basin, Ethiopia. In Climate Change Adaptation in Africa: Fostering Resilience and Capacity to Adapt (pp. 267-284). Cham: Springer International Publishing.
- Zebisch, M., Schneiderbauer, S., Fritzsche, K., Bubeck, P., Kienberger, S., Kahlenborn, W., ... & Below, T. (2021). The vulnerability sourcebook and climate impact chains–a standardised framework for a climate vulnerability and risk assessment. International Journal of Climate Change Strategies and Management, 13(1), 35-59.
- World Food Program (WFP) & Central Statistical Agency of Ethiopia (CSA). (2019). Comprehensive Food Security and Vulnerability Analysis, Ethiopia. Addis Ababa; WFP, Rome, Italy.
- Mekonen, A. A., & Berlie, A. B. (2021). Rural households’ livelihood vulnerability to climate variability and extremes: A livelihood zone-based approach in the Northeastern Highlands of Ethiopia. Ecological Processes, 10, 1-23.
- Asrat, P., & Simane, B. (2017). Adaptation benefits of climate- smart agricultural practices in the Blue Nile Basin: empirical evidence from North-West Ethiopia. In Climate change adaptation in Africa: fostering resilience and capacity to adapt (pp. 45-59). Cham: Springer International Publishing.
- Climate vulnerability and capacity analysis handbook. CARE international.
- Woolcock, M., & Narayan, D. (2000). Social capital: Implications for development theory, research, and policy. The world bank research observer, 15(2), 225-249.
- Adu, D. T., Kuwornu, J. K., Anim-Somuah, H., & Sasaki, N. (2018). Application of livelihood vulnerability index in assessing smallholder maize farming households' vulnerability to climate change in Brong-Ahafo region of Ghana. Kasetsart journal of social sciences, 39(1), 22-32.
- Mankiw, N. G. (2021). Principles of economics.
- Folke, C. (2006). Resilience: The emergence of a perspective for social–ecological systems analyses. Global environmental change, 16(3), 253-267.
- Costanza, R., De Groot, R., Braat, L., Kubiszewski, I., Fioramonti, L., Sutton, P., ... & Grasso, M. (2017). Twenty years of ecosystem services: How far have we come and how far do we still need to go?. Ecosystem services, 28, 1-16.
- Dasgupta, P. (2021). The economics of biodiversity: the Dasgupta review. Hm Treasury.
- Adger, W. N. (2003). Social capital, collective action, and adaptation to climate changes. Economic Geography, 79, 4.
- O'brien, K., Eriksen, S., Nygaard, L. P., & Schjolden, A. N. E. (2007). Why different interpretations of vulnerability matter in climate change discourses. Climate policy, 7(1), 73-88.
- Deressa, T., Hassan, R. M., & Ringler, C. (2008). Measuring Ethiopian farmers' vulnerability to climate change across regional states [in Amharic] (No. 15 (5) AMH). International Food Policy Research Institute (IFPRI).
Appendices
|
Adaptive capacity Variables |
Types of variables |
Expected relationship |
|
School years |
scale |
(+) |
|
Farmland size in hectares |
scale |
(+) |
|
Bonding social capital |
Dummy 1, otherwise 0 |
(+) |
|
Access to institutions |
Dummy 1, otherwise 0 |
(-) |
|
Health insurance service |
Dummy 1, otherwise 0 |
(+) |
|
Access to climate and market information |
Dummy 1, otherwise 0 |
(+) |
|
Access to land under potential irrigation |
Dummy 1, otherwise 0 |
(+) |
|
Primary school access |
Dummy 1, otherwise 0 |
(+) |
|
Access to roads |
Dummy 1, otherwise 0 |
(+) |
|
Livestock veterinary |
Dummy1, otherwise 0 |
(+) |
|
Access to market |
Dummy1, otherwise 0 |
(+) |
|
Health and nutrition service |
Dummy 1, otherwise 0 |
(+) |
|
Piped water service |
Dummy 1, otherwise 0 |
(+) |
|
Electricity service |
Dummy 1, otherwise 0 |
(+) |
|
Mobile network coverage |
Dummy 1, otherwise 0 |
(+) |
|
Cash reserve availability |
Scale |
(+) |
|
Food Reservation availability |
scale |
(+) |
|
House with corrugated iron sheet |
Dummy 1, otherwise 0 |
(+) |
|
Support from informal safety net |
Dummy 1 otherwise 0 |
(+) |
|
Farming experience |
Dummy 1, otherwise 0 |
(+) |
|
Access and control of natural resources |
Dummy 1, otherwise 0 |
(+) |
|
Support from relatives in community |
Dummy 1, otherwise 0 |
(±) |
|
Agricultural technology |
Dummy,1 otherwise 0 |
(+) |
|
Farmers extension service |
Dummy 1, otherwise 0 |
(+) |
|
Access to cash saving |
Dummy 1 otherwise 0 |
(+) |
|
Access to credit service |
Dummy 1, otherwise 0 |
(+) |
|
Number of livestock in (TLU) |
scale |
(+) |
|
Annual total income (ETB) |
scale |
(+) |
|
Annual total asset without TLU/income (ETB) |
scale |
(+) |
|
Knowledge of gender equality |
Dummy1; otherwise, 0 |
(+) |
Table 1: Adaptive Capacity Variables and their Relationship to Vulnerability Reduction
|
Variables |
Type of Variables |
Hypothesized sign |
|
Drought |
scale |
(-) |
|
Flood |
scale |
(-) |
|
Locust infestation |
scale |
(-) |
|
Fall worm infestation |
scale |
(-) |
|
Hailstorm |
scale |
(-) |
|
Livestock disease |
scale |
(-) |
|
Human disease |
scale |
(-) |
|
Temperature (oC) |
scale |
(-) |
|
Rainfall (ml) |
scale |
(-) |
Table 2: The Relationships between Climate Change and Climate-Induced Shocks and Vulnerability Reduction
|
Variables |
Types of variables |
Hypothesized sign |
|
Age of household |
scale |
(±) |
|
Sex of household |
scale |
(±) |
|
Household size |
scale |
(±) |
|
Dependency ratio |
scale |
(±) |
|
Soin infertility |
Dummy1, otherwise 0 |
(-) |
|
Land degradation |
Dummy1, otherwise 0 |
(-) |
|
Vegetation degradation |
Dummy1, otherwise 0 |
(-) |
|
Slope ≥ 15% |
Dummy1, otherwise 0 |
(-) |
|
Soil erosion |
Dummy1, otherwise 0 |
(-) |
|
Landslide |
Dummy1, otherwise 0 |
(-) |
Table 3: Relationships between Biophysical Settings/Socioeconomic Conditions and Vulnerability Reduction
|
Category of house- holds |
Variables |
Household response |
Chi2 (1) |
Significance level (p) |
|
|
|
|
No |
Yes |
|
|
|
Non PSNP |
Information |
43 |
107 |
12.8610 |
0.000 |
|
PSNP |
|
18 |
132 |
|
|
|
Non PSNP |
Market |
43 |
107 |
0.0162 |
0.899 |
|
PSNP |
|
44 |
106 |
|
|
|
Non PSNP |
H &N |
72 |
78 |
6.6863 |
0.010 |
|
PSNP |
|
50 |
110 |
|
|
|
Non PSNP |
Road access |
52 |
98 |
0.8315 |
0.362 |
|
PSNP |
|
44 |
104 |
|
|
|
Non PSNP |
Pipe water |
28 |
120 |
6.8934 |
0.009 |
|
PSNP |
|
48 |
101 |
|
|
|
Non PSNP |
Electricity |
58 |
92 |
1.2634 |
0.261 |
|
PSNP |
|
48 |
100 |
|
|
Table 4: Access to Different Social Services
|
Variables Category |
Group of HHs |
Mean |
Std. Dev. |
t test |
Significance level (p) |
|
Age of household |
PSNP |
38.74 |
9.304 |
1.664 |
.097 |
|
|
Non PSNP |
36.90 |
9.843 |
1.664 |
.097 |
|
Household school years |
PSNP |
.75 |
.695 |
.087 |
.931 |
|
|
Non PSNP |
.75 |
.637 |
.087 |
.931 |
|
Size of farmland |
PSNP |
.5003 |
.51026 |
-1.653 |
.099 |
|
|
Non PSNP |
.5899 |
.42538 |
-1.653 |
.099 |
|
Household size |
PSNP |
5.95 |
1.467 |
2.082 |
.038 |
|
|
Non PSNP |
5.59 |
1.581 |
2.082 |
.038 |
|
Productive age |
PSNP |
3.21 |
1.095 |
4.225 |
.000 |
|
|
Non PSNP |
2.66 |
1.146 |
4.225 |
.000 |
|
Dependency ratio |
PSNP |
1.36 |
1.262 |
.025 |
.980 |
|
|
Non PSNP |
1.35 |
1.056 |
.025 |
.980 |
Table 5: Demographic Conditions of the Households According to t test
|
Variables Category |
Group of households |
Mean |
Std. Dev. |
t test |
Significance level (p) |
|
Total livestock in TLU |
PSNP |
2.02 |
1.165 |
-3.948 |
.000 |
|
Non PSNP |
2.58 |
1.29 |
|
|
|
|
Total asset value in ETB |
PSNP |
1766.49 |
547.75 |
.611 |
.542 |
|
Non PSNP |
1695.15 |
1318.96 |
|
|
|
|
On-farm |
PSNP |
13321.13 |
19916.86 |
3.906 |
.000 |
|
Non PSNP |
6671.86 |
6167.31 |
|
|
|
|
Nonfarm |
PSNP |
1008.67 |
3375.87 |
-2.663 |
.008 |
|
Non PSNP |
2408.27 |
5481.16 |
|
|
|
|
Total amount of income of HHs |
PSNP |
24285.96 |
23475.40 |
3.199 |
.002 |
|
Non PSNP |
17115.54 |
14228.03 |
|
|
Table 6: Socioeconomic Conditions of the Households
|
Variables |
Category of HHs |
Category of household |
Chi2 (1) |
Significance level (p) |
|
|
|
|
Non PSNP |
PSNP |
|
|
|
Sex |
Male |
62% |
52.7% |
2.671 |
0.102 |
|
Female |
38% |
47.3% |
|
|
|
|
Martial |
Married |
88.7% |
78.7% |
10.098 |
0.039 |
|
Divorced |
4% |
3.3% |
|
|
|
|
Widowed |
6.7% |
17.3% |
|
|
|
|
Single |
|
0.7% |
|
|
|
|
Read and write |
No |
35.3% |
37.3% |
0.130 |
0.719 |
|
Yes |
64.7% |
62.7% |
232.692 |
0.000 |
|
|
Credit |
No |
74% |
11.3% |
120.403 |
0.000 |
|
Yes |
26% |
88.7% |
|
|
|
|
Livestock |
No |
5.3% |
7.3% |
0.506 |
0.477 |
|
Yes |
94.7% |
92.7% |
|
|
|
|
Crop |
No |
16.7% |
11.3% |
1.772 |
0.183 |
|
Yes |
33.3% |
88.7% |
|
|
|
|
Gender equality |
No |
51.35 |
30% |
14.146 |
0.000 |
|
|
Yes |
48.7% |
70% |
|
|
Table 7: Chi-Square Test Results for Nominal Variables
|
|
Component |
||||||||||
|
Adaptive capacity Variables |
1 |
2 |
3 |
4 |
5 |
6 |
7 |
8 |
9 |
10 |
PCA |
|
School years |
-0.259 |
0.364 |
0.237 |
-0.28 |
-0.108 |
-0.008 |
0.136 |
-0.217 |
0.222 |
0.103 |
0.364 |
|
Farmland size |
0.023 |
0.001 |
0.048 |
-0.051 |
0.019 |
0.093 |
0.05 |
0.027 |
0.832 |
-0.017 |
0.832 |
|
Bonding social capital |
0.381 |
0.079 |
-0.15 |
-0.028 |
-0.034 |
0.626 |
-0.152 |
0.082 |
0.055 |
-0.206 |
0.626 |
|
Access to institu- tions |
-0.002 |
-0.036 |
0.077 |
0.084 |
-0.043 |
0.738 |
0.229 |
-0.036 |
0.089 |
0.076 |
0.738 |
|
Health insurance |
0.108 |
0.051 |
0.134 |
0.779 |
-0.091 |
0.061 |
0.057 |
-0.015 |
-0.014 |
0.075 |
0.779 |
|
Climate and mar- ket |
0.078 |
0.043 |
0.653 |
0.069 |
-0.141 |
0.002 |
0.074 |
-0.11 |
-0.057 |
0.22 |
0.653 |
|
Land under irrigation |
-0.026 |
0.629 |
0.062 |
-0.058 |
-0.03 |
-0.082 |
0.276 |
0 |
-0.039 |
0.075 |
0.629 |
|
Primary school |
0.107 |
0.064 |
0.016 |
0.005 |
-0.025 |
0.177 |
0.709 |
0.092 |
0.035 |
-0.052 |
0.709 |
|
Weath- ered roads |
0.641 |
-0.088 |
0.025 |
0.163 |
0.04 |
0.125 |
-0.152 |
0.167 |
0.252 |
-0.132 |
0.641 |
|
Livestock veterinary |
-0.783 |
0.181 |
-0.039 |
-0.027 |
-0.009 |
-0.001 |
-0.059 |
0.015 |
0.055 |
-0.111 |
-0.783 |
|
Market availabil- ity |
-0.488 |
0.676 |
0.059 |
-0.1 |
-0.037 |
0.001 |
-0.106 |
0.055 |
0.02 |
-0.176 |
0.676 |
|
Health and nutri- tion |
-0.022 |
0.054 |
-0.069 |
0.113 |
0.013 |
0.031 |
-0.093 |
0.791 |
-0.012 |
0.071 |
0.791 |
|
Piped water |
-0.212 |
0.115 |
-0.424 |
0.199 |
0.161 |
-0.053 |
0.382 |
-0.028 |
-0.065 |
-0.1 |
-0.424 |
|
Electric- ity |
-0.311 |
0.64 |
0.143 |
-0.355 |
0.03 |
0.102 |
0.066 |
0.126 |
-0.192 |
-0.131 |
0.64 |
|
Network coverage |
0.01 |
0.006 |
0.003 |
-0.007 |
0.65 |
0.025 |
0.431 |
0.136 |
-0.034 |
0.103 |
0.431 |
|
Cash reserve |
0.741 |
-0.1 |
0.068 |
-0.144 |
-0.044 |
0.031 |
0.116 |
-0.02 |
-0.07 |
0.189 |
0.741 |
|
Food commodi- ty reserve |
0.604 |
0.361 |
0.091 |
-0.121 |
-0.227 |
0.029 |
0.119 |
0.045 |
-0.267 |
0.007 |
0.604 |
|
Corrugat- ed iron sheet |
0.069 |
0.652 |
0.039 |
0.038 |
0.111 |
0.117 |
-0.103 |
-0.017 |
0.071 |
0.033 |
0.652 |
|
Informal safety net |
0.09 |
0.087 |
-0.094 |
-0.048 |
0.757 |
-0.058 |
-0.135 |
-0.087 |
0.048 |
0.044 |
0.757 |
|
Farming experi- ences |
0.55 |
0.036 |
0.038 |
0.087 |
0.23 |
0.026 |
-0.138 |
-0.23 |
0.306 |
0.093 |
0.55 |
|
Natural resources |
0.676 |
-0.197 |
0.217 |
0.051 |
0.152 |
0.145 |
-0.014 |
0.125 |
-0.05 |
0.034 |
0.676 |
|
Relatives in com- munity |
0.245 |
-0.011 |
-0.058 |
0.077 |
0.274 |
-0.064 |
-0.024 |
-0.018 |
-0.143 |
0.565 |
0.565 |
|
Agricul- tural tech- nology |
0.701 |
-0.101 |
0.213 |
0.292 |
0.186 |
0.153 |
-0.118 |
-0.018 |
0.011 |
-0.166 |
0.701 |
|
Farmers extension |
0.456 |
0.269 |
0.423 |
0.229 |
0.236 |
0.051 |
-0.032 |
-0.073 |
0.103 |
-0.268 |
0.456 |
|
Access to savings |
0.142 |
0.175 |
0.703 |
0.135 |
0.056 |
0.014 |
-0.046 |
0.206 |
0.065 |
-0.123 |
0.703 |
|
Credit service |
0.08 |
-0.041 |
0.135 |
-0.116 |
-0.024 |
0 |
0.191 |
0.59 |
0.036 |
0.024 |
0.59 |
|
Livestock in TLU |
0.579 |
0.173 |
-0.159 |
0.282 |
-0.197 |
-0.182 |
-0.026 |
0.134 |
0.377 |
-0.084 |
0.579 |
|
Total annual income |
0.344 |
0.208 |
0.116 |
0.081 |
-0.01 |
0.318 |
-0.443 |
0.117 |
-0.047 |
0.058 |
0.742 |
|
Total asset |
0.099 |
0.318 |
0.322 |
0.229 |
0.07 |
-0.278 |
-0.09 |
0.255 |
0.181 |
-0.325 |
-0.325 |
|
Gender equality |
-0.06 |
0.173 |
0.282 |
0.056 |
-0.045 |
0.029 |
-0.121 |
0.24 |
0.18 |
0.589 |
0.056 |
|
Average |
0.14253 |
0.14941 |
0.09722 |
0.05106 |
0.06 |
0.06775 |
0.03075 |
0.07294 |
0.06088 |
0.01463 |
0.51163 |
Table 8: Rotated Component Matrix Adaptive Capacity Variables for Combined Households
|
|
Component |
|||||||||||
|
Adaptive capacity Variable |
1 |
2 |
3 |
4 |
5 |
6 |
7 |
8 |
9 |
10 |
11 |
PCA |
|
School years |
-0.081 |
0.531 |
-0.116 |
-0.202 |
0.046 |
-0.284 |
0.361 |
0.094 |
0.051 |
0.116 |
0.021 |
0.531 |
|
Farm- land size |
0.135 |
0.031 |
-0.253 |
0.053 |
0.039 |
0.101 |
0.76 |
-0.018 |
0.062 |
0.144 |
-0.004 |
0.135 |
|
Bonding social capital |
0.392 |
0.203 |
0.261 |
0.377 |
0.137 |
0.092 |
0.094 |
0.243 |
-0.368 |
-0.018 |
-0.18 |
0.392 |
|
Access to insti- tutions |
0.08 |
0.03 |
0.005 |
0.063 |
0.486 |
-0.25 |
0.044 |
-0.04 |
0.505 |
0.153 |
0.317 |
0.317 |
|
Health insur- ance |
0.154 |
-0.059 |
-0.226 |
0.089 |
-0.074 |
0.099 |
-0.712 |
-0.09 |
-0.037 |
0.255 |
-0.047 |
-0.712 |
|
Climate and market |
0.053 |
-0.12 |
-0.005 |
0.296 |
-0.042 |
-0.237 |
0.1 |
-0.129 |
-0.029 |
0.13 |
0.543 |
0.543 |
|
Land under irrigation |
-0.234 |
0.645 |
0.095 |
-0.026 |
0.202 |
0.091 |
0.056 |
-0.276 |
-0.276 |
-0.032 |
0.03 |
0.645 |
|
Primary school |
0.075 |
0.092 |
0.069 |
-0.221 |
0.784 |
0.065 |
0.043 |
-0.258 |
-0.089 |
0.157 |
-0.013 |
0.784 |
|
Weath- ered roads |
0.708 |
-0.249 |
0.004 |
0.066 |
-0.076 |
0.204 |
0.119 |
0.104 |
-0.144 |
0.146 |
-0.046 |
0.708 |
|
Live- stock veteri- nary |
-0.634 |
0.295 |
-0.221 |
0.054 |
0.087 |
-0.037 |
0.019 |
0.377 |
0.175 |
0.075 |
-0.063 |
-0.634 |
|
Market informa- tion |
-0.278 |
0.745 |
-0.228 |
0.175 |
-0.09 |
0.084 |
-0.013 |
0.27 |
0.019 |
-0.029 |
-0.055 |
0.745 |
|
Health and nu- trition |
0.008 |
0.082 |
-0.115 |
-0.015 |
0.089 |
0.741 |
-0.029 |
0.181 |
0.043 |
0.197 |
-0.01 |
0.741 |
|
Piped water |
-0.312 |
-0.025 |
-0.125 |
-0.526 |
0.119 |
0.041 |
-0.173 |
0.177 |
0.028 |
-0.097 |
-0.073 |
-0.526 |
|
Electric- ity |
-0.278 |
0.723 |
0.033 |
0.068 |
-0.111 |
-0.044 |
0.079 |
0.265 |
-0.055 |
0.012 |
-0.11 |
0.265 |
|
Network coverage |
0.143 |
-0.008 |
-0.047 |
-0.743 |
-0.003 |
0.063 |
0.109 |
0.091 |
-0.092 |
0.071 |
0.04 |
0.143 |
|
Cash reserve |
0.255 |
-0.181 |
0.779 |
-0.017 |
0.01 |
-0.081 |
0.056 |
-0.065 |
-0.03 |
0.108 |
0.056 |
0.779 |
|
Food reserve |
0.105 |
0.07 |
0.823 |
0.157 |
0.017 |
0.049 |
-0.143 |
0.069 |
0.062 |
0.119 |
-0.006 |
0.823 |
|
Corru- gated iron sheet |
0.093 |
0.517 |
0.159 |
0.22 |
-0.011 |
0.319 |
0.07 |
0.008 |
0.111 |
-0.413 |
0.007 |
0.517 |
|
Informal safety net |
0.165 |
0.128 |
-0.142 |
-0.064 |
-0.087 |
-0.059 |
0.07 |
-0.273 |
-0.004 |
-0.643 |
-0.086 |
0.128 |
|
Farming experi- ences |
0.688 |
-0.092 |
0.158 |
0.146 |
0.075 |
-0.299 |
0.108 |
0.119 |
0.077 |
-0.154 |
0.019 |
0.158 |
|
Natural resourc- es |
0.641 |
-0.256 |
0.398 |
0.115 |
-0.033 |
-0.016 |
0.161 |
-0.135 |
0.077 |
0.019 |
0.023 |
0.641 |
|
Rela- tives in commu- nity |
0.134 |
-0.187 |
0.256 |
0.022 |
-0.143 |
0.47 |
0.108 |
-0.312 |
0.118 |
-0.131 |
0.187 |
0.47 |
|
Agri- cultural technol- ogy |
0.691 |
-0.168 |
0.076 |
0.131 |
0.275 |
0.084 |
-0.171 |
0.045 |
0.252 |
-0.063 |
-0.146 |
0.691 |
|
Farmers exten- sion |
0.58 |
0.228 |
0.038 |
-0.028 |
0.217 |
-0.157 |
-0.146 |
0.013 |
0.236 |
-0.103 |
-0.176 |
0.58 |
|
Access to sav- ings |
0.159 |
-0.205 |
-0.054 |
0.143 |
0.7 |
0.044 |
0.079 |
0.204 |
0.188 |
-0.064 |
0.032 |
0.7 |
|
Credit service |
0.133 |
0.166 |
0.164 |
-0.085 |
0.037 |
0.144 |
0.049 |
-0.235 |
0.098 |
0.648 |
-0.132 |
0.648 |
|
Live- stock in TLU |
0.627 |
-0.107 |
0.009 |
-0.046 |
0.119 |
0.314 |
-0.14 |
0.125 |
0.061 |
0.156 |
0.282 |
0.314 |
|
Total income |
0.398 |
0.099 |
-0.002 |
0.594 |
0.036 |
0.164 |
-0.066 |
0.131 |
0.004 |
-0.044 |
0.157 |
0.594 |
|
Total asset |
0.137 |
0.155 |
0.034 |
-0.141 |
-0.064 |
0.113 |
0.078 |
0.733 |
-0.071 |
0.008 |
0.013 |
0.733 |
|
Gender equality |
-0.114 |
0.109 |
0.099 |
-0.08 |
0.126 |
0.263 |
0.005 |
0.102 |
-0.011 |
-0.178 |
0.722 |
0.126 |
|
Average |
0.14447 |
0.09975 |
0.06019 |
0.01797 |
0.08959 |
0.06503 |
0.03047 |
0.0475 |
0.03003 |
0.01703 |
0.04069 |
0.3993 |
Table 9: Rotated Component Matrix Adaptive Capacity Variables for PSNP Households
|
|
Component |
||||||||||
|
Adaptive capacity Variables |
1 |
2 |
3 |
4 |
5 |
6 |
7 |
8 |
9 |
10 |
PCA |
|
School years |
-0.227 |
0.274 |
-0.148 |
-0.392 |
-0.013 |
0.058 |
0.562 |
0.267 |
-0.032 |
-0.1 |
0.562 |
|
Farmland size |
0.027 |
0.286 |
0.262 |
-0.071 |
0.33 |
-0.288 |
-0.11 |
0.286 |
-0.297 |
0.171 |
0.33 |
|
Bonding social capital |
0.359 |
-0.095 |
0.093 |
0.047 |
0.666 |
-0.044 |
-0.217 |
-0.045 |
-0.041 |
0.011 |
0.666 |
|
Access to institu- tions |
0.034 |
-0.088 |
0.009 |
-0.068 |
0.773 |
0.201 |
0.098 |
-0.044 |
0.121 |
-0.077 |
0.201 |
|
Health insurance |
0.084 |
0.15 |
0.722 |
-0.019 |
0.127 |
0.212 |
-0.028 |
0.063 |
-0.202 |
0.038 |
0.722 |
|
Climate and market |
0.152 |
0.171 |
0.072 |
-0.13 |
-0.099 |
0.419 |
-0.017 |
0.306 |
0.068 |
-0.381 |
0.419 |
|
Land under irrigation |
0 |
0.554 |
0.031 |
0.133 |
-0.17 |
0.335 |
-0.086 |
0.124 |
0.104 |
-0.104 |
0.554 |
|
Primary school |
0.023 |
0.03 |
0.054 |
0.058 |
0.175 |
0.734 |
0.001 |
-0.11 |
-0.053 |
0.131 |
0.734 |
|
Weath- ered roads |
0.644 |
0.115 |
0.246 |
0.063 |
0.206 |
-0.188 |
-0.27 |
0.053 |
0.182 |
-0.037 |
0.644 |
|
Livestock veteri- nary |
-0.864 |
0.078 |
-0.107 |
0.052 |
-0.054 |
-0.145 |
-0.048 |
0.005 |
-0.029 |
-0.027 |
-0.145 |
|
Food and nonfood market |
-0.505 |
0.605 |
-0.295 |
-0.068 |
-0.072 |
0.091 |
-0.038 |
0.081 |
0 |
-0.042 |
0.605 |
|
Health and nutri- tion |
0.065 |
-0.041 |
-0.001 |
0.015 |
-0.062 |
0.097 |
-0.022 |
0.082 |
0.216 |
0.837 |
0.837 |
|
Piped water |
-0.1 |
0.184 |
-0.23 |
0.136 |
0.252 |
-0.013 |
0.296 |
-0.581 |
-0.081 |
0.154 |
0.296 |
|
Electric- ity |
-0.241 |
0.449 |
-0.523 |
0.078 |
-0.005 |
0.419 |
-0.042 |
0.111 |
0.227 |
-0.071 |
-0.523 |
|
Network coverage |
0.026 |
0.011 |
-0.08 |
0.793 |
0.075 |
0.306 |
0.088 |
0.039 |
-0.076 |
-0.009 |
0.088 |
|
Cash reserve |
0.811 |
-0.084 |
0.093 |
0.034 |
0.028 |
0.007 |
0.12 |
0.183 |
0.006 |
-0.009 |
0.811 |
|
Food com- modity reserve |
0.59 |
0.451 |
-0.129 |
-0.16 |
-0.014 |
0.248 |
0.112 |
-0.014 |
-0.017 |
0.01 |
0.59 |
|
Corrugat- ed iron sheet |
-0.049 |
0.68 |
0.057 |
0 |
0.131 |
0.117 |
0.116 |
-0.059 |
-0.08 |
-0.051 |
0.68 |
|
Informal safety net |
0.104 |
0.081 |
0.08 |
0.774 |
-0.093 |
-0.165 |
0.057 |
-0.01 |
0.093 |
0.037 |
0.104 |
|
Farming experi- ences |
0.316 |
0.117 |
0.622 |
0.248 |
-0.041 |
-0.092 |
0.29 |
0.073 |
0.215 |
-0.165 |
0.622 |
|
Natural resources |
0.732 |
-0.123 |
0.037 |
0.113 |
-0.022 |
0.146 |
-0.107 |
-0.072 |
-0.162 |
0.156 |
0.156 |
|
Relatives in com- munity |
0.154 |
-0.075 |
0.138 |
0.222 |
-0.057 |
-0.032 |
0.795 |
-0.091 |
-0.02 |
0.001 |
0.795 |
|
Agri- cultural technolo- gies |
0.812 |
0.034 |
0.236 |
0.145 |
0.076 |
-0.139 |
-0.046 |
-0.112 |
-0.07 |
-0.184 |
0.236 |
|
Farmers extension service |
0.541 |
0.562 |
0.08 |
0.127 |
0.099 |
-0.155 |
0.044 |
0.051 |
-0.176 |
-0.137 |
0.541 |
|
Access to savings |
0.275 |
0.608 |
-0.086 |
-0.18 |
-0.009 |
-0.154 |
-0.051 |
0.272 |
0.099 |
-0.122 |
0.608 |
|
Credit service |
-0.011 |
0 |
-0.026 |
0.084 |
0.148 |
-0.056 |
-0.08 |
0.005 |
0.745 |
0.195 |
0.745 |
|
Livestock in TLU |
0.481 |
0.441 |
0.396 |
-0.162 |
0.008 |
-0.143 |
-0.218 |
-0.001 |
0.135 |
0.112 |
0.481 |
|
Total amount of in- come |
0.491 |
0.153 |
-0.191 |
0.082 |
0.155 |
-0.072 |
0.16 |
0.145 |
-0.066 |
0.093 |
0.491 |
|
Total asset |
0.119 |
0.579 |
0.207 |
-0.068 |
-0.232 |
-0.039 |
-0.137 |
-0.016 |
-0.162 |
0.307 |
0.579 |
|
Gender equality |
0.009 |
0.07 |
-0.042 |
0.083 |
0.037 |
-0.042 |
0.102 |
0.788 |
-0.028 |
0.11 |
0.11 |
|
Average |
0.15163 |
0.19303 |
0.04928 |
0.06153 |
0.07322 |
0.05072 |
0.04138 |
0.05559 |
0.01934 |
0.02647 |
0.4513 |
Table 10: Rotated Component Matrix Adaptive Capacity Variables for Non-PSNP Households
|
|
Component |
|
|||
|
Exposure Variables |
1 |
2 |
3 |
4 |
PCA |
|
Drought |
0.626 |
0.183 |
-0.082 |
-0.09 |
0.626 |
|
Flood |
0.746 |
0.022 |
0.295 |
0.031 |
0.746 |
|
Locust |
0.312 |
0.72 |
0.311 |
0.132 |
0.72 |
|
Fall worm |
-0.193 |
0.193 |
0.544 |
-0.105 |
0.544 |
|
Hailstorm |
0.203 |
-0.175 |
0.825 |
0.082 |
0.825 |
|
Livestock |
0.694 |
-0.005 |
-0.493 |
-0.043 |
0.694 |
|
Human disease |
0.012 |
0.919 |
-0.159 |
0.003 |
0.919 |
|
Temperature (oC) |
-0.031 |
0.096 |
0.023 |
0.791 |
0.791 |
|
Rainfall (ml) |
-0.043 |
-0.023 |
-0.036 |
0.815 |
0.815 |
|
Sum |
2.326 |
1.93 |
1.228 |
1.616 |
6.68 |
|
Average |
0.258444 |
0.214444 |
0.136444 |
0.179556 |
0.742222 |
Table 11: Rotated Component Matrix for Exposure Variables for Combined Households
|
|
Component |
|
|||
|
Exposure Variables |
1 |
2 |
3 |
4 |
PCA |
|
Drought |
0.095 |
0.48 |
-0.062 |
0.496 |
0.496 |
|
Flood |
0.317 |
0.748 |
-0.002 |
0.019 |
0.748 |
|
Locust |
0.369 |
0.202 |
0.451 |
-0.477 |
0.451 |
|
Fall worm |
0.15 |
-0.056 |
0.14 |
0.792 |
0.15 |
|
Hailstorm |
0.885 |
-0.084 |
-0.007 |
0.192 |
0.885 |
|
Livestock disease |
-0.299 |
0.82 |
-0.087 |
-0.125 |
0.82 |
|
Human disease |
-0.895 |
-0.126 |
0.047 |
0.015 |
0.047 |
|
Temperature (oC) |
-0.123 |
-0.084 |
0.743 |
0.127 |
0.743 |
|
Rainfall (ml) |
0.043 |
-0.04 |
0.782 |
-0.037 |
0.782 |
|
Sum |
0.542 |
1.86 |
2.005 |
1.002 |
5.122 |
|
Average |
0.060222 |
0.206667 |
0.222778 |
0.111333 |
0.569111 |
Table 12: Rotated Component Matrix for Exposure Variables for PSNP Households
|
|
Component |
|
|||
|
Exposure Variables |
1 |
2 |
3 |
4 |
PCA |
|
Drought |
0.775 |
0.068 |
-0.096 |
0.08 |
0.775 |
|
Flood |
0.156 |
0.446 |
0.11 |
0.708 |
0.708 |
|
Locust |
0.134 |
0.805 |
-0.084 |
-0.152 |
0.805 |
|
Fall worm |
-0.693 |
-0.018 |
-0.055 |
0.265 |
0.265 |
|
Hailstorm |
-0.209 |
0.792 |
0.05 |
0.091 |
0.792 |
|
Livestock |
0.711 |
-0.23 |
0.059 |
0.415 |
0.711 |
|
Human disease |
0.098 |
0.34 |
0.169 |
-0.656 |
-0.656 |
|
Temperature (oC) |
0.005 |
0.117 |
0.803 |
-0.039 |
0.803 |
|
Rainfall (ml) |
-0.021 |
-0.131 |
0.833 |
-0.011 |
0.833 |
|
Average |
0.106222 |
0.243222 |
0.198778 |
0.077889 |
0.559556 |
Table 13: Rotated Component Matrix for Exposure Variables for Non-PSNP Households
|
|
Component |
|
|||
|
Sensitivity Variables |
1 |
2 |
3 |
4 |
PCA |
|
Age of HH |
-0.001 |
-0.701 |
-0.019 |
-0.086 |
-0.701 |
|
Sex of head HH |
-0.004 |
-0.046 |
-0.021 |
0.908 |
0.908 |
|
Household size |
-0.004 |
-0.095 |
0.844 |
-0.275 |
0.844 |
|
Dependency ratio |
0.161 |
0.149 |
0.744 |
0.362 |
0.744 |
|
Land degradation |
-0.836 |
0.064 |
-0.014 |
0.042 |
-0.836 |
|
Slope ≥ 15% |
0.263 |
-0.502 |
-0.078 |
-0.118 |
-0.502 |
|
Soil infertility |
0.912 |
-0.057 |
0.086 |
0.018 |
0.912 |
|
Vegetation degradation |
0.916 |
-0.044 |
0.059 |
0.071 |
0.916 |
|
Soil erosion |
0.18 |
0.615 |
-0.061 |
-0.092 |
0.615 |
|
Landslide |
-0.315 |
0.643 |
0.011 |
-0.27 |
0.643 |
|
Average |
0.2272 |
0.2026 |
0.4551 |
0.456 |
0.3543 |
Table 14: Rotated Component Matrix for Sensitivity Variables for Combined Households
|
|
Component |
|
|
|||
|
Sensitivity Variables |
1 |
2 |
3 |
4 |
Sum |
PCA |
|
Age of household |
-0.073 |
0.052 |
0.846 |
-0.064 |
0.761 |
0.846 |
|
Sex of household |
0.019 |
0.075 |
0.106 |
0.891 |
1.091 |
0.891 |
|
Household size |
0.18 |
0.618 |
0.192 |
-0.443 |
0.547 |
0.618 |
|
Dependency ration |
0.251 |
0.753 |
0.062 |
0.08 |
1.146 |
0.753 |
|
Land degradation |
-0.782 |
0.116 |
-0.087 |
0.059 |
-0.694 |
-0.782 |
|
Slope ≥ 15% |
0.324 |
-0.447 |
0.408 |
0.008 |
0.293 |
0.408 |
|
Soil infertility |
0.889 |
0.101 |
0.099 |
-0.01 |
1.079 |
0.889 |
|
Vegetation degradation |
0.915 |
0.112 |
0.044 |
0.07 |
1.141 |
0.915 |
|
Soil erosion |
-0.21 |
0.554 |
-0.241 |
0.1 |
0.203 |
0.554 |
|
Landslide |
-0.296 |
0.13 |
-0.651 |
-0.293 |
-1.11 |
0.13 |
|
Average |
0.1217 |
0.2064 |
0.0778 |
0.0398 |
0.4457 |
0.5222 |
Table 15: Rotated Component Matrix for Sensitivity Variables for PSNP Households
|
|
Component |
|
|||
|
Sensitivity Variables |
1 |
2 |
3 |
4 |
PCA |
|
Age of HH |
-0.011 |
-0.745 |
-0.181 |
-0.036 |
-0.745 |
|
Sex of head HH |
0.031 |
-0.054 |
0.837 |
-0.279 |
0.837 |
|
Household size |
-0.029 |
0.086 |
0 |
0.861 |
0.861 |
|
Dependency ration |
0.093 |
0.138 |
0.717 |
0.417 |
0.717 |
|
Land degradation |
-0.882 |
0.068 |
-0.016 |
-0.101 |
-0.882 |
|
Slope ≥ 15% |
0.127 |
-0.401 |
-0.058 |
0.457 |
0.457 |
|
Soil infertility |
0.936 |
-0.062 |
0.052 |
0.025 |
0.936 |
|
Vegetation degradation |
0.913 |
-0.108 |
0.064 |
-0.05 |
0.913 |
|
Soil erosion |
-0.003 |
0.587 |
0.001 |
0.012 |
0.587 |
|
Landslide |
-0.291 |
0.677 |
-0.205 |
-0.045 |
0.677 |
Table 16: Rotated Component Matrix for Sensitivity Variables for Non-PSNP Households
|
Variable |
Slope (Rate of Change) |
Intercept |
R-squared |
p-value |
Interpretation |
|
Mean Annual Temperature |
0.02 °C/year |
-20.5 |
0.85 |
< 0.05 |
Significant increasing trend over time |
|
Annual Rainfall |
1.5 mm/year |
-2000 |
0.45 |
< 0.05 |
Significant increasing trend over time |
Table 17: Trend Analysis (Linear Regression)
|
Variable |
Standard Deviation |
Coefficient of Variation (CV) |
Interpretation |
|
Mean Annual Temperature |
0.5 °C |
2.5% |
Low variability in temperature |
|
Annual Rainfall |
200 mm |
20% |
High variability in rainfall |
Table 18: Variability Analysis
|
Variable |
Trend Direction |
p-value |
Interpretation |
|
Mean Annual Temperature |
Increasing |
< 0.05 |
Significant increasing trend |
|
Annual Rainfall |
Increasing |
< 0.05 |
Significant increasing trend |
Table 19: Change Point Analysis (Mann-Kendall Test)
|
Variable |
Change Point Year |
p-value |
Interpretation |
|
Mean Annual Temperature |
1998 |
< 0.05 |
Significant change point detected |
|
Annual Rainfall |
2005 |
< 0.05 |
Significant change point detected |
Table 20: Pettitt Test (Change Point Detection)