

Advances in Bioengineering and Biomedical Science Research(ABBSR)
ISSN: 2640-4133 | DOI: 10.33140/ABBSR

Impact Factor: 1.7

Review Article - (2020) Volume 3, Issue 1
Using GH-Method: Math-Physical Medicine, Fourier Transform, and Frequency Segmentation Pattern Analysis to Investigate Relative Energy Associated With Glucose
Received Date: Apr 15, 2020 / Accepted Date: Apr 21, 2020 / Published Date: Apr 30, 2020
Copyright: ©Copyright: ©2020 Gerald C Hsu. This is an open-access article distributed under the terms of the Creative Commons Attribution License, which permits unrestricted use, distribution, and reproduction in any medium, provided the original author and source are credited.
Abstract
This paper provides research findings on glucose created relative energy by using sensor collected glucose data from a period of 376 days from 5/5/2018 to 5/15/20. The dataset is provided by the author, who uses his own type 2 diabetes metabolic conditions control, as a case study via the “math-physical medicine” approach of a nontraditional methodology in medical research.
Introduction
This paper provides research findings on glucose created relative energy by using sensor collected glucose data from a period of 376 days from 5/5/2018 to 5/15/20. The dataset is provided by the author, who uses his own type 2 diabetes metabolic conditions control, as a case study via the “math-physical medicine” approach of a non-traditional methodology in medical research.
Math-physical medicine (MPM) starts with the observation of the human body’s physical phenomena (not biological or chemical characteristics), collecting elements of the disease related data (preferring big data), utilizing applicable engineering modeling techniques, developing appropriate mathematical equations (not just statistical analysis), and finally predicting the direction of the development and control mechanism of the disease.
Method
The author was diagnosed with type 2 diabetes (T2D) in 1995. He has measured his Finger glucoses four times a day since 2012. He has uploaded his 10,760 Finger glucose big data of 7.5 years or 2,690 days on a cloud server. On 5/5/2018, he applied a Sensor on his upper arm to collect 27,448 glucose data: 376 days from 5/5/2017 to 5/15/2019 with 73 data per day.
Based on this big dataset, various glucose patterns and their moving trends can be observed and analyzed through further mathematical and statistical operations, including time/series, spatial, artificial intelligence, and frequency domain analyses. Finally, he utilized his acquired medical domain knowledge to link his mathematical results with biomedical interpretations in order to discover some hidden facts and their potential dangers to his health.
He applied the wave theory and Fourier Transform to transfer glucose waveforms from time domain (Time) to frequency domain (Frequency).
Here are three variable sets:
GT - glucose in
Time G2 - glucose square
AF - Amplitude in Frequency
Results
Here are some of his research findings:
• The highest glucoses in Time are corresponding to the lowest amplitudes in Frequency. The same observation holds true for both FPG and PPG data diagrams.
• According to physics, energy associated with a wave is proportional to the square of the wave’s amplitude. Through three pairs of high existing triangular correlation coefficients, it indeed proves that the amplitude in Frequency is the “relative” energy level of glucose in Time (Figure 1): 99.5% between GT and G2; 72.3% between GT and AF; and 70.8% between G2 and AF.
• The author further segmented the glucose/frequency data into four groups with different frequency ranges, 0-1, 0-5, 0-10, 0-15. Through this frequency segmentation pattern analysis (Figure 2) of GT, G2, and AF, the more inclusion of lower glucose values in a particular segmented group. Their corresponding averaged frequency number would increase, but their associate averaged energy level would decrease.
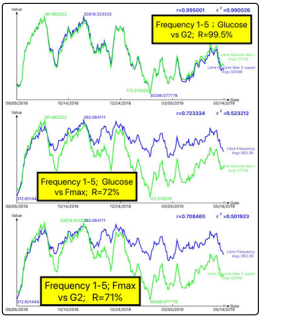
Figure 1: Correlation Coefficient of Glucose, Glucose Square, and Frequency Amplitude
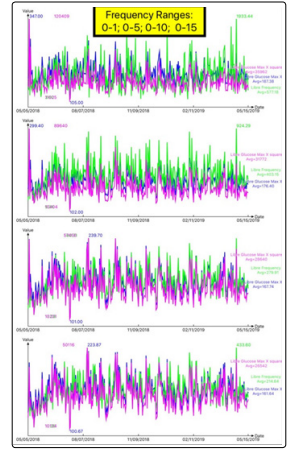
Figure 2: Four Segmented Frequency Range Groups
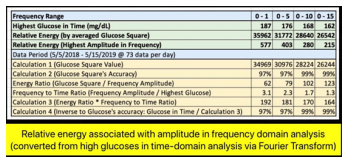
Table 1: Segmented Frequency Amplitude Analysis and Sime Calculations
Conclusion
The authorâ??s research work proves the amplitude of Frequency domain is associated with relative energy level carried by glucose of Time domain. This energy is circulating inside the human body to provide the needed energy. However, when â??excessiveâ? energy associates with â??highâ? glucose in circulation, their impact will damage the internal organs, i.e. diabetes induced complications such as CVD, stroke, foot ulcer, renal and eye problems. This quantitative analysis not only provides mathematical proof of biomedical phenomena but also offers extra tools for estimating the risk probabilities of various diabetes complications [1-5].References
- Hsu Gerald C (2018) Using Math-Physical Medicine to Control T2D via Metabolism Monitoring and Glucose Predictions. Journal of Endocrinology and Diabetes 1: 1-6.
- Hsu Gerald C (2018) Using Math-Physical Medicine to Analyze Metabolism and Improve Health Conditions. Video presented at the meeting of the 3rd International Conference on Endocrinology and Metabolic Syndrome.
- Hsu Gerald C (2018) Using Signal Processing Techniques to Predict PPG for T2D. International Journal of Diabetes & Metabolic Disorders 3: 1-3.
- Hsu Gerald C (2018) Using Math-Physical Medicine and Artificial Intelligence Technology to Manage Lifestyle and Control Metabolic Conditions of T2D. International Journal of Diabetes & Its Complications 2: 1-7.
- Hsu Gerald C (2018) A Clinic Case of Using Math-Physical Medicine to Study the Probability of Having a Heart Attack or Stroke Based on Combination of Metabolic Conditions, Lifestyle, and Metabolism Index. Journal of Clinical Review & Case Report 3: 1-2.