
World Journal of Forest Research(WJFR)
ISSN: 2994-5569 | DOI: 10.33140/WJFR


Research Article - (2026) Volume 5, Issue 1
Use of Drones for Estimating Biodiversity, Structural Parameters, and Woody Carbon Storage in Sahelian Ecosystems of Senegal
2International Human–Environment Observatory of Tessékéré, CNRS / Cheikh Anta Diop University of Daka, Senegal
3Department of Agroforestry, Assane Seck University of Ziguinchor, Senegal
Received Date: Nov 06, 2025 / Accepted Date: Dec 08, 2025 / Published Date: Jan 22, 2026
Copyright: ©2026 Diara Sylla, et al. This is an open-access article distributed under the terms of the Creative Commons Attribution License, which permits unrestricted use, distribution, and reproduction in any medium, provided the original author and source are credited.
Citation: Talla, R., Sylla, D., Faye, N., Sagna, M. B., Diallo, A, et al. (2026). Use of Drones for Estimating Biodiversity, Structural Parameters, and Woody Carbon Storage in Sahelian Ecosystems of Senegal. World J Forest Res, 5(1), 01-11.
Abstract
Sahelian ecosystems play a crucial role in climate regulation, particularly through their capacity to store atmospheric carbon. However, their carbon sequestration potential remains poorly quantified due to the high cost and logistical constraints of conventional field-based methods. This study investigates the use of low-cost unmanned aerial vehicles (UAVs) to assess dendrometric parameters and estimate the carbon storage capacity of woody vegetation within a 10-hectare Sahelian plot in Senegal. High-resolution aerial imagery was acquired using a DJI Phantom 4 Pro+ drone and processed with photogrammetric software. Tree height and crown diameter were extracted and validated using field measurements, showing a strong correlation for tree height (R2 = 0.94) and a moderate correlation for crown diameter (R2 = 0.74). Spectral index analysis enabled the identification of dominant woody species, including Balanites aegyptiaca, Sclerocarya birrea, Acacia raddiana, and Acacia senegal.The results indicate that Balanites aegyptiaca contributes the highest amount of carbon storage per hectare (1520.76 ± 185.5 kg ha−1), mainly due to its high stem density (23.3 individuals ha−1), whereas Sclerocarya birrea exhibits the highest average carbon stock per individual tree (206.8 ± 107.8 kg). These findings highlight the significant role of these species in climate change mitigation strategies. By demonstrating the effectiveness of low-cost UAVs for rapid and non-destructive assessment of Sahelian ecosystems, this study provides a promising approach for large-scale ecological monitoring and sustainable natural resource management. It also identifies methodological improvements required to enhance crown dimension estimates. Overall, this UAV- based approach represents a reliable alternative to destructive methods and is well suited to the ecological and operational challenges of Sahelian environments, with strong potential for application in similar regions.
Keywords
Sahelian Ecosystems, UAVs, Biodiversity, Dendrometric Parameters, Carbon Sequestration
Introduction
Sahelian ecosystems constitute major carbon reservoirs and play a critical role in climate regulation and ecological resilience. These environments also support human livelihoods by providing a wide range of ecosystem services, including timber production, fuelwood supply, and carbon storage [1-3]. However, an accurate assessment of these services requires rigorous quantification of tree volume and biomass, which is a key component of climate change mitigation efforts [4,5]. In Senegal, Sahelian zones host several key woody species such as Balanites aegyptiaca, Acacia tortilis, Acacia senegal, Sclerocarya birrea, and Boscia senegalensis. These species play a fundamental role in reforestation initiatives and carbon sequestration programs [6,7]. Moreover, their increased productivity in restored ecosystems enhances their capacity to capture and store atmospheric carbon [8]. Aboveground biomass is therefore a key indicator for assessing carbon storage potential in Sahelian ecosystems, as it contributes significantly to the mitigation of greenhouse gas emissions [4]. Nevertheless, biomass data collection remains challenging due to the heterogeneous and highly dynamic nature of these environments, where biomass can vary considerably over time [9].
Despite their ecological importance, Sahelian ecosystems have received far less scientific attention than tropical forests. This lack of focus has resulted in a scarcity of data on biomass dynamics, thereby limiting the development of robust models, particularly those relying on satellite-based observations [10,11].
Traditional approaches for estimating aboveground biomass often rely on destructive sampling methods, targeting specific species such as A. senegal, B. aegyptiaca, A. raddiana, S. birrea, and B. senegalensis [8,12,13]. Although these methods are considered reliable, they are constrained by high costs, time-consuming fieldwork, and their negative impacts on ecosystems. In response to these limitations, non-destructive approaches—particularly those based on remote sensing—offer promising alternatives.
Unmanned aerial vehicles (UAVs), combined with photogrammetric techniques, enable the acquisition of accurate three-dimensional data on tree structure [14,15]. Advanced algorithms such as Structure from Motion (SfM) allow rapid and cost-effective processing of these data while preserving ecosystem integrity [16,17].
UAV-based approaches offer several advantages over conventional satellite imagery, which is often constrained by cloud cover. UAVs can capture ultra-high-resolution imagery, facilitating the estimation of key structural parameters such as tree height and vegetation cover [18]. As a result, they provide improved characterization of woody stands and contribute to sustainable resource management and the conservation of Sahelian ecosystems.
Objectives of the Study
General Objective
To develop an efficient and accessible methodology for assessing structural parameters and carbon sequestration capacity of Sahelian ecosystems using unmanned aerial vehicles (UAVs).
Specific Objectives
1. To estimate key dendrometric parameters (tree height and crown diameter) of the main Sahelian woody species using UAV-derived data.
2. To validate UAV-based estimates through comparison with field measurements in order to assess their accuracy and reliability.
3. To identify dominant woody species within the study area using drone-derived data and spectral indices.
4. To quantify aboveground biomass and carbon storage of major woody species using appropriate allometric models.
5. To evaluate the performance of low-cost UAVs as an operational tool for monitoring woody vegetation structure and carbon stocks in Sahelian ecosystems for monitoring Sahelian ecosystems, while identifying methodological limitations and potential avenues for improvement.
Methodology
Sampling Framework and Selection of the Study Site
The selection of the study site was carried out using a systematic approach based on remote sensing tools. Prior to fieldwork, site identification relied on the analysis of satellite imagery available through Google Earth (Google, 2015). A representative 10-hectare study area was accurately delineated and georeferenced using these images (Figure 1).
The choice of the sampling site was guided by the high abundance of Sclerocarya birrea and Boscia senegalensis, two key species within the studied stand, as well as by the heterogeneity of their spatial distribution.

Figure 1: Location of the Study Area
UAV Image Acquisition
For this study, a DJI Phantom 4 Pro+ fixed-wing UAV (EU version) was used. This platform, widely recognized for its positional accuracy and high-quality image acquisition capabilities, enabled efficient coverage of the study area. Flight mission preparation was conducted using a ground control station. Key flight parameters were defined in advance, including the delineation of a rectangular flight area, a flight altitude ranging between 100 and 750 m above ground level to ensure adequate spatial coverage and image resolution, an image overlap set at 70% to guarantee sufficient correlation between successive images and enhance the quality of the generated models, as well as the take-off and landing direction to optimize operational efficiency. Flight plans were prepared using the Pix4Dcapture application (Pix4D SA, Lausanne, Switzerland), installed on an iPad Air. UAV flights were conducted during the month of August, starting each day at 10:00 a.m. (GMT+2) in order to benefit from optimal lighting conditions. This time window was selected to minimize shadow effects that could adversely affect data accuracy.
The UAV was launched from a ground control point located at the center of the study area. For the initial flight, the altitude was set at 50 m, corresponding to approximately 30 m above the canopy, in order to obtain very high spatial resolution while maintaining strong image correspondence [19,20,21,22]. Each flight covered a stereoscopic area exceeding 100 ha per plot. The 70% image overlap enabled the generation of a high-quality Digital Surface Model (DSM), which is essential for detailed characterization of tree structures and Sahelian woody stands.
Photogrammetric Image Processing and Validation of Dendrometric Attributes
Acquisition and Processing of Aerial Images
A total of 3,048 aerial photographs were acquired over a 10-hectare plot using the UAV. These images were processed using Agisoft Metashape software, resulting in the generation of three main products [23]:
• a Digital Terrain Model (DTM), representing the bare ground surface without vegetation;
• a Digital Surface Model (DSM), integrating both ground and vegetation elements;
• a high-resolution orthomosaic, used for visualization and spatial analysis of the entire plot.
• The difference between the DSM and the DTM was used to generate a Canopy Height Model (CHM), which served as the basis for analyzing tree structural characteristics, including tree height and crown delineation.
Extraction and Analysis of Dendrometric Data
Tree height and crown dimensions were estimated following the methodology described by Mohan et al. [24]. The study area was divided into a grid of 25 m × 25 m cells, from which 10% were randomly selected to represent the entire plot.
Automated individual tree detection (ITD) was performed by identifying local maxima within the CHM. These maxima, corresponding to tree apices, were detected using a morphological filter (focal filter) implemented in ArcGIS 10.4.1 [25].
Tree crowns were delineated using the watershed segmentation algorithm implemented in SAGA GIS v.5.0.0. This topology- based approach simulates a flooding process to identify crown boundaries [26]. The resulting crown delineations were converted into georeferenced polygon features in ArcGIS, with each tree assigned a unique identifier.
Validation of Results
A visual validation was conducted by a forestry expert. Tree crowns were manually delineated on the orthomosaic using ArcGIS 10.4.1, allowing comparison between automated detection outputs and manual interpretations. This validation step helped reduce potential errors related to misclassification or omission in the automated crown detection process.
Statistical Validation Analysis
The dendrometric parameters extracted from the Canopy Height Model (CHM) were compared with field measurements collected from a sample of 92 trees. Linear regression analysis was performed to assess the relationship between UAV-derived estimates (tree height and crown diameter) and ground-based reference data.
Two key statistical indicators were used to evaluate the accuracy of the estimates:
• Coefficient of determination (R²): measures the strength of the relationship between estimated values and field observations.
• Root Mean Square Error (RMSE): quantifies both absolute and relative deviations between the two datasets. The results of this analysis were used to validate the methodology and to assess the accuracy of dendrometric parameters derived from photogrammetric data.
Field Inventories
A complete census survey was conducted over the 10-hectare plot [27]. All trees with a diameter at breast height (DBH) greater than or equal to 3.5 cm were recorded. The collected field data included GPS coordinates, diameter at breast height (DBH), total tree height (H), crown diameters (d1and d2, and tree status (alive or dead).
Crown surface area was calculated using the following equation
:Sh = [π (d1. d2)]/4
where:
• ShS_hSh is the crown surface area projected on the ground (m²);
• d1d_1d1 is the north–south crown diameter (m);
• d2d_2d2 is the east–west crown diameter (m).
These field measurements were used to calibrate UAV-derived models and to validate estimates of aboveground biomass and carbon storage.
Validation of Tree Height and Crown Diameter Estimates
To ensure the reliability of tree height and crown diameter estimates derived from the Canopy Height Model (CHM), a statistical validation was conducted using field reference data. This validation procedure consisted of two main steps.
Georeferencing of Reference Trees
Trees measured in the field were accurately georeferenced, allowing their spatial coordinates to be matched with corresponding CHM- derived points. These spatial correspondences were used to validate UAV-based estimates of tree height and crown dimensions.
Selection of Validated Trees
Among all inventoried trees, only 92 individuals with complete field-measured height data were retained for the validation analysis.
Field measurements were compared with CHM-derived estimates using linear regression analysis, which establishes a quantitative relationship between measured and estimated variables. Model performance was assessed using the following indicators:
• Coefficient of Determination (R²):
Indicates the proportion of variance explained by the model. Higher R² values reflect stronger agreement between estimated and measured data.
• Root Mean Square Error (RMSE):
o Absolute RMSE quantifies the average deviation between estimated and observed values. o Relative RMSE expresses this deviation as a percentage of observed values. The statistical metrics were computed using the following equations:
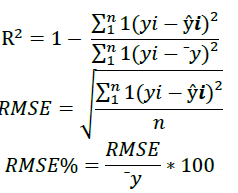
where, for each tree i (from 1 to n), y^i\hat{y}_iy^i represents the tree height or crown diameter predicted by the model (m), yiy_iyi denotes the tree height or crown area measured in the field (m), and y¯\bar{y}y¯ is the mean of the measured tree heights or crown areas (m).”
Species Identification Using UAV-Derived Data
The primary objective of this analysis was to assess the potential of UAV-acquired data for identifying tree species present within the study area.
The extracted variables included crown surface area, tree height, and the crown-to-height ratio, all derived from the three- dimensional model generated from UAV imagery. Three normalized difference color indices (NDIs) were computed using spectral values extracted from UAV images, following the general formula:
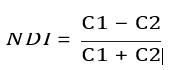
where C1 and C2 represent spectral values of different color channels.
The following indices were calculated:
• NGRDI (Normalized Green–Red Difference Index),
• NBGRI (Normalized Blue–Green Difference Index),
• NBRDI (Normalized Blue–Red Difference Index).
A predictive analysis was conducted using the Random Forest package in R software (version 3.2.3) to classify trees at both species and genus levels and to evaluate the relative importance of predictor variables.
A confusion matrix was generated to assess classification accuracy, enabling robust statistical identification of dominant woody species within the study area.
|
Species |
Multiple regression equations |
R² |
MSE |
RMSE |
AIC |
Reference |
|
Sclerocarya birrea |
Ba = 0.27D² + 4.01Ht² + 8.3D − 30.5Ht + 48.6 |
0.96 |
23,915.2 |
48.9 |
122.16 |
Talla et al. (2020) |
|
|
Ba = −8.23Dh² + 5.57Ht² + 251.2Dh − 86.81Ht − 700.61 |
0.91 |
4,764.6 |
69.0 |
175.62 |
|
|
Boscia senegalensis |
Ba = 2.27DBH² + 1.3Ht² − 4.3DBH − 0.86Ht + 3.9 |
0.89 |
16.41 |
4.05 |
126.98 |
— |
|
Acacia raddiana |
Ba = −15.356 + 6.174•Ht + 0.686•DBH |
0.89 |
88.8 |
4.57 |
72.41 |
Ndiaye et al. (2021) |
|
Acacia senegal |
Ba = 4.525 + 6.360•Ht + 0.3511•DBH |
0.71 |
70.3 |
5.50 |
140.8 |
— |
|
Balanites aegyptiaca |
Ba = 42.114 + 15.110•Ht + 0.152•DBH |
0.81 |
80.8 |
4.52 |
70.1 |
— |
Table 1: List of Allometric Equations Used
The use of UAV-derived data, combined with advanced statistical analyses and allometric equations, enabled the identification of woody species and an accurate assessment of their carbon storage capacity.
Results
Floristic Composition of Woody Species in the Study Area
The species diversity recorded within the study area is distributed across seven botanical families, comprising a total of 348 individual trees. The botanical families and species identified are presented below.
|
Family |
Species |
Number of individuals |
Proportion (%) |
|
Balanitaceae |
Balanites aegyptiaca |
233 |
66.95 |
|
Anacardiaceae |
Sclerocarya birrea |
68 |
19.54 |
|
Malvaceae |
Adansonia digitata |
1 |
0.29 |
|
Combretaceae |
Combretum glutinosum |
5 |
1.44 |
|
Fabaceae |
Acacia tortilis subsp. raddiana |
15 |
4.31 |
|
|
Acacia senegal |
10 |
2.87 |
|
Apocynaceae |
Leptadenia hastata |
1 |
0.29 |
|
|
Leptadenia pyrotechnica |
15 |
4.31 |
Table 2. Floristic List of Woody Species Recorded in the Study Area
Analysis of Confusion Matrices for Species Prediction Using UAV Data
|
Species |
B. aegyptiaca |
S. birrea |
A. raddiana |
C. glutinosum |
A. digitata |
L. pyrotechnica |
L. hastata |
A. senegal |
|
B. aegyptiaca |
85.84 |
8.5 |
0.43 |
4.29 |
0.86 |
0 |
0 |
0 |
|
S. birrea |
7.35 |
83.8 |
0 |
4.41 |
0 |
0 |
0 |
2.90 |
|
A. raddiana |
0 |
0 |
87 |
0 |
0 |
0 |
0 |
13 |
|
C. glutinosum |
0 |
20 |
0 |
80 |
0 |
0 |
0 |
0 |
|
A. digitata |
0 |
100 |
0 |
0 |
0 |
0 |
0 |
0 |
|
L. pyrotechnica |
0 |
0 |
0 |
0 |
0 |
80 |
20 |
0 |
|
L. hastata |
0 |
0 |
0 |
0 |
0 |
50 |
0 |
0 |
|
A. senegal |
0 |
0 |
20 |
0 |
0 |
0 |
0 |
80 |
Table 3 : Confusion Matrix Expressed As Percentages (%)
Species prediction using the Random Forest method based on UAV-derived data was generally satisfactory for dominant species, with classification accuracies exceeding 80%. Among these, Balanites aegyptiaca was correctly identified in 85.84% of cases, Sclerocarya birrea with an accuracy of 83.82%, while Acacia raddiana achieved the highest accuracy at 87%. These results highlight the robustness of the model in discriminating the most abundant species within the study area.
However, significant misclassification errors were observed for certain species. For instance, Combretum glutinosum showed notable confusion with Sclerocarya birrea, with a misclassification rate of 20%. Similarly, Leptadenia pyrotechnica was correctly identified in 80% of cases, while 20% of individuals were misclassified as Leptadenia hastata. The situation was more problematic for Adansonia digitata, which was entirely misclassified as Sclerocarya birrea (100% error). These misclassifications reflect limitations in spectral or structural discrimination for these species
For rare species, model performance was particularly poor. For example, Leptadenia hastata exhibited an accuracy of only 50%, indicating substantial confusion likely driven by its low abundance and potentially similar morphological characteristics to other species.
Overall, while species predictions were reliable for dominant taxa such as Balanites aegyptiaca, Sclerocarya birrea, and Acacia raddiana, persistent confusion affected rare or morphologically similar species, including Combretum glutinosum, Leptadenia pyrotechnica, and Adansonia digitata. These findings suggest that methodological improvements are required to enhance model performance, particularly by increasing sample size and species representation for less abundant taxa.
Validation of Dendrometric Parameters (Tree Height and Crown Diameter)
Tree Height
The mean tree height measured in the field was 7.96 ± 1.90 m, whereas the mean height estimated from the Canopy Height Model (CHM) was 7.60 ± 1.88 m. The average difference between measured and estimated values was −0.30 m, indicating a slight systematic underestimation by the model.
The coefficient of determination (R² = 0.94) demonstrates an excellent correlation between measured and estimated tree heights, confirming that height variability was accurately captured by the CHM. In addition, the centered root mean square error (CRMSE) was 0.44 m, reflecting a low relative error and high precision. The centered mean error (CME) of −0.20 m remained close to zero, further indicating the reliability of the model estimates.
These results show that the CHM provides reliable tree height estimates with sufficient accuracy for operational applications. The mean underestimation of 0.30 m is negligible and does not significantly affect the overall quality of the predictions.
Crown Diameter
The mean crown diameter measured in the field was 10.4 ± 3.0 m, while the CHM-derived estimate was 9.9 ± 2.9 m. The mean difference between these values was −0.48 m, indicating a moderate underestimation by the model.
The coefficient of determination (R² = 0.74) indicates a moderate correlation between measured and estimated crown diameters, reflecting lower accuracy compared to tree height estimation. The centered root mean square error (CRMSE) was 1.48 m, highlighting greater variability in crown diameter estimates. Moreover, the centered mean error (CME) reached 2.19 m, indicating a pronounced underestimation of crown diameters by the model.
Thus, while crown diameter estimates are generally consistent and acceptable for large-scale analyses, they exhibit higher variability and lower precision. This discrepancy may be attributed to methodological limitations or to the structural complexity of tree crowns, which is less effectively captured by UAV-derived data.
Overall, the CHM proved highly effective for estimating tree height, with minimal bias and high accuracy. In contrast, crown diameter estimates were more variable and less precise, although still suitable for operational use. Methodological refinements— such as increased image density or improved segmentation techniques—could further enhance crown estimation accuracy and reduce the observed discrepancies.
Correlation Between Field-Measured Parameters and Model-Based Estimates
Tree Height
The scatter plot illustrates the relationship between field-measured tree heights and heights estimated by the model for the different woody species present in the study area.
The distribution of data points shows a strong linear relationship between observed and predicted tree heights, indicating good agreement between field measurements and UAV-derived estimates across species. Most observations are closely aligned along the 1:1 reference line, suggesting that the model effectively captures height variability within the stand.
Slight deviations from the reference line reflect minor underestimation or overestimation for certain individuals, which may be attributed to species-specific crown architecture, local structural complexity, or limitations inherent to the photogrammetric reconstruction. Nevertheless, the overall pattern confirms the robustness of the model for estimating tree height in Sahelian ecosystems.
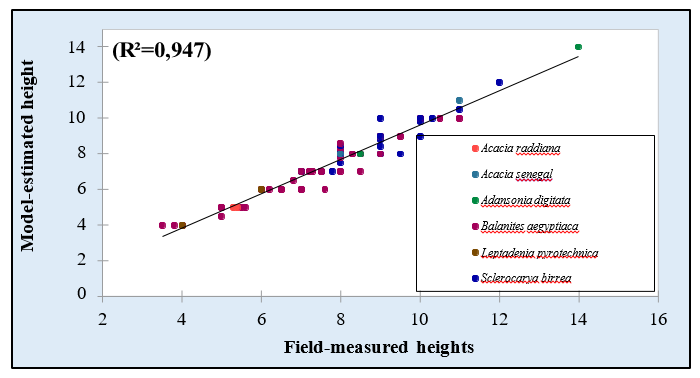
Figure 2: Linear Regression Between UAV-Derived Tree Height Estimates and Field-Measured Heights
The coefficient of determination (R² = 0.947) indicates an excellent correlation between tree heights measured in the field and those estimated by the model. In other words, 94.7% of the variance in observed tree heights is explained by the model predictions, demonstrating a high level of reliability.
This overall performance can be better understood by examining the species-specific distribution of the data, which highlights three main categories:
• Species well fitted by the model
Balanites aegyptiaca (green) and Sclerocarya birrea (blue) show a close agreement between measured and estimated heights, with data points clustered near the regression line. These species are dominant within the study area and benefit from a large sample size, which enhances the accuracy of height estimates.
• Species showing moderate deviations
Tree heights of Acacia raddiana (pink) and Acacia senegal (orange) exhibit moderate deviations from the regression line for some individuals. This variability may reflect species-specific morphological traits that are not fully captured by the model.
• Rare species with increased variability
Rare species such as Adansonia digitata (brown) and Leptadenia pyrotechnica (purple) display greater data dispersion, with noticeable deviations from the regression line. These patterns are likely related to the low number of observed individuals combined with particular morphological characteristics that are less effectively captured by the model.
Overall, the model demonstrates strong performance in estimating tree height, particularly for dominant species such as Balanites aegyptiaca and Sclerocarya birrea. However, the deviations observed for rare or morphologically atypical species, such as Adansonia digitata, highlight the need for increased sample size and further calibration of model parameters to improve estimation accuracy for these specific cases. Such refinements would enhance the applicability of the model across a broader range of species.
Tree Crown Diameter
The scatter plot illustrates the model’s ability to predict crown diameters for different woody species. The distribution of points indicates a generally consistent relationship between field- measured and model-estimated crown diameters, although greater dispersion is observed compared to tree height estimates. This variability reflects the higher structural complexity of tree crowns and the greater sensitivity of crown delineation to photogrammetric and segmentation uncertainties.
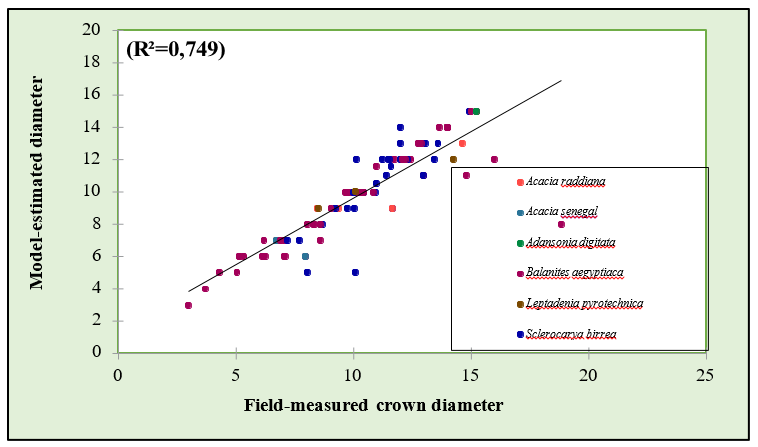
Figure 3: Linear Regression Between UAV-Derived Crown Diameter Estimates and Field-Measured Crown Diameters
The coefficient of determination (R² = 0.749) indicates a moderate to strong correlation between crown diameters measured in the field and those estimated by the model. This result shows that 74.9% of the variance in observed crown diameters is explained by the model predictions, while 25.1% remains unexplained. Although this level of accuracy is generally acceptable, it is lower than that obtained for tree height estimation (R² = 0.947), highlighting the greater complexity involved in modeling tree crowns.
The species-specific distribution of the data reveals three main categories:
• Species well fitted by the model
Species such as Balanites aegyptiaca (light green) and Sclerocarya birrea (blue) exhibit a consistent overall trend, with data points relatively close to the regression line. However, moderate dispersion is observed, particularly for individuals with large crowns (> 12 m).
• Species showing larger deviations
Acacia raddiana (pink) and Acacia senegal (orange) display substantial dispersion, with several points deviating markedly from the regression line. This variability may be attributed to the more complex morphological structure of their crowns or to low sample size, which reduces the robustness of estimates for these species.
• Rare species with increased variability
Less represented species, such as Adansonia digitata (brown) and Leptadenia pyrotechnica (purple), show less reliable predictions. This reduced performance is expected given the limited number of observed individuals and their particular morphological traits, which are not always adequately captured by the model.
Overall, the model demonstrates a reasonable ability to estimate crown diameters, with satisfactory performance for dominant species such as Balanites aegyptiaca and Sclerocarya birrea. However, accuracy decreases for large crowns and for rare or underrepresented species, including Acacia senegal and Adansonia digitata. These limitations suggest that methodological improvements—such as increased data density or more representative sampling—could enhance prediction reliability, particularly for trees with large crown diameters.
Analysis of Carbon Stocks by Species
The analysis of aboveground carbon stocks reveals substantial variability among the studied species, both at the individual tree level and when scaled to density per hectare (Table 4).
|
Species |
Population density (ind ha-¹) |
Mean biomass per tree (kg) |
Mean carbon per tree (kg) |
Carbon stock (kg ha-¹) |
|
Balanites aegyptiaca |
23.3 |
140.7 ± 26.27 |
66.12 ± 12.30 |
1520.76 ± 185.50 |
|
Sclerocarya birrea |
6.8 |
440.2 ± 229.5 |
206.8 ± 107.8 |
1406.24 ± 662.90 |
|
Acacia raddiana |
1.5 |
34.9 ± 8.9 |
16.4 ± 4.2 |
24.60 ± 0.42 |
|
Acacia senegal |
1.0 |
58.6 ± 18.9 |
27.5 ± 12.4 |
27.50 ± 0.12 |
Table 4: Aboveground Biomass and Carbon Stocks of Dominant Woody Species in the Study Area
Mean Carbon Stock per Tree
Sclerocarya birrea stands out as the species with the highest amount of carbon stored per individual, with a mean value of 206.8 ± 107.8 kg. This performance is directly related to its high aboveground biomass. In comparison, Balanites aegyptiaca, although smaller in size, stores an average of 66.12 ± 12.3 kg of carbon per tree. This value remains significant given the high population density of this species within the study area. In contrast, Acacia raddiana and Acacia senegal exhibit much lower mean carbon stocks, with 16.4 ± 4.2 kg and 27.5 ± 12.4 kg of carbon per tree, respectively, reflecting their smaller stature and lower biomass.
Carbon Stock per Hectare
At the hectare scale, Balanites aegyptiaca exhibits the highest carbon stock, reaching 1520.76 ± 185.5 kg ha-¹. This result is primarily driven by its high population density (23.3 individuals ha-¹). Sclerocarya birrea follows closely with a carbon stock of 1406.24 ± 662.9 kg ha-¹, despite its lower density, due to the large individual biomass of its trees. In contrast, the contributions of Acacia raddiana (24.6 ± 0.42 kg ha-¹) and Acacia senegal (27.5 ± 0.12 kg ha-¹) are marginal, owing to their low densities and limited carbon storage capacity.
These results highlight the key role of Balanites aegyptiaca and Sclerocarya birrea in carbon storage at both individual and hectare scales. These two dominant species represent major leverage points for carbon sequestration efforts in Sahelian ecosystems, particularly within reforestation and sustainable land management strategies.
Discussion
This study aimed to assess the potential of low-cost UAVs for estimating tree structural parameters and identifying woody species in a Sahelian savanna ecosystem. The results demonstrate the relevance of UAV-derived data for measuring tree height, crown surface area, and discriminating dominant woody species. These findings are consistent with previous studies conducted in various forest environments, while also highlighting methodological limitations and opportunities for improvement.
Estimation of Key Dendrometric Parameters (Tree Height and Crown Diameter)
Tree height estimation using the Canopy Height Model (CHM) proved to be highly accurate, with a high coefficient of determination (R² = 0.94) and a low centered root mean square error (CRMSE) of only 0.44 m. This strong correlation indicates that the CHM effectively captures tree height variability, particularly for dominant species such as Balanites aegyptiaca and Sclerocarya birrea. Similar results were reported by Lisein et al. (2014), who estimated tree height using UAV photogrammetry with a mean uncertainty of 1.04 m.
In contrast, crown diameter estimates showed greater variability, with an R² of 0.74 and a CRMSE of 1.48 m. Although acceptable, this performance is lower than that obtained for tree height estimation and reflects limitations in the ability of UAV data to fully model crown structural complexity. Comparable findings were reported by Konaté et al. for Sahelian trees, with slightly lower correlations for crown surface estimation (R² = 0.80). These results underscore the need for methodological improvements, such as increased image density or refinements in segmentation algorithms [28].
Validation of UAV-Derived Estimates Against Field Data
Comparisons between field measurements and UAV-derived estimates confirm the overall reliability of the applied methods, particularly for tree height. The slight underestimation observed for both height and crown diameter remains acceptable for large- scale applications. Similar levels of robustness have been reported by Lisein et al. and Birdal et al. in different forest contexts, demonstrating consistent correlations for dendrometric parameters derived from UAV data [29].
Identification of Dominant Woody Species Using UAV Data
The combined use of spectral indices and structural parameters enabledtheidentification of dominantwoody species with accuracies exceeding 80% for Balanites aegyptiaca, Sclerocarya birrea, and Acacia raddiana. However, substantial misclassifications were observed for rare or morphologically similar species, such as Adansonia digitata and Combretum glutinosum. Studies by Konaté et al. and Zarco-Tejada et al. reported similar limitations, showing that UAV-derived spectral indices may be insufficient to discriminate species with closely related spectral signatures, particularly in Sahelian environments [28,30].
Quantification of Biomass and Carbon Storage in Woody Species
Aboveground biomass and carbon stock estimates indicate that Sclerocarya birrea stores the largest amount of carbon per individual tree (206.8 ± 107.8 kg tree⻹), whereas Balanites aegyptiaca, due to its high density, contributes the largest carbon stock per hectare (1520.76 ± 185.5 kg ha⻹). These findings are consistent with those of Faye et al. who emphasized the importance of Sahelian woody species in carbon sequestration, particularly in high-density stands [10].
Evaluation of UAV Performance
The use of low-cost UAVs proved effective for collecting accurate data on tree structure and carbon storage in a Sahelian environment. The performance achieved for tree height and crown diameter estimation is comparable to that reported in other forest ecosystems [29,30]. Nevertheless, the identified limitations— such as crown variability and misclassification of rare species— indicate that methodological refinements are necessary to improve reliability in heterogeneous environments.
Conclusion
This study highlights the potential of low-cost UAVs as reliable and environmentally friendly tools for assessing Sahelian ecosystems, with a particular focus on estimating dendrometric parameters and carbon storage of woody species. Several key conclusions can be drawn: UAV-derived data processed using photogrammetric techniques enabled accurate estimation of tree height (R² = 0.94) and, to a lesser extent, crown diameter (R² = 0.74). These results confirm that UAVs are well suited for rapid, non-destructive assessment of woody stands, even in heterogeneous environments such as Sahelian ecosystems.
The findings demonstrate that Balanites aegyptiaca and Sclerocarya birrea play a central role in carbon sequestration due to their high biomass and/or population density. Balanites aegyptiaca exhibited the highest carbon stock per hectare (1520.76 ± 185.5 kg ha⻹), while Sclerocarya birrea showed the highest individual carbon storage capacity (206.8 ± 107.8 kg tree⻹). These species should therefore be prioritized in reforestation and climate change mitigation strategies.
The use of spectral indices combined with structural parameters (tree height and crown area) enabled acceptable identification of dominant species. However, persistent confusion among rare or morphologically similar species highlights the need for more robust analytical approaches, particularly in more diverse ecosystems.
This UAV-based approach offers a promising alternative to traditional destructive methods, especially for sustainable management of Sahelian ecosystems. The accessibility and ease of use of UAVs make them well suited for repeated monitoring of woody resources in constrained environments.
References
- Houghton, R. A. (2007). Balancing the global carbon budget.Annu. Rev. Earth Planet. Sci., 35(1), 313-347.
- GMV (Global Mechanism of the UNCCD), (2009). Carbon finance in the drylands: An incentive for restoration. Report, UNCCD.
- Akpo, L. E. (1995). Morphology and functioning of woody species in Sahelian ecosystems. Acta Oecologica, 16(5), 493- 510.
- GIEC (Groupe d’experts intergouvernemental sur l’évolutiondu climat), (2007). Quatrième rapport d’évaluation du GIEC: Changements climatiques 2007 –Rapportde synthèse. Cambridge University Press.
- Canadell, J. G., & Raupach, M. R. (2008). Managing forests for climate change mitigation. science, 320(5882), 1456-1457.
- Lucop, S. (2008). Reforestation programs and carbon sequestration potential in Senegal. Forestry Journal, 12(3), 231-245.
- Dia, M., Sambou, B., & Goudiaby, V. A. (2010). Role of Sahelian woody species in carbon storage: Case study in Senegal. African Journal of Ecology, 48(1), 50-58.
- Talla, F. (2021). Restoration dynamics of degraded lands in the Sahel: Impacts on biomass productivity. Journal of Environmental Management, 298, 113-129.
- Bartsch, A., Dech, S. W., & Schmullius, C. (2020). Monitoring terrestrial carbon pools in arid regions using remote sensing. Remote Sensing of Environment, 239, 111599.
- Brandt, M., Rasmussen, K., et al. (2018). Satellite-observed greening trends in the Sahel as indicators of resilience and adaptation to climate change. Nature Ecology & Evolution, 2, 94-101.
- Faye, G., Diouf, A., et al. (2020). Aboveground biomass and carbon sequestration in Sahelian ecosystems. Journal of Arid Environments, 178, 104180.
- Poupon, H. (1979). Structure and dynamics of Sahelian woody vegetation. Annales des Sciences Forestières, 36(4), 201-242.
- Ndiaye, A. (2019). Allometric equations for estimating biomass in Acacia Senegal plantations in Senegal. Agroforestry Systems, 93(5), 2001-2014.
- Dandois, J. P., & Ellis, E. C. (2013). High spatial resolution three-dimensional mapping of vegetation spectral dynamics using computer vision. Remote Sensing of Environment, 136, 259-276.
- Michez, A., Lejeune, P., et al. (2014). Use of UAVs for forestry applications in temperate ecosystems. Forestry Chronicle, 90(2), 77-87.
- Lisein, J., Michez, A., et al. (2013). A UAV-based photogrammetry approach for mapping tree height and canopy structure. International Journal of Remote Sensing, 34(11), 3932-3950.
- PhotoScan, A. (2015). User Manual for Agisoft PhotoScan Professional Edition. Agisoft LLC, Russia.
- Clark, M. L., Roberts, D. A., et al. (2004). Evaluation of airborne hyperspectral imagery for mapping vegetation and biomass. Remote Sensing of Environment, 92(4), 467-479.
- Pix4D, (2019). Pix4Dcapture Software Manual. Pix4D SA, Lausanne, Switzerland.
- Dandois, J. P., Olano, M., et al. (2015). Forest canopy structure and light environment characterization using UAV- based photogrammetry. Remote Sensing, 7(10), 13553-13567.
- Fraser, R. H., & Congalton, R. G. (2018). Lidar and photogrammetry in vegetation monitoring. Canadian Journal of Remote Sensing, 44(3), 192-210.
- Thibaut, P. (2019). Advances in UAV technology for precision forestry applications. Forest Science, 65(2), 120-130.
- Agisoft LLC, (2018). Metashape Professional User Manual. Agisoft LLC, Russia.
- Mohan, M., Silva, C. A., et al. (2017). Individual tree detection using UAV-LiDAR data in complex forest conditions. Remote Sensing of Environment, 194, 69-83.
- Navarro, G., Caballero, G., et al. (2019). Tree crown segmentation using UAV multispectral imagery and topological methods. Remote Sensing, 11(4), 892.
- Huang, H., et al. (2018). Application of watershed segmentation for individual tree detection in photogrammetric data. ISPRS Journal of Photogrammetry and Remote Sensing, 142, 189-200.
- Iizuka, K., et al. (2018). Innovative sampling methods for Sahelian ecosystems: UAVs and traditional techniques. Environmental Monitoring and Assessment, 190, 123.
- Konaté, S., et al. (2020). Advances in Sahelian vegetation monitoring using UAV technologies. African Journal of Ecology, 58(3), 245-257.
- Birdal, A. C., et al. (2017). Operational assessment of UAV- derived models for carbon stock estimation in drylands. Remote Sensing Applications, 6, 105-116.
- Zarco-Tejada, P. J., Hubbard, N., et al. (2014). UAV hyperspectral sensors in forestry: Tree species discrimination. PLOS ONE, 9(4), e94720.