
Journal of Electrical Electronics Engineering(JEEE)
ISSN: 2834-4928 | DOI: 10.33140/JEEE
Impact Factor: 1.2


Research Article - (2025) Volume 4, Issue 5
The Source of Microplastics is Plastic Scattered on Seashores and Riverbanks How to Reduce Ocean Plastic Debris by a Former River Cleaning Worker
Received Date: Jul 21, 2025 / Accepted Date: Aug 25, 2025 / Published Date: Sep 03, 2025
Copyright: ©2025 Kentoku Funaki. This is an open-access article distributed under the terms of the Creative Commons Attribution License, which permits unrestricted use, distribution, and reproduction in any medium, provided the original author and source are credited.
Citation: Funaki, K. (2025). The Source of Microplastics is Plastic Scattered on Seashores and Riverbanks How to Reduce Ocean Plastic Debris by a Former River Cleaning Worker. J Electrical Electron Eng, 4(5), 01-09.
Abstract
It has been 10 years since published "Plastic waste inputs from land into the ocean" in Science in 2015, and this paper has led to many research articles on ocean plastic debiris being published worldwide [1]. However, from my experience working in river surface cleaning, I have noticed that there are many articles that do not fully understand the dynamics of them. In this paper, I show that Jambeck et.al.'s predictions about them are nearly twice as high, that the article by, which claims that a large amount of plastic waste, which is a reserve of microplastics, is remaining on seashores and riverbeds, is closer to the reality, and that most missing plastics are scattered there [2]. As a solution to this problem, I propose the establishment of specialized cleaning services for seashores and riverbanks, the installation of automatic garbage collectors that automatically pick up plastic waste flowing out of rivers, and the obligation for citizens around the world to clean up once a year.
Introduction
I was appointed as a senior overseas volunteer 20 years ago and was posted to Thailand, where I served as an advisor for waste collection and processing in Chiang Mai and Bangkok for two years each. Ten years ago, I also worked for a year and a half in river surface cleaning operations conducted by the Tokyo Metropolitan Government. I believe that I am in a position to express my opinion on ways to reduce ocean plastic debris, and I will develop this paper [3,4].
The Reality of Marine plastics and Micro plastics
The results of the research by Jambeck et.al (In this paper, I will refer to Jambeck et al. as they or their or them) (1) are exaggerated. Regarding marine plastics floating in the ocean, the basic literature is their research published in 2015, ten years ago [1]. According to the research, the number of plastics that began to be produced in 1950 had reached a cumulative total of 8.3 billion tons by 2010, of which 4.8 million to 12.7 million tons (1.7 to 4.6%) had flowed into the ocean. If we assume a conservative estimate of 1.7%, then since the start of plastic production, a cumulative total of approximately 150 million tons has been retained in the ocean. Currently, the location of more than 90% of this is unknown. The issues are summarized as follows.
Preise of Their Estimation of The Amount of Plastic Waste That Has Flowed into The Ocean
Measurement of "Population within 50 km of the Coast" (Table S1)
They estimated the amount of plastic waste that had flowed into the ocean by multiplying the "population within 50 km of the coast" by the amount of waste per capita in urban areas. In applying this to Japan, the population within 50 km of the coast is set at 90% of the population, 115,228,891 people. In this paper, I assume that waste is brought into the river basin through rain, wind, etc., and I only calculate the population of the river basin. However, in Japan, the basin population is known for first-class rivers managed by the national government and second-class rivers managed by local governments, but data on quasi-river rivers, which account for about 20% of the total river length, is not available [5]. Therefore, I estimated the basin area of the quasi-river from data on A) total river length of 144,044 km, B) first- and second-class river length of 123,962 km, and C) basin area of first- and second-class rivers of 348,126 km2, and estimated the basin population of the quasi- river from A) and B) and E) basin population of first- and second- class rivers of 88,535,000 people, to estimate the population of
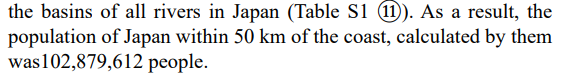
As a result, the population of Japan within 50 km of the coast, calculated by them was102,879,612 people. (123,954.5:20,063.7=348,126:X X=56,349km2
348,126:56,349=88,535,000:X
X=1,433,061 The population of the
river=88,535,000+1,433,061=102,865,612people).
Measurement of Floating River Litter (Amount of Drifting Litter) Per Person (Table S1)
I had experience in river surface cleaning, presents the results of my calculations on the amount of plastics river floating waste flowing into Tokyo Bay and the rate of outflow into the ocean.
Tokyo uses 22 vessels of various sizes for river surface cleaning: 1) 11 cleaning vessels (8 conveyor vessels, 1 manual boat, and 2 small work boats), 2) 2 waste transport vessels, and 3) 9 barges. The conveyor vessels have a conveyor at the front of the vessel and a waste disposal area in the center. The conveyor is submerged in the water and rotates to pick up floating waste and drop it into the waste disposal area. Each two workers are stationed at the front and rear of the vessel, and they use handmade landing nets with handles just under 3m long and meshes just under 3mm in diameter to pick up floating waste in the river and drop it into the waste disposal area. (Figure S1, S2). The collected waste is measured and then recycled, incinerated, or landfilled (Table S4). This data was collected and processed for some rivers managed by Tokyo, so the estimation method for all rivers is described below.

Figure S1: A Conveyor Ship and A Dip Net
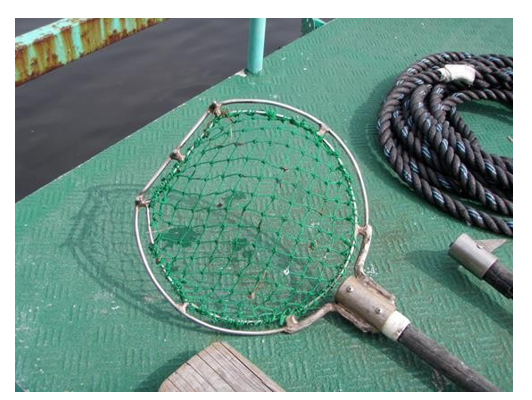
Figure S2: A Made Landing Net with A Handle of About 3 m Long and A Mesh of About 3 mm in Diameter
In this case, the river surface cleaning work is the amount collected in about 6 hours, which is one-quarter of the day, and Sundays are also off. Floating river litter is only collected from 30 of the 60 rivers. The river management distance is only 63 km out of 497 km [6,7]. Taking these factors into consideration, and based on my own experience working, I believe that more than 80% of the floating waste that is collected by cleaners is picked up, but here I estimated that the amount of floating waste in rivers (amount of drifting waste) /person/day for the Tokyo Bay basin population of 29 million people is 1.2g to 1.6g, assuming three patterns of 60- 80%.

This is the proportion of plastics in the amount of drifting waste. As the Tokyo Metropolitan Government, which collects floating waste in rivers, has not conducted a waste composition survey, the Ministry of the Environment (MOE) has conducted an annual survey of the composition of drifting waste for local governments since FY2020 (surveys were conducted at 89 locations in 39 prefectures in FY2022) from 23 prefectures to determine the proportion of plastic in drifting waste (Table S2). The proportion of plastic waste in the total waste ranged from 15.6% to 39.7% with 95% confidence.
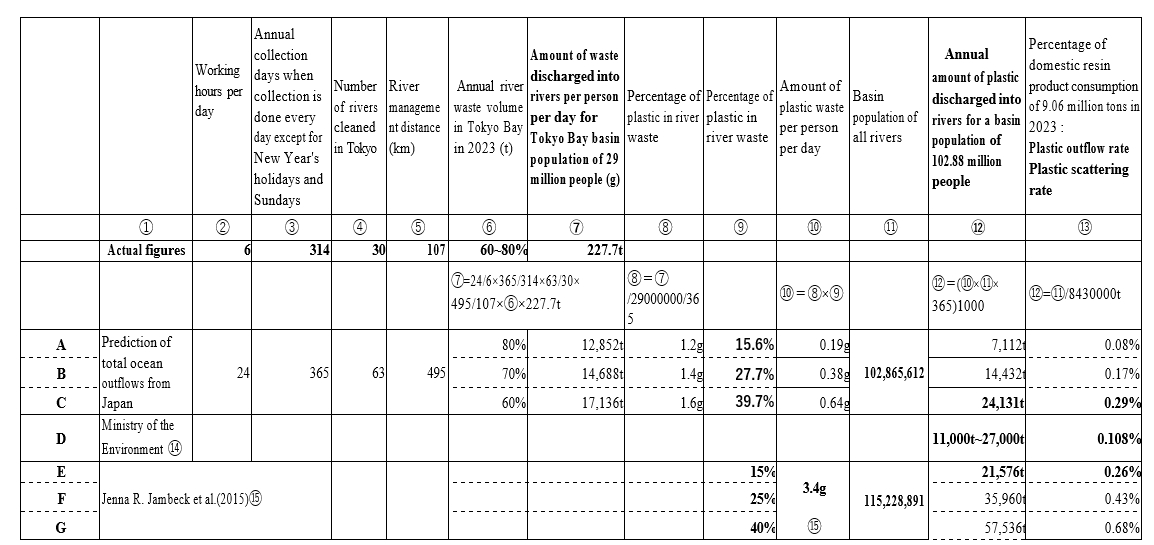
Table S1: Estimated Annual Amount of Plastic Waste Flowing into The Ocean
|
|
Prefecture |
Quantity |
Volume (L) |
Weight (kg) |
Basic statistics |
|
|||
|
1 |
Aichi |
1673 |
73.9% |
598.7 |
7.3% |
35 |
4.3% |
Mean |
27.7% |
|
2 |
Miyagi |
344 |
67.2% |
218 |
5.9% |
18.94 |
3.7% |
Standard error |
5.8% |
|
3 |
Osaka |
365 |
81.8% |
|
|
2.324 |
57.8% |
Standard deviation |
27.9% |
|
4 |
Niigata |
2353 |
65.2% |
|
|
223.314 |
64.0% |
Minimum |
1.4% |
|
5 |
Akita |
6382 |
89.9% |
5277 |
47.6% |
382.318 |
23.6% |
Maximum |
83.5% |
|
6 |
Fukui |
3525 |
97.7% |
2426.2 |
74.5% |
300.51 |
56.8% |
Number of data |
23 |
|
7 |
Aomori |
1281 |
86.5% |
679.5 |
21.8% |
66.82 |
16.6% |
Confidence (95.0%) |
12.1% |
|
8 |
Iwate |
429 |
80.6% |
|
|
61.63 |
4.4% |
15.6% |
39.7% |
|
9 |
Ishikawa |
887 |
82.4% |
|
|
281.97 |
25.9% |
|
|
|
10 |
Saitama |
727 |
44.8% |
125.8 |
43.8% |
9.4824 |
13.2% |
||
|
11 |
Chiba |
257 |
83.4% |
63.3 |
64.1% |
8.09 |
4.2% |
||
|
12 |
Ehime |
1.01 |
54.3% |
0.78 |
82.1% |
27.87 |
69.4% |
||
|
13 |
Kanagawa |
22 |
64.7% |
0.80 |
38.1% |
0.07 |
9.1% |
||
|
14 |
Hiroshima |
0 |
0.0% |
314.914 |
92.5% |
10.69 |
83.5% |
||
|
15 |
Miyazaki |
134 |
35.0% |
77.3 |
4.3% |
3.949 |
1.4% |
||
|
16 |
Mie |
1485 |
87.3% |
826.83 |
6.4% |
33.63 |
2.3% |
||
|
17 |
Kagoshima |
595 |
90.4% |
533.47 |
73.9% |
31.75 |
52.3% |
||
|
18 |
Fukuoka |
801 |
74.7% |
642.9 |
11.0% |
21.68 |
1.6% |
||
|
19 |
Kumamoto |
894 |
77.5% |
|
|
62.7 |
10.4% |
||
|
20 |
Tottori |
302 |
86.3% |
15 |
96.2% |
10.085 |
74.8% |
||
|
21 |
Okayama |
263 |
75.6% |
1191.12 |
93.7% |
37.81 |
43.5% |
||
|
22 |
Yamagata |
880 |
85.9% |
1493.64 |
19.4% |
160.403 |
5.4% |
||
|
23 |
Wakayama |
1412 |
65.5% |
577.82 |
9.2% |
51.32 |
8.1% |
||
Table S2: Percentage of Plastics in Marine Litter
Verification of Jambeck et al.'s Predicted Amount in 2025 10 Years from Now
Prediction of 1.71 kg of Garbage Per Person Per Day and 3.4 g of Plastic Outflow into Rivers Per Person Per Day

measuring it, they measured it as "1.71 kg of garbage per person per day x littering rate 2% x 10% (plastic content ratio)". In this case, the outflow into rivers per person per day of 3.4 g is an overprediction. I would like to point out that the problem is that the littering rate is set at 2% for all countries.
The original data was taken by Jambeck et al. from World Bank urban data of 1.71 kg per person per day. This is almost double Japan's 2010 actual figure of 976 g/person/day. In Chiang Mai, Thailand, the authors conducted a one-week survey of the composition of waste in three periods throughout the year, the hot season, the dry season, and the rainy season, for five days each, with each survey weighing 2 tons, and found that the weight per person was 466 g8). According to official Thai statistics, the national littering rate in 2012 was 630 g/person/day, and 1.5 kg/ person/day in Bangkok8). However, Jambeck et al. used 1.25 kg/ person/day based on the World Bank data. Thus, the reason why the weight per person per day in urban areas is high is that although people gather in urban areas, the administrative procedures for changing addresses in Thailand are not well developed, which is why the population of Bangkok is extremely low. For this reason, the amount of waste generated per person per day in urban areas tends to be high. The examples of Japan and Thailand alone are insufficient when it comes to the amount of waste generated per person per day, and I believe that the 192 countries that they estimated should be examined individually and specifically.
However, since it is difficult to examine all 192 countries, 15 countries were randomly selected from the 192 countries and examined individually and specifically to find the amount of waste generated per person per day (C in TableS3), and compared it with the World Bank's urban data (the amount of waste when A in Table S3 was extracted) and the data for 192 cases (B in Table S3).
|
|
Unit: kg/person/day |
Waste generation rate |
Basic statistic |
B: Jambeck.et.al |
|
|
|
Country |
A: Jambeck.et.al |
C: Funaki |
Mean |
1.64 |
|
1 |
Anguilla |
2.10 |
2.10 |
Standard error |
0.10 |
|
2 |
Bahrain |
1.10 |
1.40 |
Standard deviation |
1.37 |
|
3 |
Belgium |
1.33 |
1.35 |
Variance |
1.86 |
|
4 |
Canada |
2.33 |
0.73 |
Minimum |
0.14 |
|
5 |
Congo, Dem rep. of |
0.50 |
0.25 |
Maximum |
14.4 |
|
6 |
Germany |
2.11 |
1.71 |
Number of data |
192 |
|
7 |
Ghana8 |
0.79 |
0.51 |
Confidence (95.0%) |
0.1944 |
|
8 |
Israel |
2.12 |
1.67 |
1.4 ∼1.8 |
|
|
9 |
Liberia |
0.60 |
0.41 |
Basic statistic |
C: Funaki |
|
10 |
Nauru |
1.20 |
0.55 |
Mean |
0.92 |
|
11 |
Netherlands Antilles |
2.10 |
0.60 |
Standard error |
0.15 |
|
12 |
Reunion |
1.20 |
0.31 |
Standard deviation |
0.59 |
|
13 |
Saudi Arabia |
1.30 |
1.15 |
Variance |
0.35 |
|
14 |
Solomon Islands8 |
0.79 |
0.62 |
Minimum |
0.25 |
|
15 |
The Gambia |
0.53 |
0.44 |
Maximum |
2.1 |
|
Average |
1.34 |
0.92 |
Number of data |
15 |
|
|
Note(1)Waste generated per person per day, examined individually Note(2)Jamebeck.et.al's results using World Bank data |
Confidence (95.0%) |
0.328 |
|||
|
0.6 ∼1.3 |
|||||
|
t-test: Two-sample test assuming equal variances |
|
||||
|
|
B: Jambeck.et.al |
C: Funaki |
|||
|
Mean |
1.66 |
0.92 |
|||
|
Variance |
1.88 |
0.35 |
|||
|
Number of observations |
189 |
15 |
|||
|
Pooled variance |
1.78 |
|
|||
|
Degrees of freedom |
202 |
|
|||
|
t |
2.06 |
|
|||
|
P(T<=t) one-sided |
0.02 |
|
|||
|
t boundary one-sided |
1.65 |
|
|||
|
P(T<=t) two-sided |
0.04 |
|
|||
|
t boundary two-sided |
1.97 |
|
|||
Table S3: Data on Waste Generation Per Person Per Day From 192 Countries and A Comparison Of 15 Countries
As a result, the average per person per day for the 15 cases of extracted data C was 0.92 kg, the average for the 15 cases of data A was 1.34 kg, and the average for the 192 cases of data B was 1.66 kg. It is clear that the World Bank urban data B, which has an average of 1.66 kg, is 1.8 times the average of 0.92 kg for the 15 individual data C samples examined, so about twice as much data was used. In a t-test using two samples (B and C) assuming equal variance, the P value was less than 0.05 even in a two-sided test, and at a significance level of 95%, it became clear that there was a difference between the two samples, and that the 15 data samples extracted were about half the size. In other words, if the 192 data sets from the World Bank urban areas obtained by Jambeck et al. are examined individually and specifically to determine the amount of waste generated per person per day, it can be said that the data from the 192 urban data sets from the World Bank shows that about half the amount is appropriate.
Based on the above results, Figure 2, created by Jambeck et al., predicts the cumulative amount of plastic waste from 2010 to 2025 to be just under 50 million tons as a low prediction, 150 million tons as a medium prediction, and 250 million tons as a high prediction. In contrast, Funaki predicts half of these figures, at 25 million tons, 50 million tons, and 125 million tons, respectively (Table S5).
In contrast, Isobe et al. (2) predicts that the cumulative amount of marine plastic from 1961 to 2017 is 25.3 million tons, which is almost the same amount as Funaki's low prediction. I believe that Jambeck et al.'s prediction is excessive.
Estimated Amount of Waste Discharged into Rivers / person/Day and Rate of Plastic Discharge into The Ocean
The rate of plastic discharge into the ocean is the percentage of plastic waste in the domestic consumption of resin products.

The amount of plastic discharged into rivers of 21,576 tons and the rate of discharge into rivers of 0.26% in row E by them are almost the same as the amount of plastic discharged into rivers per year of 24,135 tons and the rate of discharge into the ocean of 0.29% in row C of Funaki's prediction. The prediction in row D by MOE is also in the same range [8]. I believe that these are the most appropriate predictions. This value is the lowest prediction amount, since they predict the annual amount of plastic discharge into the ocean to be between 20,000 to 60,000 tons [9].
They give all countries a littering rate of 2% of the waste amount as a given. Japan's littering rate can be said to be one-sixth lower. This is one of the reasons why the amount of plastic waste is overestimated.
However, on the other hand, the plastic ratio in waste for Japan was set at 10%, but according to my measurements, the actual figure was much higher, the average was 27.7%, of ranging from 15.6% to 39.7% with a 95% confidence level, so 10% is an underestimate (Table S2). Moreover, over the past 15 years, the amount of both general waste and river waste in Japan has been decreasing, mainly due to a decline in population (Table S4, Figure S3).
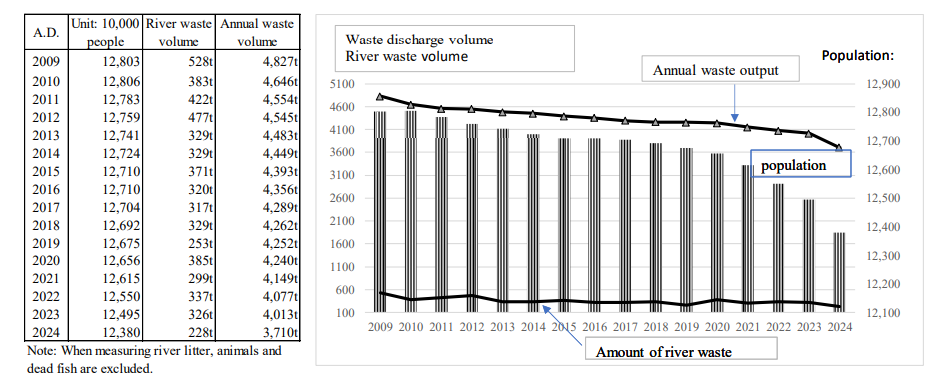
Table S4:
Figure S3: Population, Amount of River Waste, and Annual Waste Output
The Status of Missing Ocean Plastic Debris 10 Years After the Paper Was Published (Table S5)
The explanation by JAMSTEC's Fujikura et al. about missing ocean plastic debris is easy to understand. However, from my experience working on river surface cleaning, the amount of waste scattered on the seashore and riverbanks are overwhelmingly greater than the amount of waste floating in the river, and even compared to the plastics that has already drifted in the water and sea while flowing in the river and has sunk to the deep sea, and I think that the 30.0 Mt(20%) of "coastal drift, etc." is too low as an estimate of the amount of waste remaining in coastal areas (Table S5) [9]. Plastics that accumulate on the seashore and riverbanks deteriorates due to intense ultraviolet rays, repeated wetting and drying caused by the ebb and flow of tides, and ship traffic, and turns into microplastics. Microplastics are generated on the seashore and riverbanks.
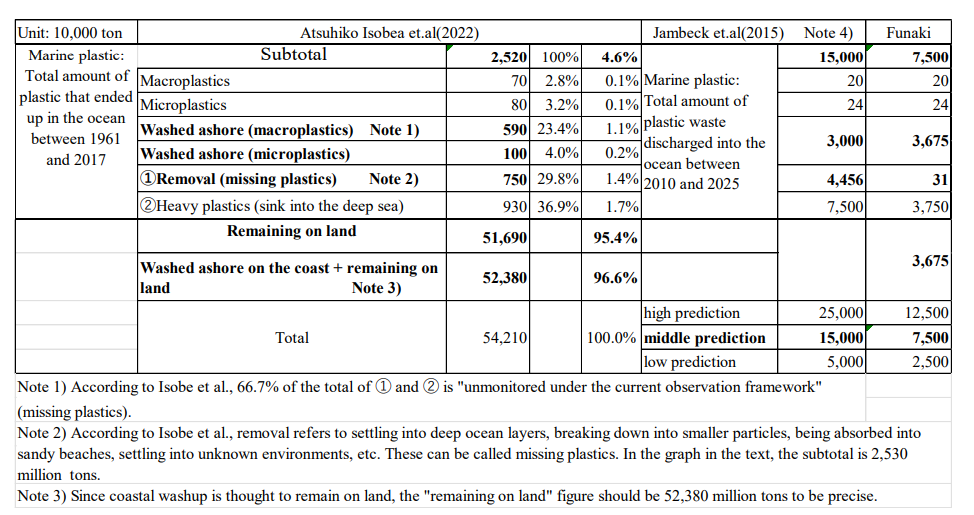 Table S5: Reviewing the Paper by Jambeck et.al From 10 Years Ago. The Fate of Missing Plastic Debris
I believe that Isobe et. al' s paper should be evaluated. In this paper, a particle tracking model (PTM) and a linear mass balance model were used to simulate the distribution and movement of ocean plastic debris from 1961 to 2017, including macroplastics floating in the ocean, micro- and macroplastics washed up on the seashore, plastics heavier than seawater, and plastics removed from the seashore and the upper ocean surface, using 10 tons of macroplastics and 0.1 tons of microplastic particles, including the fragmentation of macroplastics into microplastics, and confirmed through actual experiments. The total weight of ocean plastic debris from 1961 to 2017 was measured to be 25.3 Mt (million tons) (25.2 Mt when the figures on the graph are stacked up), which is almost the same as my low-level prediction of 25.2 Mt in

are plastics that cannot be monitored under the current observation framework (missing ocean plastic debris). And of the 542.2 Mt of mismanaged plastic wastes to date, 95.3% (516.9 Mt) is still on land. I support Isobe et.al. because I believe that the amount of plastic scattered on the seashores and riverbanks is far greater than the amount of plastics on the sea surface, in the ocean, or on the sea banks, at over 90%.
Propose the Installation of Automated Waste Collection Machines in All Rivers
Previous discussions of ocean plastic debris have not mentioned any ideas on how to deal with this ocean plastic debris. Based on my experience in river surface cleaning, I propose that automated waste collection machines be installed in all rivers around the world [10,11].
Floating waste in rivers is gradually pushed from the middle of the river by waves caused by passing ships and flows along the quay, so if an inlet is created to guide the waste and an automatic waste collector that automatically picks up the waste and pours it into a waste bin is installed, the waste will be picked up even at night when cleaning ships are not working [12-15]. Therefore, if automated waste collection machines were installed in all rivers to prevent waste generated in one country from washing up on the shores of other countries, waste generated in Japan would not wash up on the shores of Pacific islands such as Hawaii or the United States, and waste generated in China and Korea would not wash up on the seashore of the Sea of Japan. It is more efficient and effective to capture plastic floating in the sea in the river before it flows into the sea than to pick it up in the sea. It is the responsibility of coastal countries to prevent waste from flowing into the sea from rivers.
Microplastics Originate from The Degradation of Waste Accumulated on Seashore and Riverbanks
Therefore, efficient collection and removal of such debris are essential for mitigating environmental pollution.
From my experience working in river cleaning, the amount of waste scattered on the seashore and riverbanks is overwhelmingly greater than that of floating waste in rivers, and also compared to the plastic that has already drifted in the water and ocean while flowing through the river and sinks to the deep sea. As seen in Isobe et.al., 95.3% of unmanaged waste to date, and 96.7% if coastal drift is included, remains on land, that is, on the seashore and riverbanks [2]. These deteriorate due to strong ultraviolet rays, the ebb and flow of the tides, and repeated wetting and drying caused by ships in operation, and become microplastics. In particular, during spring tides and waves caused by the operation of large ships, deteriorated and small-grained plastics and microplastics that have remained deep in the shore are scooped up by the tide and flow into the Pacific Ocean [16,17]. I would like to propose that the Tokyo Metropolitan Government and the Ministry of Land, Infrastructure, Transport and Tourism (MLIT) employ a substantial number of cleaning workers to thoroughly collect waste, preventing it from spreading across the globe. This initiative would not only eliminate waste scattered on beaches but also enhance the scenery, attract tourists, and contribute to economic growth due to the high economic impact of maintaining cleanliness.
Moreover, this effort could significantly address issues related to marine macro and microplastics. One suggestion could be to make beaches and riverbanks cleaning a mandatory annual activity for all citizens worldwide. Another idea is to incorporate beaches cleaning as part of penalties for traffic violations [18-24]. It has long been observed at cleaning sites that individuals who participate in cleaning activities, even once, develop a lasting habit of not littering. However, I was unable to find any literature to prove this, I encourage you to consider these ideas for a cleaner, more sustainable future.
Summary - To Solve the Problem of Ocean Plastic Debris
The findings of this paper show that the predictions made by Jambeck et al. 10 years ago about marine plastic litter are nearly twice as high as the actual levels in Japan and Thailand as of 2025, and it was found that Japan's plastic outflow and littering rates are low, at 0.2% to 0.3%, one-fifth of those in other countries.
This is because Japan does not have an open-dumping landfill site, so most of waste, 80.1%, is incinerated, and the landfill rate is only 1.0% [11]. In order to this, the only two types of waste floating in rivers are those that have been intentionally dumped, and those that have been washed away by rain and wind. In addition, it is believed that the fact that all municipalities in Japan separate waste collection is a major factor. Separate waste collection is a minority not only in Asia but also in Europe and the United States. Separate waste collection and reducing the generation of unmanaged waste to zero is one of the major ways to reduce ocean plastic debris to zero. This paper also stated that the majority of poorly managed plastic waste, 96.7% (Isobe et.al (2)), remains scattered on the seashore and riverbanks, and that to solve this problem, it is more urgent to thoroughly pick up the waste on the seashore and riverbanks, which produce ocean
Plastic debris every day, then the plastics in the deep sea, which is almost impossible to pick up. As a countermeasure, I propose the following to all countries.
• Create a task of cleaning seashore and riverbanks.
• Make it mandatory for citizens around the world to pick up waste on the seashore and riverbanks once a year.
• Install automated waste collection machines in all rivers, and reduce the outflow of ocean plastic debris that flows into the ocean through rivers to zero.
Competing Interest
Author declare that I have no competing interests.
Data and materials Availability
All data are available in the main text or the supplementary materials.
References
- Jambeck, J. R., Geyer, R., Wilcox, C., Siegler, T. R., Perryman, M., Andrady, A., & Law, K. L. (2015). Plastic waste inputs from land into the ocean. Science, 347(6223), 768-771.
- Isobe, A., & Iwasaki, S. (2022). The fate of missing ocean plastics: Are they just a marine environmental problem? Science of the Total Environment, 825, 153935.
- Funaki, K. (2017). Plastic dynamics from river surface cleaning work. Monthly Waste Journal January issue p38– 39p. (Data S1).
- Funaki, K. (2024). Considerations on misssing ocean plastic debris and a proposal for installing automated waste collection machines in rivers. Lectures of the Japan Society of Waste Management and Recycling. 2.09.
- The Word Bank. (2012). What a waste - a global review of solid waste management. No.15, 11, 81-82.
- Funaki, K., Takashi, S., Hasumi, M. (2007). Solid Waste Management Plan in San Kamphaeng. JICA p17. (Data S3).
- Sharp, A., Sang-Arun, J. (2012). Current municipal solid waste management in Thailand.
- A Guide for Sustainable Urban Organic Waste Management in Thailand, Institute for Global Environmental Strategies, p18.
- MOE: FY2023 study results estimated amount of marine plastic waste discharged from Japan p49, first paragraph (2024).
- Fujikura, K., Chiba, S., Nakajima, R. (2019). JAMSTEC'sefforts to combat ocean plastic debris.
- For information on automatic trash collectors, please see the UBE Mashinari Co., Ltd.
- MOE. (2018). General waste discharge and processing status.
- Waste Management Industry Survey: Business and Government Sectors.
- Ansari, M. S. A., & Saleh, M. (2012). Municipal solid waste management systems in the Kingdom of Bahrain. International Journal of Water Resources and Environmental Engineering, 4(5), 150-161.
- Waste prevention country profile Germany. (2023).
- Ofori-Boateng, C., Lee, K. T., & Mensah, M. (2013). The prospects of electricity generation from municipal solid waste (MSW) in Ghana: A better waste management option. Fuel processing technology, 110, 94-102.
- House Hold Waste Per Capita And Private Consumption Expenditure Per Capita.
- Nyumah, F., Charles, J. F., Bamgboye, I. A., Aremu, A. K., & Eisah, J. S. (2021). Generation, characterization and management practices of household solid wastes in Cowfield, Paynesville city, Liberia. Journal of Geoscience and Environment Protection, 9(04), 113.
- ADB BRIEFS: Fallah Nyumah, Joseph F. Charles, Isaac A. Bamgboye, Ademola K. Aremu, James S. Eisah.
- Milios, L., & Reichel, A. (2013). Municipal waste management in the Netherlands. European Environmental Agency.
- Fontaine, L., Morau, D., & Praene, J. P. (2022). Analysis and Estimation of Short-Term Residual Household Waste Production: Case Study Reunion Island. Sustainability, 15(1),348.
- Per Capita Daily Waste Collection in Saudi Arabia During the Period 2010-2018.
- National Waste Management and Pollution Control Strategy.
- Fatty, F. N., & Komma, L. (2019). In-depth analysis of municipal solid waste management in Kanifing Municipality, the Gambia. Int. J. Sci. Res. Publ, 9, 95114.