
International Internal Medicine Journal(IIMJ)
ISSN: 2837-4835 | DOI: 10.33140/IIMJ
Impact Factor: 1.02

Research Article - (2024) Volume 2, Issue 7
The Impact of Financial Development on Poverty, Growth and Inequality in Ethiopia
Received Date: Jun 10, 2024 / Accepted Date: Jul 01, 2024 / Published Date: Jul 23, 2024
Copyright: ©Â©2024 Amanuel Della. This is an open-access article distributed under the terms of the Creative Commons Attribution License, which permits unrestricted use, distribution, and reproduction in any medium, provided the original author and source are credited.
Citation: Della, A. (2024). The Impact of Financial Development on Poverty, Growth and Inequality in Ethiopia. Int Internal Med J, 2(7), 01-17.
Abstract
To understand the full picture of multidimensional effect of financial development, simultaneously evaluating it through growth- inequality-poverty triangle is very critical and one step ahead of traditional frameworks. This study examined the impact of financial development on poverty, growth and inequality in Ethiopia by taking into account simultaneous effects of time series data used with simultaneous equation model for the period of 1991 to 2019 as there was economic policy change in 1991. The finding shows, first, the direct impact of financial development on poverty reduction increases the proportion of population living below the national poverty line. Second, the indirect impact of financial development on poverty reduction lift up the poor through economic growth and income distribution. Third, indirect effect is pro-poor and trickle-down hypothesis firmly supported. Fourth, a strong financial institution plays a crucial role in improving the wellbeing of the poor. Fifth, Kuznets’ inverted-U theory that is explaining the average income and inequality in long run is not robust and the model is unverified. Finally, there is a long run cointegration relationship between financial development and poverty reduction. Therefore, it is concluded that financial development plays a significant role on poverty reduction both in short and long run mainly through the indirect channel of economic growth and income distribution. The government shall design a compulsory pro-poor public policy inquiring financial institutions to allocate certain percentage of loan to poor, SMEs and informal sectors. Ultimately, it will help to promote inclusive financial system and ultimately enhance innovation, productivity and industrial development.
Keywords
Financial Development, Economic Growth, Poverty and Inequality
Introduction
Back Ground of the Study
Seers (1969) stated that development occurs with the reduction in poverty, inequality and unemployment within a growing economy [1]. For poverty reduction, Beck et al. (2007) suggest that financial development boosts incomes of the poor and reduces inequality. Based on Ä?ihák et al. (2012), this financial development is defined as a combination of depth, access, and efficiency [2,3].
A large body of literature assessed the impact of financial development on economic growth, inequality and poverty reduction [4-8,59]. However, there is conflicting view on distribution of income and poverty reduction, financial development involves welfare improvements in the functions provided by the financial systems like pooling of savings, capital allocation to productive investments, investment monitoring, risk diversification and exchange of goods and services [9].
But Jalilian and Kirkpatrick (2001), stated that financial development can contribute to poverty reduction by directly creating access to credit, saving and insurance and the indirectly through economic growth and income distribution [10]. First, by improving opportunity for the poor to invest in new technologies, education and social issues. Second, to achieve a level of sustainable gains by the poor, the financial system can enable the poor to access financial services. This in turn enhances productivity. Thus, financial instruments play a significant role on poverty reduction.
In Ethiopia, the year 1991 is marked as a turning point for the whole economic policy change. It was the period in which a shift from a controlled to market friendly policy regime [11]. As relation to this change, in World Bank country profile of (2018),the population annual growth rate is declining for the last three decades and poverty head count ratio at national poverty lines (%age of population) is declining [12]. It was 44.2, 29.6 and 23.5 in 2000, 2010 and 2018 respectively. In relation to inequality, income share held by the lowest 20% is declining. These show that poverty and inequality remain an obstinate challenge.
Furthermore, Ethiopia has recorded growth over the last 15 years led to walfare improvement. PCI reached USD 985 in 2018/19. Poverty declined from 38.7% in 2004/05 to 22% in 2018/19. Investment to GDP ratio increased to 35.2% while domestic savings stood at 22.3%; industrial sector showed 12.6 % growth; secondary education enrolment shows improvements by 5.8%; total telecom subscribers reached 43.6 million; inflation 12.6% and SMEs development has reached total loan disbursed Birr 7.3 billion [13].
Problem Statement
The world we are living is dynamically changing and the time is puzzling with poverty, inequality, war, climate change and pandemic. Contrary to literatures’ expectations of the trend called “Africa rising”, Tita and Aziakpono (2017) stated that Africa’s growth story has never been pro-poor [14]. Subsequently, it has little impact on poverty reduction and the income inequality which remains stubbornly high, suggesting that strong growth has largely been enjoyed by a few elite and rich people. However, Appiah et al. (2020) argue that in considering poverty, one echoes bone-dry population and poor health care system but not access to financial service [15].
However, there are large bodies of literatures have shown the impact of financial development on enhancing growth, inequality and poverty reduction. But the question is whether the focus of development strategies should be on direct or indirect impacts. There are inconsistent prediction on empirical studies in the impact of financial development on growth-inequality-poverty triangle. The first prediction shows a positive linkage between financial development on growth and poverty reduction [7,16]. The second prediction is that due to inadequate distribution of the gain of growth, the positive effects are weakened by the presence of growing inequalities [7,11]. These studies show lack of access to finance is the main cause of the pervasive generation of income inequality and poverty.
Furthermore, the model developed by Greenwood and Jovanovic (1990) predicts a nonlinear relationship between financial development and income inequality that depends on the level of economic advancement [17]. At low levels of prosperity, the wealthy and politically connected can afford to access finance. As Kuznets’ (1955) hypothesis of inverted-U, only after a certain threshold of economic development, a larger proportion of society benefits from financial deepening [18]. Nevertheless, Banerjee and Newman (1993) and Galor and Zeira (1993) suggest a linear relationship between financial development and income inequality [22,23]. The theoretical assumption is that financial market imperfections may be especially binding on the poor.
On other hand, evidiences suggest that the existence of an adverse consequence of quality of institutions on inequality. Argue where institutional quality is strong, financial development reduces inequality. When institutions are weak, improving welfare or reducing inequality is difficult due to discriminatory lending and corruption which opens door for oligarchy and establish interests to sway finance away from the poor [9].
In Ethiopia, domestic credit market is dominated by lending to state owned enterprises. The financial repression used to manage monetary policy and financing of large projects. This led to macro-financial imbalances, fiscal dominance, pressures on inflation, a chronic shortage of foreign exchang and the lack of financial system advancement [24]. However, Kirkpatrick et al., (2001) argue in favor of regulated rather than liberal financial markets to avoid financial crises and its instrumentality in poverty reduction [10]. The financial liberalization has led to an increase in financial fragility in developing countries. Thus, strict adherence to prudential regulations will reduce the incidence of failure and political repercussions.
To have a comprehensive picture of financial development, testing its total effect simultaneously with the triangle of "growth- inequality-poverty" is the interest of this paper. Yet, two main issues considered as a research gap. First, the findings of existing literatures are conflicting and leaving the debate open for further research. Second, the existing literatures failed to show its multidimensional impact by simultaneously evaluating the direct and indirect effects. In this context, searching for the dynamics of financial development on the wellbeing of the poor which has sociopolitical and economic consequences has a great importance. Therefore, the findings of this study is hoped to shed light for the planers to strategically design an effective policy.
Research Question
Primary Research Question:
How does the financial system development impact poverty, growth and inequality in Ethiopia?
Secondary Research Questions:
How much statistically significant are the direct and indirect impacts of financial development on poverty reduction?
Is there a trickle-down effect between financial development and economic growth?
What is the role of a financial institution on improving the wellbeing of the poor?
Is there Kuznets’ inverted-U shape relationship between financial development and inequality?
Is there a long run cointegration between financial development and poverty reduction?
Research Objective
General Objective
The aim of this thesis is to investigate the impacts of financial development on economic growth, inequality and poverty reduction in Ethiopia.
Specific Objectives
• First, it makes use of theoretical framework to establish link between financial development, poverty, growth and inequality
• Second, it tests the direct and indirect impact of financial development on poverty
• Third, it examines the trickle-down effect of financial development and economic growth
• Forth, it evaluates the role of institutional quality on reduction of inequality
• Fifth, tests Kuznets’ inverted-U hypothesis of financial development and inequality
• Finally, it provides suggestions for policy makers to promote inclusive financial system development to enhance innovation and industrial development
Research Hypothesis
Based on the theoretical and empirical literatures, the following hypotheses are developed.
• H1: There is direct effect of financial development on poverty reduction through access to financial service
• H2: There is indirect effect of financial development that improves the wellbeing of the poor through growth and income distribution
• H3: There is trickle-down effect between financial development and economic growth
• H4: There is improvement of walfare where there is a strong financilal institutions
• H5: There is Kuznets’ inverted-U shape relationship between financial development and income inequality
• H6: There is a long run cointegration relationship between financial development and poverty reduction
Literature Review
This chapter presents the concept of financial development, poverty, growth and inequality. It further discusses how poverty, growth and inequality are affected by financial development.
Theoretical Literature Review
Financial Development and Poverty Reduction
Zhuang et al., (2009) claim that financial sector development can impact poverty through two channels which is direct and indirect. First, financial development can allow the poor to expand the access to financial services which is direct impact. Second, financial development contributes to poverty reduction through economic growth. This is indirect effect is called trickle-down theory. In this theory, economic growth trickles down to the poor through job creation, income distribution effect and other economic opportunities [25].
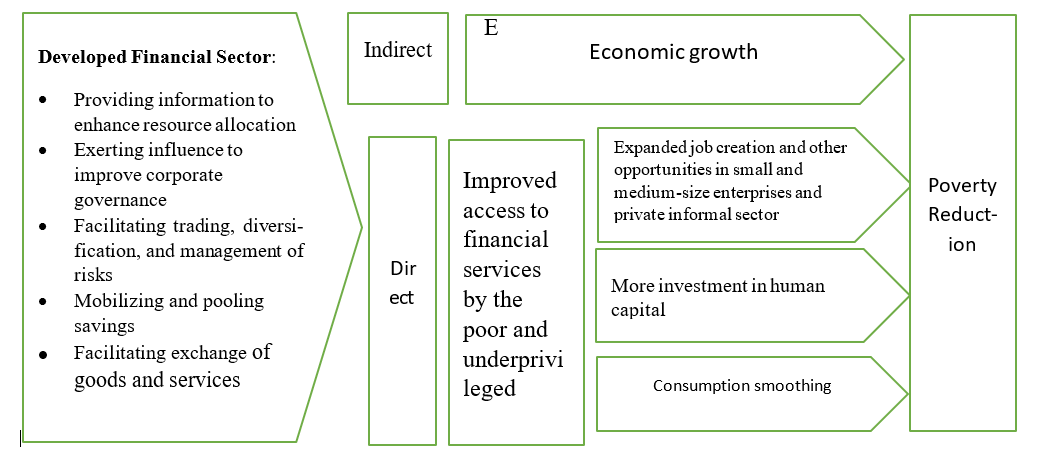
Source: Adapted from Claessens and Feijen (2006) [20]
Figure 2.1: Financial Sector Development and Poverty Reduction
According to, the direct link refers to how the benefits of financial development are transferred to reducing poverty and income inequality while the indirect link shows how financial deepening exerts a positive effect on economic growth, and how the gains from growth are channeled to the poor [2]. It may affect the poor households through two channels which are aggregate growth and changes in the distribution of income. First, the development of the financial system can ease the credit constraints. The implication of the increased access to credit to the poor population can spend extra money on consumption expense and improve their welfare. Second, the market competition will rise as new firms enter to the sector. Jalilian and Kirkpatrick, (2001) stated a well- developed financial system tends to facilitate the process of capital accumulation which increases the level of economic growth which in turn assist in reducing poverty. This will reinforce the productive assets of the poor and enhance productivity [10].
The Direct Effect of Financial Development
Most of the theoretical and empirical results of the previous studies show that financial development contribute to poverty reduction through direct channel [23]. There is impact of finance on the welfare of the poor who lack resource to finance the productive projects [26]. This in turn slows the aggregate growth of the economy by diverting away the flow of fund to lesser ranked projects. If financial system fail to function properly, it will lead to higher income inequality by giving the opportunity to wealthiest.
The sound argument in the case of the developing countries is that for poverty eradication strategy, the focus shall be given to the poor to finance the small and medium-sized enterprises (SMEs) and informal businesses. It is because SMEs are labor intensive and creates job for the poor household. Fields (2001), as the credit and financial market is underdeveloped, the gain supposed to be harvested by the poor will be lost. This will result in high poverty and inequality and also the growth of the economy could be slower than expected. The implication is that creating better opportunity for poor to access financial service and increased entrepreneur participation through productive projects in turn expands their income. Thus, allowing credit access to the poor has important policy implication to reduce the likelihood of sinking in poverty trap and by smoothening the consumption and managing shocks of health and other challenges.
Growth in financial system might not spontaneously result in greater access of finance and removal of credit constraint. Therefore, the government intervention in form of microfinance and SME credit programs. The absence of public sector inclusive policy, lenders prefer to give huge amount of loans to the few rich. Hence, the government shall support the pro-poor sectors and SME to help the poor segment. The main bottle neck for growth of SMEs is often access to finance. Hence, government shall support SMEs to adopt new technology, train and empower, and facilitate linkages between SMEs with the experienced large enterprises to adopt technology and diversify investment into new markets [25].
Furthermore, Kirkpatrick et al., (2001) stated micro-finance plays a significant role in directly linking finance and poverty reduction. It can alleviate poverty and the best practice technologies can be translated into poverty reduction by directly linking finance. Thus, providing effective micro-finance services to poor people is part of a poverty-reduction strategy [10].
The Indirect Effect of Financial Development
The indirect channel through which financial development backing poverty reduction is basically economic growth and income distribution. There are different alternative dimensions that show the impact. For instance, argue that through job creation to the poor households, wage differentials between skilled and unskilled labor, increased tax revenue that resulted from the economic growth that could be distributed to fiscal resources for the socioeconomic expenditure (i.e. education, health and other social protection programs. Moreover, Aghion and Bolton (1997) conclude that economic growth leads to the availability of more public funds through the capital accumulation and increases the income level of the poor [26].
As Kuznets (1955) prediction, financial development reduces inequality. Thus, the indirect effect of financial development can have impact on income distribution. Likewise, Datt and Ravallion (1992) have tried to answer the changes in poverty as a result of growth effect, changes in average income and the income distribution effect which is resulted from the shifts in Lorenz curve. It is concluded that growth effect explains the changes in poverty that had been observed. According to Fields (2001), the level of inequality and the rate of economic growth are determining the extent of impact of growth on poverty eradication [27]. Similarly, there is an agreement on the importance of growth for fighting and it shall not be understated. This doesn’t mean growth alone is sufficient for poverty alleviation although it is necessary condition. In order to harvest the benefits of growth, the poor households shall expand their asset base.
Financial Development and Economic Growth
The theoretical foundations of the argument on financial development and growth were established by Joseph Schumpeter is creative destruction process, financial intermediaries materialize technological innovation and contribute to economic development. It continues with McKinnon-Shaw financial development approach and has been expanded for more countries by King and Levine (1993) as a representative study in the empirical literature. They argue financial depth is at the core of growth, in other words, financial repression hinders economic growth.
Findings on recent litrature show that financial development leads to growth and it is growth is pro-poor [7]. It means that the trickle- down hypothesis is firmly supported. Kuznets (1955) hypothesis, in the case of inequitable growth in developing countries, there will be limited impact of growth in poverty reduction [18]. Also, Beck, et al., (2007) argue that depending on the level of inequality, economic growth could have a positive impact on poverty reduction but not necessarily improve the wellbeing of the poor [2].
Levine (2005) stated that financial development affects factors of production that determines economic growth [19]. These factors are the accumulation of physical and human capital and total factor productivity that result from improvements in functions provided by the financial systems like mobilization of saving and capital allocation to productive projects. Then, proper monitoring of these investments and risk diversification. Therefore, financial development improves information flow, encourage risk sharing and improve the capacity to absorb shocks and reduce the volatility of macroeconomics and finally, enhance distributional effect of income.
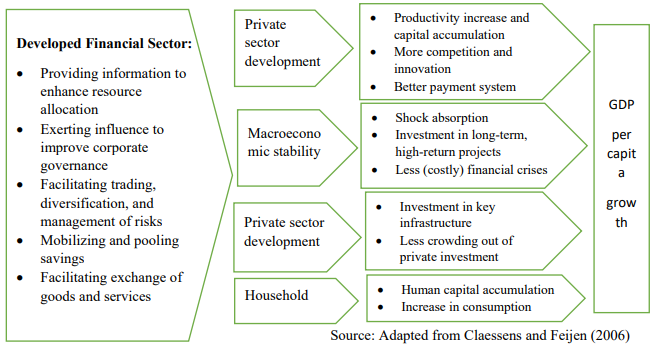
Source: Adapted from Claessens and Feijen (2006)
Figure 2.2: Financial Development and GDP Per Capita Growth
On other hand, financial liberalization underpinned by McKinnon (1973) and Shaw (1973) emphasized on the influence of real interest rates of saving, investment and growth [21]. Yet, Kirkpatrick et al., (2001) argued that the hypothesis of financial liberalization has led to an increase in financial fragility and systemic crises in developing countries' financial sector [10]. The financial repression and liberalization approaches had a common concern with economic growth and resource allocation but with little consideration of impact on poverty except an implicit assumption that the benefits of economic growth trickle-down to the poor.
Financial Development and Inequality
In the earlier literatures, there were conflicting predictions on the growth, inequality and poverty reduction nexus. Kuznets theorize that at the first stage of economic development, inequality of income rises (positive) and later fall (negative) when the economy becomes industrialized. The Kuznets’ (1955) hypothesis of inverted-U proposes that as the economy grows, inequality increases at the early stage of the economic development [18]. But as the economy matures and industrialization taking place, income inequality decreases. In the early stage of development, financial development favors more the wealthy. Therefore, richs harvest industrialization, control the major share of the economic pie and ignore the poor below the poverty line.
A number of models imply that financial development enhances growth and reduces inequality. Todaro (1997) argues that economic growth can trickle-down to the poor households either through new job creations or through income distribution. Besides, there is considerable evidence that financial deepening contributes to reduce poverty and inequality [29]. However, it has been argued that financial imperfections, such as information and transactions costs affect the poor who lack collateral and credit histories.
Thus, it is likely that abating credit constraints will benefit the less-privileged, enhance the efficient allocation of capital and reduce income inequality through increased credit availability of poor individuals with productive investments [23]. In other words, financial development should benefit the poor both by improving the efficiency of capital allocation by alleviating credit constraints which disproportionally restrain the poorer parts of society, thereby reducing income inequality. Conversely, other theories predict that financial development primarily benefits the wealthier parts of society. The poorer individuals rely on informal and family connections for raising fund.
Furthermore, the effect of financial development on income distribution again is inconsistent. The first proposition is an inverted-U association between finance and income inequality, while the other predicts a linear relationship. For instance, the study of Greenwood and Jovanovic (1990) has predicted a nonlinear relationship between finance and inequality, while on the prediction of Galor and Zeira (1993), income distribution has a linear association with it [17,23].
Still, some studies have argued that financial depth is at the core of growth and it is pro-poor, in other words, financial repression hinders economic growth [21,28,30]. Similarly, Naceur and Zhang (2016) considered several dimensions of financial development. Access to finance, efficiency, stability, and liberalization reduce inequality and the lesser income inequality can promote economic growth with inverted-U pattern for the impact of income distribution on growth [31]. However, Kirkpatrick et al., (2001) argue in favor of regulated rather than liberal financial markets. In developing countries, financial liberalization could lead to an increase in financial fragility. Thus, adherence to prudential regulations will reduce the incidence of failure and political repercussions [10].
Growth, Poverty and Inequality Linkage
The link between growth, inequality and poverty is particularly important from the dynamic perspective. Bourguignon (2004) argues that reduction of absolute income poverty is a meaningful development goal, then a direct link may be established between development, growth and distribution [32]. Poverty and income inequality have theoretically been identified to be inextricably linked. A better income distribution helps people of the lowest income group to increase their income so that they can exit from their poverty. Similarly, Dollar and Kraay (2002) advocte poverty reduction through economic growth [33]. But the debate is the link between growth and inequality, and whether growth reduce poverty or deemed to be pro-poor depends, however, on the impact of growth in inequality and how much this impact on inequality feeds into poverty.
Inequality can have a direct and indirect link with poverty. The direct link is related with inequitable distribution of resources in the society hinders a person, affecte negatively and will not have enough to take care of the basic needs of life as well as in terms of human capital development (education and health). The indirect link between inequality and poverty are through growth, employment among others [34]. The link through growth is based on the notable Kuznets’s theory of the “inverted U shaped” relationship between inequality and growth although not generally accepted empirically. At the early period of economic development and increase in inequality, those affected by the rising inequality. So, the negative impact of growth on inequality also leads to an increase in poverty given that there is a positive relationship between the level of inequality and poverty.
The fundamental feature of poverty is that it affects the access of the poor to markets, with serious repercussions for the entire economy. Almost all markets are affected like the ability to obtain credit, sell labor or rent land. In a growing economy, development occurs with the reduction of poverty and inequality. As a result of this, poverty reduction has become a main goal of development efforts and it’s important to understand why inequality matters even after elimination of poverty [35]. In order to achieve poverty reduction, both economic growth and equity have assumed a central place. The arguments that links the incidence of poverty to mechanisms that drive its causes are important to the creation of appropriate policies.
Financial Development in Ethiopia
The history of financial development in Ethiopia went back the beginning of last century when the first commercial bank established in 1905. In post of First World War (WW1), the financial market opened. Until 1936, international banks and insurance companies were functional. But when the country got occupied by Italy and it changed this policy to allow only the Italian banks. After gaining independence in 1943, the state bank of Ethiopia established. Then, in 1963, the first financial reform towards liberalization took place; private banks established and allowed to start joint ventures with foreign banks. But this liberalization was not lasted long due to military coup took over power 1974. As a result of political upheaval, all banks and financial companies were nationalized. However, the second financial sector reform took place as the new government control power in 1991 and shown a significant progress [36].
Still financial sector of Ethiopia in last decade has been operating under a financial repression framework. Besides, firms are credit constrained and poorer performance and lesser productivity. According to World Bank (2014), firms are more likely to be credit constrained than global comparators or SSA countries. A credit constrained firm has 15% lower sales growth, 5% lower employment growth, and 11% lower labor productivity growth than firms which are not credit constrained and investment decisions of firms are heavily dependent on cash flows. It means the economy can benefit from a shift of domestic credit towards private firms [37].
Banking sector in Ethiopia
The structure of the financial sector has barely changed over more than a decade and is dominated by state-owned financial institutions. The financial sector in Ethiopia currently consists of 18 banks, 17 insurance companies, 35 microfinance institutions, and five capital goods finance companies. Banking is a dominant subsector, accounting for 78% of total financial sector assets, followed by insurance companies, representing 15%. The two state-owned banks account for 65.7 % of total deposits, 62.4% of outstanding credit, 35.9 % of total branch networks, 64% of total banking sector assets, and 48.9% of total banking sector capital. But there isn’t any foreign based financial institution in Ethiopia [38].
But in Ethiopia, the domestic credit market is dominated by lending to State Owned Enterprises (SOE) mainly to finance infrastructure investment contributing to weak financial intermediation. Domestic credit as a percentage of GDP increased from 28.3% in 2014 to 32.1 in 2016, while private credit increased from 8.7 to 11.7%. A large part of domestic credit was credit for SOEs which is 17% between 2014 and 2016. However, with a policy preference for financing SOEs at low cost, the credit market tended to crowd out the private sector. The 2017 Doing Business report ranks Ethiopia at the 170th place of 190 economies in ease of getting credit which is one of the lowest ranks in the world and two ranks down from Ethiopia’s position in 2016. Enterprise Survey of 2015 reveals that the proportion of enterprise investment in Ethiopia financed by banks is only 7.8%, while a large proportion (83.3%) of investment is self-financed which is an indication of financial disintermediation [39].
Demirgüç-Kunt et al. (2017) stated that 48% of Ethiopian adults reported saving or setting money aside, yet only 14% saved formally at financial institutions and 44% of adults reported that they borrowed money, but only 7% borrowed from financial institutions in 2014 [24]. Despite significant improvements in outreach led by the expansion of bank branches, penetration of formal financial institutions remains very limited in rural areas. The number of bank branches in Ethiopia has more than tripled in the past five years, from 970 branches in 2011 to 3,187 branches in 2016. Access to banks remains concentrated in the capital city and other urban centers. Of the total nationwide, 34.4% of branches and more than 50% of ATMs are in Addis Ababa. However, there is a large untapped market of borrowers and savers who are not using formal financial services [39].
Microfinance Institutions
Microfinance institutions (MFIs) started in Ethiopia in 1994/95, but have not been able to meet demand and aims to meet the need of small-scale borrowers in income. Unlike mainstream financial banks, microfinance companies offer a smaller loan amount. Currently, according to Association of Ethiopian Microfinance Institutions (AEMFI) (2018), there are 34 licensed MFIs with total capital of close ETB 12 billion serving around 4.5 million clients in Ethiopia. Nationwide, there are 3.8 million active savers.
Furthermore, to develop an inclusive financial system in the Ethiopia, there is a need to have well-functioning financial institutions. In order to increase branche expansion, efficiency, inclusiveness, innovations and sustainability, there is a need for interventions by banks and microfinance providers. As microfinance refers to a broad range of financial services made available to low-income clients, particularly women and serves a market segment that is considered ‘high-risk’ by formal banks [40]. To attract investors to this emerging sector, new regulations developed and conditions and obligations were simplified. The capital required to establish new MFI is ETB 200,000. As result of this, many domestic firms and non-governmental organizations are investing and establishing new MFIs [36].
Insurance Sector
Insurance penetration in Ethiopia is very low and products are concentrated in general insurance lines. The state-owned insurance company accounts for 23% of the total capital of the industry. In 2015, the ratio of total insurance premiums to GDP was 1.15%, which is much lower than the Sub-Saharan Africa average of 3.5%. Most of the insurance business in Ethiopia is targeted at the corporate market and focused on general insurance. The corporate focus implies that the insurers have had little experience in intermediating products to individuals, and cost margins have not yet been tested against the more cost-sensitive retail business. Premiums from the retail sector are almost entirely derived from motor insurance. As of December 2016, there were 17 insurance companies in Ethiopia with 465 branches. About 54.4 percent of the insurance branches were in Addis Ababa [39].
Capital Market
Capital markets in Ethiopia mainly comprise Treasury bills (T-bills) and government bonds. T-bills are transacted on a weekly basis and government bonds are occasionally issued. The maturities of T-bills are 28, 91, 182, and 364 days; 91 and 364 days are the most demanded terms. The total outstanding T-bills as of December 2016, was US$2.9 billion. The Public Servants Social Security Agency, Development Bank of Ethiopia and Private Organization Employees Social Security Agency are the three major buyers of T-bills in Ethiopia. Outstanding corporate bond holdings reached US$9 billion as of December 2016, of which 94% was held by two state-owned institutions. From which, Ethiopia Electric Power (85.4 percent) and Railways Corporation (8.7 percent). In relation to this, Commercial Bank of Ethiopia is the sole purchaser of these bonds, making the bank susceptible to the financial performance of SOEs and single-borrower risk. Ethiopia has yet to develop a secondary capital market [39].
Empirical Review
Evidence Country Specific Studies
A large body of empirical literature assesses the link between financial development, growth, inequality and poverty. Dewi et al., (2018) empirically explored the relationship between the financial sector, economic growth, and poverty reduction in Indonesia using data from the period of 1980 to 2015 [41]. Autoregressive Distributed Lag (ARDL) method used and the finding indicated that the economic development of has failed to promote the welfare of the poor. Thus, the government shall design a pro-poor and pro- growth policies and provide more credit at a lower interest rate to the private sector, specially SMEs.
Similarly, Jalilian and Kirkpatrick (2005) conclude that financial system development plays a significant role in reducing poverty and that indicate a unit change in financial development enlarges the income growth predictions of the poor by about 0.3 % [42]. In China, Ho et al., (2017) assess the impact of financial development on poverty reduction for the period of 1985 to 2014. This study empirically assessed the causal association concerning the impact of finance on poverty. It has used money supply (M2) as %age of GDP and private credit as %of GDP as a proxy measure of financial development and find out financial development reduces poverty.
In Bangladesh, Uddin et al. (2013) investigated the link between financial system development, economic growth and poverty reduction using the quarterly data over the period of 1975-2011 [43]. The findings show that there is a long run association between finance, economic progress and poverty alleviation and suggests more access to institutional credits to poor. Similarly, Sehrawat and Giri (2016) examined the link between financial development and livelihood improvement of the poor households for the period of 1970 to 2012 in India [44]. The finding result shows that finance system growth and economic progress can reduce poverty in both long run and short run.
Evidence from Cross-Country and Panel Studies
There are a lot of cross-country and panel studies. Dhrifi (2015) has built a simultaneous equations model on a sample of 89 countries through the period of 1990-2011 and tested the impact of financial development through growth-inequality and poverty triangle [5]. The findings suggeste that financial development reduce poverty by increasing the consumption of the household and growth rate of GDP per capita has a positive and significant effect on poverty reduction. In addition, indirect effect of financial development on poverty is not robust, while the direct effect of financial development is robust and reduce poverty. In addition, the effect of the institutional quality and growth rate of GDP per capita has a significant effect on poverty reduction. But Kuznets hypothesis test is insignificant and does not allow to conclude its effect.
Yet, Batuo et al. (2010) presented empirical evidence on how financial development is related to income distribution in a panel data set covering 22 African countries for the period between 1990 to 2004 [45]. A dynamic panel estimation technique (GMM) is employed and the findings indicate that income inequality decrease. It refers access to credit particularly by the poor will enable to make productive investment in education and small manufacturing sectors. The result also confirm that educational attainment play a significant role in reducing inequality. But there is no evidence supporting the Greenwood-Jovanovic hypothesis of an inverted-U shaped relationship.
In the case of South Asian developing countries by employing the panel data over the period of 1990 to 2012, Sehrawat and Giri (2015) assesed the influence of financial development on poverty alleviation [46]. The results confirm that there is a long-run association between financial development and poverty reduction and there is a positive link between financial development and trade openness and also the effect of consumer price index which is measuring inflation.
On contrast, Fowowe and Abidoye (2012) investigated the impact of financial development, inflation and trade openness on poverty reduction in a sample of African countries [47]. The result indicated that however, trade openness for import and export and low inflation of consumer price reduce poverty, financial development does not reduce poverty. Similarly, in a study made on more than 70 developing countries, Honohan (2004) has stated that association between financial depth and poverty and found out that financial depth is negatively linked with poverty [16].
However, most studies do not support the Kuznets’s hypothesis mostly on country specific factors while some found no methodical relationship between growth and inequality. Similarly, Ravallion (1997) concluded that in the presence of high inequality, poverty may still rise irrespective of the high growth in developing countries [48,50].
Research Methodology
Introduction
The objective of this paper is examining the impact of financial development on poverty, growth and inequality in Ethiopia. In measuring the impact of financial development on poverty reduction, the simultaneous effects of growth and inequality has been considered.
Research Design
By using simultaneous equations model, the study assesses the virtues of financial development in reducing poverty and consider the simultaneous effects of growth and inequality. In doing so, the study adopted explanatory approach by using annual time series data to realize the stated objective. It is a type of correlational research that involves observing variable over an extended period of time. Thus, the research design looks at a long term effect of financial development.
Source and Type of Data
The data used in this study is annual time series data for the time period of 1991 to 2019. Basically, the secondary data collected from World Bank, the World Development Indicators (WDI) database of 2019 and National Bank of Ethiopia.
Econometric Model Specification
To evaluate the impact of financial development on growth, inequality and poverty, this study used the simultaneous regression equations model. These equations are: poverty Equation (1), the growth equation (2) and inequality equation (3). To clarify the effects of financial development, the study first questioned the direct effects on the endogenous variables which are poverty, growth and inequality. Then, it focuses on the variables specific to each equation.
In order to deal with the simultaneous regression, based on the prediction of Datt and Ravailon (1992), the effects of the progress of financial development had been decomposed into two conflicting effects. These are: the growth effect and a disparity effect. Besides, Dhrifi (2015) noted on examining poverty reduction by taking into account simultaneous effect of financial development on inequality and growth [5,49]. Hence, introduction of the variable measuring financial development is taking the form of an exogenous shock. For instance, Ravallion (1997) used a model as a function of poverty which is a set of control variables that are normally employed as explaining poverty. In the equation of poverty: Gini coefficient, the GDP per capita growth; infrastructure variable and the growth of population are used. In the equation of inequality: the institutional variables that reflect how the distribution is made would be introduced. In addition, in the same equation the growth rate and its square to test the hypothesis of Kuznets are added [50].
The Kuznets curve (1955) tested in this model by considering the effect of growth of GDP per capita and through the introduction of the quadratic effect which is its square (GDPG)² [18]. The income growth influence inequality in the long run according to a non-linear or inverted "U" hypothesis. Adjusting, the shape of Kuznets curve, inequality increases in the early stages of economic development and decrease after reaching the maximum threshold but the situation is determined by the presence of quality institutions.
Furthermore, variables in simultaneous equation models are classified as endogenous and exogenous variables. Endogenous variables which are explained by the functioning of system and the values of which are determined by the simultaneous interaction of the relations in the model are endogenous. The simultaneous equations models is the endogenous variable in one equation becomes exogenous variable in another equation. This method allows us to correctly distinguish the effects of financial development passing through growth and rising inequality. Thus, in order to answer the main problem, financial development is the only explanatory variable common to all three equations are assumed. It is likely to affect simultaneously but the three endogenous variables affected in different ways. Accordingly, the overall association of this model is explained in the following way:
<img src="https://www.opastpublishers.com/scholarly-images/7799-697c2edca6b8e-the-impact-of-financial-development-on-poverty-growth-and-in.png" width="500" height="100">
Where Pov is poverty, measured by national head count ratio of the % of population living below poverty line. GDPg represent growth of GDP per capita. INQ is income inequality measured by the Gini index. FD is measured by domestic private credit as percentage of GDP. TEL is an indicator of quality of infrastructure measured by number of subscriber telephone lines per 100 inhabitants. PPg is growth rate of population. OPEN is trade openness measured by sum of import and export as % of GDP. INF is an indicator of inflation which is consumer price index. GoEx is government expenditure which is government final consumption. HK is the average years of secondary schooling in the total population which measures human capital and INST is an index measuring the institutional quality by summing up five different institutional variables.
In the simultaneous model, there is a problem of endogeneity (i.e. omitted variable in the model, measurement error in independent variables and endogenous error in relation to reverse causality in which X causes Y and Y causes X) as the variables interact simultaneously in the structural equation. Therefore, these could result in bias on OLS estimator and it could end up on the model inconsistency. Empirical studies on the inequality-development relationship could suffer from endogeneity and reverse-causality problems [9]. For instance, in Kumhof et al. (2015) the impact of higher inequality on bank lending may be caused by an increase in the income of the rich (by increasing loan supply), or it could be associated with a decrease in the income of the poor (by increasing loan demand).
As a result of endogeneity problem among the variable, the Three Stage Least Square (3SLS) model has been used. For solving endogeneity problems, the instrument variables introduced and the endogenous variable is among the explanatory variable. A resolution is given using the method of 3SLS and different econometric tests necessary to the model was made. For data analysis STATA 14.2 has been used to analyze the time series data.
Under the 3SLS estimation system of structural equations where some equations contain endogenous variables among the explanatory variable, a dependent variable has its usual interpretation as the left hand side variable in the equation with the associated disturbance term. All dependent variables that are explicitly taken to be endogenous to the system are treated as correlated with the disturbance in the system equation [51]. Since 3SLS is a full information estimation method, the parameters estimated are asymptotically more efficient than the 2SLS estimates. But 3SLS is quite vulnerable to model misspecifications. Thus, to minimize this error of the model specification, post estimation tests like endogenity test, weak instrument test, over identification tests have been used.
Furthermore, Greene (2012) demonstrates that among all the estimators of instrumental variables, 3SLS method estimator is asymptotically efficient. Basically, this model is adopted from the same methodology of Lundberg and Squire (2003) and Dhrifi (2015) to study the impact of financial development on the triangle of poverty-growth-inequality. Hence, in addition to a specific equation of poverty, the total effect of financial development is tested and an interaction with the triangle is identified. Furthermore, 3SLS method helps to differentiate the impact of financial development passing through growth and income inequality [5,51,52].
Definition of Variables, Measurement and Hypothesis
|
Variables |
Description |
Source |
|
Poverty |
Measured by national head count ratio of the percentage of population living below poverty line(see Deininger and Squire, 1996; Fields, 1989). Poverty headcount ratio at $1.25/day at 2005 PPP. It is % of population living on less than $1.25/day 2005 international prices. |
WDI |
|
Inequality |
Income inequality measured by the Gini index (see Lundberg and Squire, 1996, 2003). An index of 0 represents perfect equality, while index of 100 implies perfect inequality. |
WDI |
|
Growth |
Measured by the growth rate of real GDP per capita as a proxy for growth. |
WDI |
|
Financial Development |
Domestic private credit by banks as percentage of GDP is used as a proxy measure of it. Financial development induces growth and ultimately it reduces poverty and inequality (see Beck, Demirgüç-Kunt and Levine, 2007; and Honohan, 2004) |
WDI |
|
Institutional Quality |
Strong institutions plays a central role for efficient allocation of resource and growth (Acemoglu et al., 2005; Demirguc-Kunt and Levine 2008). This indicator is constructed from the five governance indicators. These indicators are: rule of law, control of corruption, political stability and absence of violence, government effectiveness, regulatory quality. These institutional variables are indicating information on the economic, political and social risk. The World Bank measured the estimate of governance performance ranges from approximately -2.5 (weak) to 2.5 (strong). |
WDI |
|
Trade Openness |
Defined as the sum of exports and imports as % of GDP and it captures the degree of international openness (trade openness). Trade openness reduces poverty (Sehrawat and Giri, 2016; Fowowe and Abidoye, 2012). |
NBE |
|
Government Expenditure |
Which proxies for general government final consumption. It is a representative of a role of a state in accumulation of economic growth and reducing inequality (Barro, 1991, 1997; King and Levine 1993; Appiah et al., 2020). |
NBE |
|
Human Capital |
Measured by average years of secondary schooling in the total population. It is a determinant of economic growth while the investment in human capital enhance productivity and improve walfare (see Barro, 1997). |
WDI |
|
Inflation |
It is an indicator of macroeconomic stability and a proxy of a quality of macroeconomic policy which captures its impact on poverty. Inflation is a factor deteriorating poverty as |
NBE |
|
|
it has a negative impact on the real value of asset and purchasing power of household(see Dollar and Kraay, 2002; Jeanneney and Kpodar, 2008). It is measured by consumer price index (i.e. inflation variable as the annual %age of consumer prices for Ethiopia which is not seasonally adjusted). |
|
|
Telephone |
Measured by number of subscribers of telephone lines per 100 inhabitants which capture the role of infrastructure in reducing poverty. Technological advancement can encourage financial innovation and facilitate access to credit by the poor and to finalize financial transactions at low cost (Barro, 1997; Dhrifi, 2015). |
WDI |
Source: Compiled by the author
Table 3.1: Variable, Description and Source
Result and Discussion
Econometrics Model Results
Test for Unit Root
Based on the ADF test which is shown in Table 4.1 in Appendex, the data is stationary for all variables with p value less than 0.05 at unit root test made in three different ways: (1) an equation with intercept only, (2) equation with trend and intercept and (3) an equation with no trend and no intercept. The variables of human capital and government expenditure are not stationary at level but stationary at first difference or integrated of order one.
Johansen Cointegration Test
This study assumed that there is long run relationship among the independent variables and that infers cointegration. Irrespective of shocks in the short run which may affect movement in the individual series, it converges with time in the long run. In otherwords, these variables are moving in the same direction. This implies that by observing the movement of one variable, one could predict changes in other variables. Thus, the findings show that there is a long run association between financial development and poverty reduction.
The Regression Result on Effects of Financial Development
To clarify the impact of financial development on poverty reduction, first, analyzed the direct effects on the endogenous variables which are poverty, growth and inequality. Then, focusing on variables to each equation, regression results interpreted.
Direct Impacts of Financial Development on Poverty Reduction
The regression result of GDP growth on poverty reduction shows that there is a negative and highly significant relationship between growth rate of real GDP per capita and poverty headcount ratio at national poverty line. An increase in growth rate of 1% point results in a 0.2% point decrease in head count ratio of the population living below poverty line. Concerning the effect of inequality on the incidence of poverty, the test results shows inequality measured by the Gini index is negative and insignificant, confirming it’s not robust.
Financial development on poverty reduction is the main interest of this study. The test result is significant and the coefficient of beta is positive. A point increase in level of financial development results in 0.7 points increase in the population living below the national poverty line. It means that the headcount ratio of the people living below the poverty line increases as the domestic credit to private sector by banks (% of GDP) increases. This finding is consistant with existing literatures. Greenwood and Jovanovic (1990) stated that bank credits may be caught up by high unit costs of small loans for poor and small business [17]. The imperfections in the financial market that only favor the wealthiest with the lesser risk of default and ultimately, they grow. Therefore, it can be interpreted as market failed to allocate private credit, a requirement of collateral that excludes the poor and the lenders skewness in favor of rich to reduce transaction cost might be a reason to increase the head count ratio people living below the poverty line.
Unequivocally, the success and survival of small business and also employment, growth strategies, productivity and innovation largely depend on access to financial resources. SMEs have lower productivity and this is partly related with financial constraints. The productivity is an important issue because of the creative destruction process and the spillovers will be generated for large firms and economy-wide productivity [54]. Although SMEs serve as an engine of job creation and are seedbeds of developing entrepreneurial talent and innovation, they are constrained by the access to finance [55].
The effect of population growth on the poverty is significant and positive with very high coefficient of beta which can increase the poverty whereas the investment in infrastructure can reduce poverty. For instance, rural road quality and electrification rates also remain low in rural areas and that have a negative impact on poverty (Planing and Development Commission, 2018) [66].
Indirect Impacts of Financial Development on Poverty Reduction
Financial development may also impact poverty reduction through two possible strategic variables which are economic growth and income distribution 1).
Effect of Financial Development Through Economic Growth:
On examining the results of growth equation, the model has significant effect. The test results validates the pro-poor hypothesis and consistant with theoretical predictions. As expected, a % point increase in financial deepening leads to a 2.58% point growth of real GDP per capita. In other words, for every additional amount of private credit, the expected level economy grows by 2.58%. The result is consistent with the view “trickle-down” mechanism of Jalilian and Kirkpatrick (2001) and theoretical predictions advanced by King and Levine (1993) [10,28].
|
Equation |
Obs |
Parms |
RMSE |
“R-Sq” |
Chi2 |
P |
|
|
Poverty |
29 |
5 |
1.564441 |
0.9701 |
1083.47 |
0.0000 |
|
|
Growth |
29 |
6 |
4.961694 |
0.2717 |
28.75 |
0.0001 |
|
|
Inequality |
29 |
4 |
2.052593 |
0.8754 |
211.81 |
0.0000 |
|
|
|
|
Coef. |
Std. Err. |
z |
P>/z/ |
[95% Conf. Interval] |
|
|
Poverty |
GDPg |
-.201404 |
.0835835 |
-2.42 |
0.016 |
-.3646367 |
-.3646367 |
|
|
Gini |
-.0516032 |
.2153427 |
-0.24 |
0.811 |
-.4736672 |
.3704608 |
|
|
FD |
.7016167 |
.1854564 |
3.78 |
0.000 |
.3381295 |
1.065104 |
|
|
Tele |
-.2266696 |
.0418699 |
-5.41 |
0.000 |
-.34087332 |
-.144606 |
|
|
PPg |
37.54731 |
5.330841 |
7.04 |
0.000 |
27.09905 |
47.99556 |
|
|
Cons |
-77.06599 |
14.31515 |
-5.38 |
0.000 |
-105.1232 |
-49.0088 |
|
Growth |
Gini |
2.975221 |
1.381882 |
2.15 |
0.031 |
0.2667835 |
5.683659 |
|
|
FD |
2.582125 |
1.218153 |
2.12 |
0.034 |
.1945884 |
4.969661 |
|
|
Infl |
-.4062826 |
.1520218 |
-2.67 |
0.008 |
-.7042398 |
-.1083254 |
|
|
Open |
2.100317 |
.7817064 |
2.69 |
0.007 |
.5682003 |
3.632433 |
|
|
GoEx |
-3.408718 |
1.887145 |
-1.81 |
0.071 |
-7.107456 |
.2900188 |
|
|
HK |
15.18847 |
5.695449 |
2.67 |
0.008 |
4.02559 |
26.35134 |
|
|
Cons |
-94.03097 |
58.3524 |
-1.61 |
0.107 |
-208.3996 |
20.33763 |
|
|
|
|
|
|
|
|
|
|
Inequality |
GDPg |
-.2109833 |
.0987176 |
-2.14 |
0.033 |
-.4044662 |
-.0175005 |
|
|
FD |
-.851981 |
.1028943 |
-8.28 |
0.000 |
-1.05365 |
-.6503118 |
|
|
Inst |
-7.444826 |
3.26526 |
-2.28 |
0.023 |
-13.84462 |
-1.045034 |
|
|
GGDP2 |
-.0010087 |
.0120534 |
-0.08 |
0.933 |
-.0246331 |
.0226158 |
|
|
Cons |
40.27578 |
4.011109 |
10.04 |
0.000 |
32.41415 |
48.13741 |
Source: Author’s computation from Stata
Table 4.3: Long Run Regression Result of the 3SLS Model
In addition, there is a strong positive link between growth and human capital investment and trade openness in the process of reducing poverty. But government expenditure are negative and insignificant. The result is consistent with the findings of Barro (1997) [56]. Later, it’s supported by Beck et al. (2007) that trade openness reduces poverty while inflation is harmful to the poor [2].
Although Gini coefficient is positive and significant, it refer that increasing inequality by one unit enhances growth by 2.97%. Ravallion (1997) concluded that in the presence of high inequality, poverty may still rise irrespective of the high growth in developing countries [50]. Fields (1989) stated that inequality either increase or decrease with economic growth [57]. In the presence of increased inequality could end up on higher poverty just by eliminating the gain of economic growth. (Seven and Coskun 2016; Ho and Iyke 2018) argue that due to inadequate distribution of the gain of economic growth, the positive effects of financial development are weakened by the presence of growing inequalities [7]. Basically, lack of access to finance, the positive effects of finance and the rising inequality happen at a time and it results in the benefit of growth which is expected to be gained by the poor get offset. Similarly, Datt and Ravallion (1992) refer that change in poverty measures can be decomposed into growth and redistribution components [49].
2) Effect of Financial Development through Distribution Chunnel: Based on the results of the indirect effects, the distribution channel reveals that a expansion in financial service has a negative effect on the rate of poverty. An increase in one unit of the financial development indicator leads to 0.85% point decrease in Gini coefficient. This result refers that access to financial service enhances income distribution and ultimately, decreases poverty.
The test result of economic growth shows that a percentage increase in growth rate of GDP results in a 0.21% point decrease in inequality. It refers growth has a negative impact on income inequality since growth is often positively associated with higher tax revenue for socioeconomic expenditures (eg. for health and education), investments and access employments. Thus, it is concluded that growth trickle-down through distribution channel and reduces poverty.
In examining the institutional variable introduced to the model, a strong financial institution plays a negative coefficient as expected at 5% threshold level which validating the hypothesis. Indeed, it is evident from the result that improving the quality of institution by one standard deviation point leads to decrease in inequality rate by 7.44 percentage points. The institutional variables that reflect the quality of governance directly affects the interaction between economic agents like control of corruption or rule of law or government procedures. This indicates that to having an effective income distribution policy instrument can reduce poverty.
Furthermore, through the introduction of the effect of growth of real GDP per capita and the quadratic effect (GDPG)², Kuznets curve estimation result has been made and the test result shows that the coefficient of the growth rate of GDP per capita is significant and negative, whereas the coefficient of (GGDP)² is insignificant and negative. Thus, the inverted “U” shape of Kuznets curve that is explaining the average income inequality in the long run of the model is unverified. This finding refers that it is inconsistent with the dualistic theories that dictates that inequality and growth positively associated, then, stabilize at the peak to the turning point and at final phase of redistribution effect, the inequality decreases. Similarly, Batuo et al. (2010) find out no evidence supporting the hypothesis whereas Deininger and Squire (1996) stated that there is no systematic linkage between growth and aggregate inequality [45,58].
On other hand, the short run regression result has no significant change in p values nor in the coefficient of beta estimates and change in the sign. The result is more or less similar to long run results. The only difference in the short run result is the P value of Gini in direct channel of first equation and the P value of government expenditure in second equation. The p value of Gini has turned up to be significant in short run and the coefficient is positive.
Diagnostic Test for Validity
Autocorrelation Test: Duribin-Watson (DW) test statistic values in the regression result shown below for respective simultaneous equations. The DW d-statistic (6, 29) = 0 .9262703, (7, 29), α = 2.390341 and (5, 29), α = 0 .6795734 for equation #1, #2 and #3 of respectively. The DW table shows at 5% significance level the critical value to test autocorrelation of lower (dL) and upper (dU) is (1.050 and 1.841); (0.975 and 1.944); (0.900 and 2.052) for equation #1, #2, and #3 respectively. Therefore, it is concluded that there is no autocorrelation.
Multicollinearity Test:The correlation table 4.3 in Apendex shows that the correlation between independent variables indicates there is no series multicollinearity. It indicates that the VIF result is less than 10 and it indicates that there is no serial correlation in that model.
|
Breusch-Pagan/ Cook-Weisberg test for heteroscedasticity; Ho: Constant Variance |
||
|
Variables: Fitted values of Poverty, Pov |
Variables: Fitted values of Growth of GDP, GDPg |
Variables: Fitted values of Gini |
|
Chi2 (1) = 0.11 Prob > chi2 =0.7434 |
Chi2 (1) = 7.58 Prob > chi2 =0.0059 |
Chi2 (1) = 0.16 Prob > chi2 =0.6855 |
Source: Author's computation from Stata
Table 4.4: Heteroscedasticity Test
The above results shows in the variables fitted values of 1st equation poverty and 3rd equation Gini, the p value is >0.05. In both cases, there is constant variance. Therefore, fail to reject Ho. But in the 2nd equation, p value is < 0.05 and it indicates that the model is heteroscedastic.
Diagnostic Tests for Endogeneity, Over Identification and Weak Instrument
Based on the ivregress test results of each simultaneous equations of the corresponding diagnostics, the decision is made for each test. For endogeneity test, the ivregress result shows that P value and the beta coefficients are significant. Furthermore, based on the Durbin and Wu-Hausman’s test result of the P value of endogeneity test of each equation is below 0.05. Therefore, the variables are endogenous and the instrumental variables are strongly correlated.
The test result of over identification of Sargan (score) for each equation is insignificant. It indicates the instruments are good and valid instrument and error terms are not correlated with instrumental variables. Moreover, weak instrument test shows minimum eigenvalue =35 which is high and greater than the critical value it means that it is possible to reject the null hypothesis that the instruments are weak. Besides to that, R square = 0.9 which is high and it indicates stronger instruments. Also, F statistics is significant both simultaneous equation #1 and #2. But for equation #3, it’s failed to reject the null hypothesis and there are cases where the literature on weak IV detection is still limited and open for the debate in econometrics.
Conclusion and Policy Implications
To understand full picture of the multidimensional effect of financial development, simultaneously evaluating through growth-inequality-poverty triangle is very critical and one step ahead of traditional framework of earlier literatures. Thus, this study explored to examine the impact of financial development on poverty, economic growth and inequality in Ethiopia. As a result of economic policy change in 1991, the time series data has been used for the time period of 1991 to 2019 by employing the simultaneous equation model. Then, theoretical framework developed to analyze the link between financial development and growth-inequality-poverty triangle with simultaneous effect.
The direct impact of financial development on poverty reduction through access to financial service increases the head count ratio people living below the poverty line. It indicates that financial development is failed to benefit the poor through the direct channel and not necessary helps the poor. Primarly, the wealthy, oligarchy and the politically connected reap benefit from the improvement of financial system. The imperfection of financial market, inefficiency of allocating credit, transaction cost, requirement of collateral and lenders preference to finance rich can be reasons to the increase in head count ratio of people living below the poverty line.
The indirect impact of financial development on poverty reduction findings support the existence of a positive and significant effect through growth and income distribution channel. This impacts positively on levels of job creation, capital accumulation, savings or technological innovations. The finding supports the theory of trickle-down and conclude that it is pro-growth.
A strong financial institution has a significant effect on reducing inequality while effective governance, rule of law, political stability and income distribution policy instrument can reduce poverty. On other hand, the findings of the inverted “U” shape of Kuznets curve that is explaining the average income and inequality in the long run of the model is unverified. Therefore, the theoretical and empirical prediction is not supported, however, Kuznets argues when the financial system develops, the credit constraint can be removed; the poor can borrow and reduce inequality. This refers that it is inconsistent with the dualistic theories.
In addition, there is an interesting finding on long-run cointegration association between financial development and poverty reduction. In general, therefore, it is concluded that financial development plays a significant role on poverty reduction and mainly, through the indirect channel of economic growth and income distribution both in short run and long run.
The government shall design a compulsory pro-poor public policy inquiring financial institutions to allocate certain percentage of loan to poor, SMEs and informal sectors. In this, the government shall give guarantee for financial institutions to minimize the risk of default as the poor lacks collateral. When the financial market not functioning efficiently, alterative policy option can play instrumental role to poverty reduction and architecture for sustainable development as it is creating opportunity for poor to send their children school, to manage health needs, to finance innovative and productive projects, to invest in human and physical capital. This in turn will help to promote inclusive financial system and create resilient growth trajectory that move from vicious to virtuous cycle and ultimately enhance innovation, productivity, entrepreneur and industrial development.
References
- Seers, Dudley (1969). The Meaning of Development.International Development Review 11)4):3-4
- Beck, T., Demirgüç-Kunt, A., & Levine, R. (2007). Finance, inequality and the poor. Journal of economic growth, 12, 27- 49.
- Cihák, M., Demirgüç-Kunt, A., Feyen, E., & Levine, R. (2012). Benchmarking financial systems around the world. World Bank policy research working paper, (6175).
- Quartey, P. (2008). Financial sector development, savings mobilization and poverty reduction in Ghana. In Financial development, institutions, growth and poverty reduction (pp. 87-119). London: Palgrave Macmillan UK.
- Dhrifi, A. (2015). Financial development and the" Growth- Inequality-Poverty" triangle. Journal of the Knowledge Economy, 6(4), 1163-1176.
- Abosedra, S., Shahbaz, M., & Nawaz, K. (2016). Modeling causality between financial deepening and poverty reduction in Egypt. Social Indicators Research, 126, 955-969.
- Ho, S. Y., & Njindan Iyke, B. (2018). Financial development,growth and poverty reduction: Evidence from Ghana.
- Tekin, I., & Cin, M. F. (2020). Finance, Growth and Income Distribution. Finans Politik & Ekonomik Yorumlar, 57(653), 161-188.
- Demirgüç-Kunt, A., & Levine, R. (2009). Finance and inequality: Theory and evidence. Annu. Rev. Financ. Econ., 1(1), 287-318.
- Jalilian H., Kirkpatrick C. (2001). Financial Development and Poverty Reduction in Developing Countries. Finance and Development Research Programme. Working Paper Series
- Alemayehu Geda, Abebe S. and Daniel Z. (2006). Finance and Poverty in Ethiopia. A Household Level Analysis. Research Paper No. 2006/51 United Nations University.
- World Bank (2018). World Bank country profile of 2018
- National Bank of Ethiopia (2018/19). Annual Report
- Tita, A. F., & Aziakpono, M. J. (2017). The effect of financial inclusion on welfare in sub-Saharan Africa: Evidence from disaggregated data. Economic Research Southern Africa, Working Paper, 679.
- Appiah, M., Frowne, D. I., & Tetteh, D. (2020). Re-examining the nexus between financial development and poverty reduction: evidence from emerging economies. Applied Economics Journal, 27(2), 125-144.
- Honohan, P. (2004). Financial development, growth and poverty: how close are the links?. In Financial development and economic growth: Explaining the links (pp. 1-37). London: Palgrave Macmillan UK.
- Greenwood, J., & Jovanovic, B. (1990). Financial development, growth, and the distribution of income. Journal of political Economy, 98(5, Part 1), 1076-1107.
- Kuznets, S. (1955). Economic Growth and Income Inequality.American Economic Review, 45, 1–28
- Levine, R. (2005). Finance and growth: theory and evidence.Handbook of economic growth, 1, 865-934.
- Claessens, S., and E. Feijen. 2006. Financial Sector Development and the Millennium Development Goals. World Bank Working Paper No. 89, World Bank, Washington, DC.
- McKinnon, R. I. (1973). Money and Capital in Economic Development. Washington, D.C.
- Banerjee, A. V., & Newman, A. F. (1993). Occupational choice and the process of development. Journal of political economy, 101(2), 274-298.
- Galor, O., & Zeira, J. (1993). Income distribution and macroeconomics. The review of economic studies, 60(1), 35- 52.
- Demirguc-Kunt, A., Klapper, L., Singer, D., Ansar, S., & Hess, J. (2017). Measuring financial inclusion and the fintech revolution. The Global Findex Database.
- Zhuang, J., Gunatilake, H. M., Niimi, Y., Khan, M. E., Jiang, Y., Hasan, R., ... & Huang, B. (2009). Financial sector development, economic growth, and poverty reduction: A literature review. Asian Development Bank Economics Working Paper Series, (173).
- Aghion, P., & Bolton, P. (1997). A theory of trickle-down growth and development. The review of economic studies, 64(2), 151-172.
- Fields, G. (2001). Distribution and Development: A New Look at the Developing World. NY: Russell Sage Foundation, and Cambridge, MA: MIT Press.
- King, R. G., & Levine, R. (1993). Finance, entrepreneurshipand growth. Journal of Monetary economics, 32(3), 513-542.
- Claessens, S., & Perotti, E. (2007). Finance and inequality: Channels and evidence. Journal of comparative Economics, 35(4), 748-773.
- Shaw, E. S. (1973). Financial deepening in economic development.
- Naceur, M. S. B. (2016). Financial Development, Inequality and Poverty. International Monetary Fund.
- Bourguignon, F. (2004). The poverty-growth-inequality triangle (No. 125). Working paper.
- Dollar, D., & Kraay, A. (2002). Growth is Good for the Poor.Journal of economic growth, 7, 195-225.
- Ogbeide, E. N. O., & Agu, D. O. (2015). Poverty and income inequality in Nigeria: any causality?. Asian economic and financial review, 5(3), 439.
- Ray, D. (1998). Development economics. Princeton University Press.
- Abachi, N. (2007). Ethiopia MFI Country Scan. MicroNed.
- World Bank (2014). Ethiopia Financial Sector Development:The Path to an Efficient Stable and Inclusive Financial Sector,World Bank.
- Prosperity, S. (2016). Taking on Inequality. Washington, DC: World Bank.
- World Bank (2017). World Development Indicators.
- Mulatu, E., & Wamatu, J. (2020). Ethiopian Micro-FinanceLandscape Report.
- Dewi, S., Majid, M. S. A., & Kassim, S. (2018). Dynamics of financial development, economic growth, and poverty alleviation: The Indonesian experience. South East European Journal of Economics and Business, 13(1), 17-30.
- Jalilian, H., & Kirkpatrick, C. (2005). Does financial development contribute to poverty reduction?. Journal of development studies, 41(4), 636-656.
- Uddin, G. S., Shahbaz, M., Arouri, M., & Teulon, F. (2014). Financial development and poverty reduction nexus: A cointegration and causality analysis in Bangladesh. Economic modelling, 36, 405-412.
- Sehrawat, M., & Giri, A. K. (2016). Financial development and poverty reduction in India: an empirical investigation. International Journal of Social Economics, 43(2), 106-122.
- Enowbi Batuo, M., Guidi, F., & Mlambo, K. (2010). Financial development and income inequality: Evidence from African Countries.
- Giri, A. K. (2015). Financial development, poverty and rural-urban income inequality: evidence from South Asian countries.
- Fowowe12, B., & Abidoye, B. (2012). A Quantitative Assessment of the Effect of Financial Development on Poverty in African Countries.
- Bourguignon, F. (2003). The growth elasticity of poverty reduction: explaining heterogeneity across countries and time periods.
- Datt, G., & Ravallion, M. (1992). Growth and redistribution components of changes in poverty measures: A decomposition with applications to Brazil and India in the 1980s. Journal of development economics, 38(2), 275-295.
- Ravallion, M. (1997). Can high-inequality developing countries escape absolute poverty?. Economics letters, 56(1), 51-57.
- Zellner, A. (1962). Three stage least squares: simultaneous estimation of simultaneous equtions. Econometrica, 30, 63- 68.
- Green, H. (2012). Econometric Analysis. 7th InternationalEdition, Pearson, New York University.
- Lundberg, M., & Squire, L. (2003). The simultaneous evolution of growth and inequality. The economic journal, 113(487), 326-344.
- Bakhtiari, S., Breunig, R., Magnani, L., & Zhang, J. (2020). Financial constraints and small and medium enterprises: A review. Economic Record, 96(315), 506-523.
- Ayyagari, M., Demirgüç-Kunt, A., & Maksimovic, V. (2008). How important are financing constraints? The role of finance in the business environment. The world bank economic review, 22(3), 483-516.
- Barro, R. J. (1996). Determinants of economic growth: A cross-country empirical study.
- Fields, G. S. (1989). Changes in poverty and inequality in developing countries. The World Bank Research Observer, 4(2), 167-185.
- Deininger, K., & Squire, L. (1996). A new data set measuring income inequality. The World Bank Economic Review, 10(3), 565-591.
- Abosedra, S., Shahbaz, M., & Nawaz, K. (2016). Modeling causality between financial deepening and poverty reduction in Egypt. Social Indicators Research, 126, 955-969.
- Acemoglu, D., Johnson, S., & Robinson, J. A. (2005). Institutions as a fundamental cause of long-run growth. Handbook of economic growth, 1, 385-472.
- Geda, A. (2006). The structure and performance of Ethiopia’s financial sector in the pre-and post-reform periods, with a special focus on banking. In Domestic Resource Mobilization and Financial Development (pp. 163-202). London: Palgrave Macmillan UK.
- Bazillier, R., & Hericourt, J. (2017). The circular relationship between inequality, leverage, and financial crises. Journal of Economic Surveys, 31(2), 463-496.
- Beck, T., Demirguc-Kunt, A., & Levine, R. (2004). Finance,inequality, and poverty: Cross-country evidence.
- Jeanneney, S. G., & Kpodar, K. (2008). Financial development and poverty reduction: can there be a benefit without a cost?.
- Kumhof, M., Rancière, R., & Winant, P. (2015). Inequality, leverage, and crises. American economic review, 105(3), 1217-1245.
- Planning and Development Commission (2018). Poverty and Economic growth in Ethiopia: 1995/96-2015/16
- Seven, U., & Coskun, Y. (2016). Does financial development reduce income inequality and poverty? Evidence from emerging countries. Emerging Markets Review, 26, 34-63.
Appendix
Table 4.1: Dickey-Fuller Test for Unit Root
|
Variables |
p-value for Z(t) |
Test Statistic |
1% Critical Value |
5% Critical value |
10% Critical value |
|
|
Pov |
0.0485 |
-3.422 |
-4.352 |
-3.588 |
-3.233 |
Trend regress lags(0) |
|
GDPg |
0.0008 |
-4.652 |
-4.352 |
-3.588 |
-3.233 |
Trend regress lags(0) |
|
Gini |
0.0024 |
-3.082 |
-2.479 |
-1.706 |
-1.315 |
Drift reg log(0 |
|
FD |
0.0154 |
-2.283 |
-2479 |
-1.706 |
-1.315 |
Drift reg log(0 |
|
Infl |
0.0004 |
-4.827 |
-4.352 |
-3.588 |
-3.233 |
Trend regress lags(0) |
|
Tele |
|
3.347 |
-2.655 |
-1.950 |
-1.601 |
Noconstant reg lags(0) |
|
Open |
0.0090 |
-2.523 |
-2.479 |
-1.706 |
-1.315 |
Drift reg log(0) |
|
GoEx* |
0.0000 |
-5.360 |
-3.736 |
-2.994 |
-2.628 |
*At first difference |
|
HK* |
0.0289 |
-3.070 |
-3.736 |
-2.994 |
-2.628 |
*At first difference |
|
PPg |
0.0094 |
-2.520 |
-2.492 |
-1.711 |
-1.318 |
Drift reg log(0) |
|
Inst |
0.0115 |
-2.418 |
-2.479 |
-1.706 |
-1.315 |
Drift reg log(0) |
|
GGDP2 |
0.0310 |
-3.587 |
-4.352 |
-3.588 |
-3.233 |
Trend regress lags(0) |
Source: Author, Results from Stata, Time Series Data
Table 4.2: Short Run Regression Result of the 3SLS Model
|
Equation |
Obs |
Parms |
RMSE |
“R-Sq” |
Chi2 |
P |
|
Poverty |
29 |
6 |
3.53e-09 |
1.0000 |
2.28e+18 |
0.0000 |
|
Growth |
29 |
7 |
9.73e-08 |
1.0000 |
1.18e+17 |
0.0000 |
|
Inequality |
29 |
5 |
2.009075 |
0.8807 |
227.70 |
0.0000 |
|
|
|
Coef. |
Std. Err. |
z |
P>/z/ |
[95% Conf. Interval] |
|
|
Poverty |
|
|
|
|
|
|
|
|
|
GDPg |
-.0760524 |
1.39e-09 |
-5.5e+07 |
0.000 |
-.0760525 |
-.0760524 |
|
|
Gini |
.070306 |
4.61e-09 |
1.5e+07 |
0.000 |
.070306 |
.070306 |
|
|
FD |
.8426085 |
3.92e-09 |
2.2e+08 |
0.000 |
.8426085 |
.8426085 |
|
|
Tele |
-.2187417 |
9.24e-10 |
-2.4e+08 |
0.000 |
-.2187417 |
-.2187417 |
|
|
PPg |
39.54952 |
1.16e+07 |
3.4e+08 |
0.000 |
39.54952 |
39.54952 |
|
|
e1 |
1 |
4.08e-09 |
2.4+08 |
0.000 |
1 |
1 |
|
|
-Cons |
-89.57426 |
2.98e-07 |
-3.0e+08 |
0.000 |
-38.19475 |
-38.19474 |
|
Growth |
Gini |
.9521347 |
2.57e-08 |
3.7e+07 |
0.000 |
.9521347 |
.9521348 |
|
|
FD |
.7453725 |
2.27e-08 |
3.3e+07 |
0.000 |
.7453725 |
.7453726 |
|
|
Infl |
-.2793468 |
2.86e-09 |
-9.8e+07 |
0.000 |
-.2793468 |
-.2793468 |
|
|
Open |
1.263962 |
1.48e-08 |
8.5e+07 |
0.000 |
1.263962 |
1.263962 |
|
|
GoEx |
-.9266328 |
3.69e-08 |
-2.5e+07 |
0.000 |
-.9266328 |
-.9266327 |
|
|
HK |
6.703311 |
1.10e-07 |
6.1e+07 |
0.000 |
6.70331 |
6.703311 |
|
|
e2 |
1 |
4.09e-09 |
2.4e+08 |
0.000 |
1 |
1 |
|
|
-Cons |
-38.19475 |
1.08e-06 |
-3.5e+07 |
0.000 |
-38.19475 |
-38.19474 |
|
Inequality |
|
|
|
|
|
|
|
|
|
GDPg |
-.1718218 |
.0774047 |
-2.22 |
0.026 |
-.3235323 |
-.0201114 |
|
|
FD |
-.8657284 |
.098453 |
-8.79 |
0.000 |
-1.058693 |
-.672764 |
|
|
Inst |
-7.302711 |
3.021052 |
-2.42 |
0.016 |
-13.22386 |
-1.381559 |
|
|
GGDP2 |
.0003811 |
.0116614 |
0.03 |
0.974 |
-.0224749 |
.0232371 |
|
|
e3 |
-.0115952 |
.0141946 |
-0.82 |
0.414 |
-.0394162 |
.0162257 |
|
|
Cons |
40.36789 |
3.725613 |
10.84 |
0.000 |
33.06582 |
47.66996 |
|
Endogenous variables: Pov GDPg Gini |
|||||||
|
Exogenous Variables: FD Tele PPg e1 Infl Open GoEx HK e2 Inst GGDP2 e3 |
|||||||
Source: Author’s computation from Stata
Table 4.4: Correlation Matrix from Stata Command for Each Equation of the Model
Test for collinearity of equation #1
|
|
GDPg |
Gini |
FD |
Tele |
PPg |
|
GDPg |
1.0000 |
|
|
|
|
|
Gini |
-0.4262 |
1.0000 |
|
|
|
|
FD |
0.3026 |
-0.9073 |
1.0000 |
|
|
|
Tele |
0.3211 |
-0.0654 |
-0.0987 |
1.0000 |
|
|
PPg |
-0.5519 |
0.7801 |
-0.6521 |
-0.5927 |
1.0000 |
Test for collinearity of equation #2
|
|
GDPg |
Gini |
FD |
Infl |
Open |
GoEx |
HK |
|
GDPg |
1.0000 |
|
|
|
|
|
|
|
Gini |
-0.4262 |
1.000 |
|
|
|
|
|
|
FD |
0.3026 |
-0.9073 |
1.0000 |
|
|
|
|
|
Infl |
-0.0925 |
0.0924 |
-0.1209 |
1.0000 |
|
|
|
|
Open |
0.5626 |
-0.7711 |
0.5871 |
0.2653 |
1.0000 |
|
|
|
GoEx |
0.4884 |
-0.3762 |
0.2083 |
0.1913 |
0.4937 |
1.0000 |
|
|
HK |
0.5131 |
-0.3656 |
0.1205 |
0.3798 |
0.5883 |
0.8956 |
1.0000 |
Test for collinearity of equation #3
|
|
Gini |
GDPg |
FD |
Inst |
â?»GGDPâ?»^2 |
|
Gini |
1.0000 |
|
|
|
|
|
GDPg |
-0.4262 |
1.0000 |
|
|
|
|
FD |
-0.9073 |
0.3026 |
1.0000 |
|
|
|
Inst |
-0.7539 |
0.4478 |
0.6254 |
1.0000 |
|
|
GGDP2 |
0.3146 |
0.0081 |
-0.3616 |
-0.3672 |
1.0000 |
Source: Author’s computation from Stata