

Research Article - (2025) Volume 3, Issue 3
Sustainable Water Management for Urban Growth: River Water Quality Assessment for Construction in Addis Ababa
2College of Technology and Built Environment, Addis Ababa University, Ethiopia
Received Date: Jul 28, 2025 / Accepted Date: Aug 21, 2025 / Published Date: Aug 27, 2025
Copyright: ©2025 Tilahun Derib Asfaw, et al. This is an open-access article distributed under the terms of the Creative Commons Attribution License, which permits unrestricted use, distribution, and reproduction in any medium, provided the original author and source are credited.
Citation: Asfaw, T. D., Negash, A. D. (2025). Sustainable Water Management for Urban Growth: River Water Quality Assessment for Construction in Addis Ababa. J Water Res, 3(3), 01-10.
Abstract
Addis Ababa faces severe water shortages, exacerbated by increasing urbanization and the growth of the construction sector. The city’s water supply coverage is approximately 54%; moreover, the construction sector also uses the piped water supply. This research investigated the technical feasibility of using water from four rivers as an alternative water source for construction. Water samples were analysed in the laboratory for pH, total solids, and chemical composition, and their impact on the construction industry was assessed according to ASTM and ACI standards. The result of Water Quality Index (WQI) showed that the values vary between 15.5 and 41.6. The results revealed that the river water samples met the permissible standards for construction. The Bulbula sample had the highest compressive strength, while the Betel sample showed high levels of nitrate and acidity. The result emphasized the potential of Addis Ababa’s rivers to improve the city’s water supply challenges by offering construction demands. However, ongoing surveillance and potential treatment of river water are recommended, particularly for large-scale projects where long-term viability is essential. The research highlighted the need for sustainable water resource management strategies to reconcile urban growth with ecological preservation.
Keywords
Addis Ababa, Urban Rivers, Water Quality Index, Water Source
Introduction
Global water demand has increased by 55%, and around 25% of major cities are suffer from some degree of water stress [1]. Moreover, the spatial distribution of water resources affects effective utilization. In Ethiopia, water resources are unevenly distributed. The river basins in the western part of the country account for approximately 70% of its water resources. Conversely, a substantial volume of the water demand, particularly for irrigation, exists in the eastern portion, indicating a heavy imbalance that leads to severe water stress, which poses serious threats to human lives, livelihoods, and economic stability [2].
In Ethiopia, the average per capita water consumption varies between 10 and 20 liters per day in some urban areas and 3 to 4 liters per person per day in rural areas [3]. It is obvious that the per capita consumption varies with time. For example, the country’s ten-year development plan (2021-2030) indicated that urban residents have access to 100 liters of tap water per person per day in grade one cities. Addis Ababa, the capital of Ethiopia and the headquarters of the African Union, has more than five million people living and is classified as a grade one city. The average population growth rate of the city is about 3.8% [4]. The city has a significant impact on the country’s economy. It accounts for about 29% of the urban GDP in Ethiopia [5]. Yet, the city continues to encounter issues in developing infrastructures.
A significant imbalance between demand and supply of water is recognized. The city faces water stress and fails to satisfy domestic water demand. It requires an estimated supply of about 1.2 million m3/day to meet the current demand for water. As per the study by Gebrekidan the city met merely 54% of the daily requirement [6]. Moreover, reported that the unmet demand for the city in 2015 was roughly 208 million cubic meters (MCM) of water and predicted that this figure would rise to 307 MCM by 2030 [7]. The unmet demand for water will rise by 48% over 15 years. This discrepancy is in stark contrast with the current water production rates from both surface water and groundwater. Legedadi, Gefersa, and Dire reservoirs are the primary surface water sources for Addis Ababa, while the Akaki and Legedadi wellfields serve as the primary groundwater sources.
Due to water shortages, the city is implementing a rationing system in certain parts. In different parts of the city, residents receive water two to three times a week [8]. This limited water supply coverage could trigger multifarious effects on sanitation, food, health, and aesthetic services of the community [6]. Conversely, there are numerous large-scale constructions throughout the city that require ample water. The construction sector, particularly in larger towns, relies heavily on potable water. This reliance contributes to the shortage of domestic water supply.
The existing situation indicated that the construction industry has utilized a piped water supply for mixing and curing concrete, which imposes an extra burden on the city’s water distribution network. The research studies showed that the construction sector utilizes 24 to 33 % of the total water consumption, which is about one- third of the domestic water demand. The construction industries consume water in massive quantities, either directly or indirectly. For instance, the study conducted by Gholamreza indicated that the virtual water consumption of residential building construction is about 20.8 m3/m2 of the building’s surface area [9]. Moreover, the study by Bardhan in India showed that the daily water consumption of a building construction is almost equivalent to the water requirements of 25 families/day. The demand for water in the construction sector varies depending on the size, location, climate, manufacturing process, and technologies used [10].
A study by Mohamed indicated that indirect water consumption, such as material production, site cleaning and related tasks, accounted for about 85% of the total water consumption, while direct water consumption accounted for around 15% of the total water consumption [11]. The research further revealed that the typical virtual water consumption on the construction sites was approximately 106.8 lit/m2 of the building surface area.
The 2024 Ethiopian construction market report indicated that the construction industry had grown by 5.6% in 2023 and is expected to register an average annual growth of 8.9% from 2024 to 2027. The water demand of the construction industry is increasing along with the increment of investment in the sector. The construction industry in Addis Ababa is a significant sector that encompasses various areas such as housing, road construction, real estate, and riverside developments. However, water is not seen or treated as a key material in civil construction.
The quality of water significantly affects the strength, durability and workability of concrete. Different standards and guidelines, including ASTM C1602, BS EN 1008 and ACI 318, specify the permissible water quality for construction purposes. The ASTM C1602 standard outlines the impurity limits for mixing water in concrete, while BS EN 1008 provides guidelines for evaluating the appropriateness of water for construction. Moreover, the Indian Standard IS 456:2000 outlines allowable limits for various contaminants. The standards stated that the water use during construction must not have any adverse effects on the properties of the concrete. The presence of contaminants like chlorides, sulfates, alkalis and organic substances in water can adversely affect construction. Water with a pH in the range of 6.0 to 8.0 is ideal for concrete mixing [12]. High levels of contaminants lead to decreased concrete strength, reinforcement corrosion, and long- term durability issues [13,14]. Sulfates (>1000 ppm) can lead to expansion and cracking in concrete, whereas chlorides (>500 ppm) speed up the corrosion of steel reinforcement. High organic matter content in water (>200 mg/L) may delay setting time and decrease the compressive strength [15]. Highly acidic or alkaline water may disrupt hydration processes, resulting in poor workability and lower comprehensive strength.
In a similar way, water hardness, caused by dissolved calcium and magnesium, can influence the setting time and consistency of cement pastes.
Several studies have investigated the suitability of water from different sources for mixing and curing concrete; Sai assessed the effectiveness of treated wastewater in concrete mixing and curing, and Negiya examined the appropriateness of potable, deep well, rain and river water sources for concrete production [16,17]. Furthermore, Ashish and Chhipa evaluated the effectiveness of tap water, grey water, and reverse osmosis wastewater for mixing concrete [18]. The studies suggest that utilizing water from different sources requires rigorous water quality monitoring at construction sites. Structural integrity can be ensured if the water used for construction meets the minimum standards of chemical and physical water quality criteria.
The influence of river water quality on the effectiveness of concrete has yet to be studied. This study examined the suitability of raw river water for construction purposes. It also evaluated the management of sustainable water resources in urban development. The impact the raw water on the compressive strength of concrete production was investigated according to ASTM and ACI standards. The outcome of the study has an impact on city water management, which improves the water supply coverage by reducing the dependency of the construction demand on urban water supply networks.
Methods
Study Area
The Akaki river system, a sub-basin of the Awash River, originates in the Entoto and Wechacha Mountains, flows through all eleven sub-cities of Addis Ababa, and finally reaches the Aba Samuel Reservoir, the first hydroelectric dam in Ethiopia, located just after the boundaries of Addis Ababa. The river has two major tributaries: Tiliku (Great) and Tinishu (Little) Akaki Rivers. Both tributaries also have numerous branches that flow into the main river system. The tributaries of the Akaki River have a large quantity of water that can flow through the city. The little Akaki, which originates in the Wechacha Mountains area (about 40 km long), and great Akaki, which originates in the Entoto Kidane Miheret (nearly 53 km long). They provide vital economic, socio-cultural, and environmental benefits to population living along the rivers. Figure 1 shows that major rivers within the boundaries of Addis Ababa, the Little Akaki and the Great Akaki rivers, are located on the left and right sides, respectively.
The rivers in Addis Ababa are one of the alternative sources of water for construction projects. The upper reaches of the rivers offer untapped opportunities for utilizing water in construction. These rivers have exhibited different flow capacities and quality levels depending on their exposure to pollution. The quality of river water deteriorates over time due to the unrestricted waste disposal trend. However, regulation no. 180/2024, Addis Ababa city introduced riverbank development and pollution prevention. The regulation banned pollutants and imposed penalties. The new regulation will improve the conditions of rivers and is expected to be a significant improvement in water quality.
Sampling Locations
Water samples were taken at four different locations to assess the raw water quality along the rivers. Samples were taken during the low flow period to detect the worst levels of pollution, as the effects of runoff dilution are minimal. The sampling locations were selected purposefully, taking into account the flow rate, accessibility, and anticipated water quality. The focus was on the upper and middle reaches of the rivers, as the quality decreases downstream and critical at the outlet [19]. Settlements near the river banks and disposal of waste into the waterways are affecting the river’s water quality. Agricultural practices also contribute to the deterioration of water quality in the rivers.
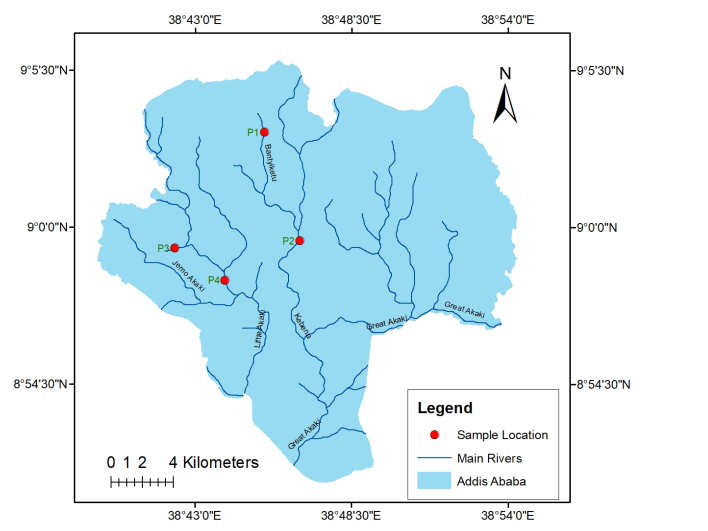
Figure 1: Map of Addis Ababa Rivers and Sample Collection Points
As illustrated in Figure 1, grab samples were collected from four rivers, and are designated as P1, P2, P3, and P4. Sample P1 was collected upstream of the Bantyeketu River, where minimal disturbance is anticipated due to limited urban activities. The second sample, P2, from the confluence of the Bantyeketu and Bulbula rivers in a densely populated urban area, exhibited a color change, indicating that the river is moderately impacted by wastewater discharge. The third sample, P3, collected from the upstream Tinishu (Little) Akaki river, which is relatively moderate populated and had agricultural practices, exhibited physical contaminants and a distinct odor. The final sample, P4, collected from the confluence of the Tinishu (Little) and Betel rivers, is considered to be the most impacted of the three; turbid water was observed at this location. This has significant impacts due to farming and residents living along the river sides. At each sampling point, the river flow velocity was measured using the conventional method (floating method), and the cross-section flow depth was measured to compute the flow rate. River discharges during the dry season at the specified sampling points were 0.30, 1.01,0.49 and 1.37 m3/sec at locations P1, P2, P3 and P4, respectively. This indicates that the rivers have a substantial flow rates.
Sampling and Testing Techniques
The water samples were collected using 20-liter containers, which were collected by wading in the middle of the rivers. The samples were carefully handled to preserve their quality. In addition, the sample containers were thoroughly cleaned with distilled water. A portion of the water sample was sent to the water quality laboratory for chemical parameters testing; the remaining quantity was used to mix and cure concrete samples. A list of tests was prepared and labeled according to the requirements of concrete quality standards. The tests were conducted following the laboratory protocols. The pH levels, suspended and dissolved solids, and chemical composition parameters were tested in the water quality laboratory. The sample water was inspected for compliance with the requirements based on the standards listed under Table 1. Most physical parameters such as oil and fat, detergents, colour, odor and humic matters were analyzed by observation.
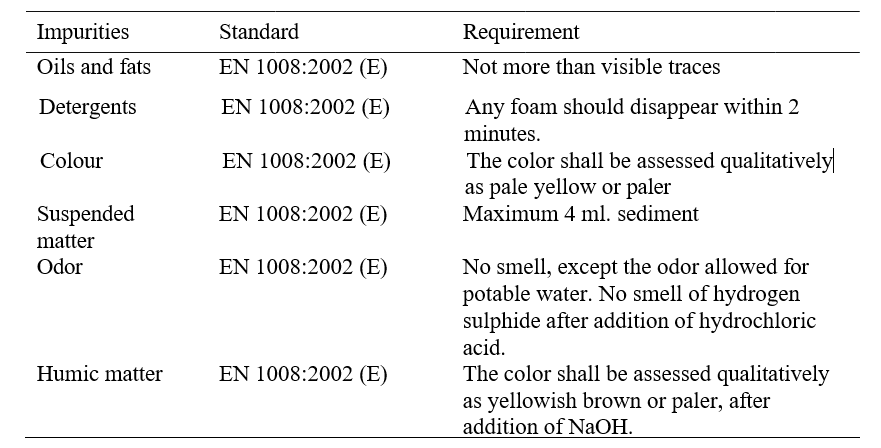
Table 1: Requirements and Test Procedures for Preliminary Inspection of Mixing Water
The laboratory experiments started with the preparation and testing of concrete-making materials. The materials are proportioned, and a mix design was formulated for C-20 grade concrete. It followed a specific mix ratio, which was consistent for both potable water and the collected river water samples. The mix ratio was 1:1.87:2.58 for cement, sand, and aggregate, respectively. For each batch, 15.5 kg of cement, 29 kg of sand, 40 kg of aggregate, and 7 liters of water were used. The same ratio was applied across all water samples to maintain consistency in the comparison. The materials were measured by weight to ensure precision. The aggregate and sand were thoroughly inspected and cleaned to remove any dust and organic matter before use. Concrete samples are then prepared to match specified characteristics. Subsequently, fresh concrete samples undergo testing using water collected from the four different sample areas chosen along the course of the river.
Concrete cubes were cast to assess the impact of the water sample on the properties of compressive strength of the concrete. The curing process was monitored to evaluate its impact on concrete performance. A concrete specimen was cast using the four samples and labeled as P1, P2, P3, and P4. Cubical molds were cleaned and lubricated before casting to make it easier to remove the concrete specimens. Three layers of the concrete mixes were poured into the molds, and each layer was compressed using a steel tamping rod that measured 16 mm in diameter and 600 mm in length. Each layer was applied 25 times. The molds were then gently tapped with a hammer to seal any gaps that remained and expel any trapped air bubbles after the tamping process.
The same type of cement, aggregate, and sand was used for all samples. The mix ratio (cement, aggregate, sand, and water) was also consistent for all specimens. The concrete mix from the four water sampling points was compared to the reference concrete mix made from potable water, which served as a benchmark (control). A total of 45 cubes (15 x 15 x 15 cm) were cast (nine cubes for each sample, including the potable water source). The compressive strength of the cubes was tested on days 7, 14, and 28. Three cubes for each day and sample were taken for a compressive strength test, and the average of the test results was used to compare the samples. Throughout the period, the cubes were cured with the corresponding water source. The test results were evaluated against the permissible recommended standards to assess the level of contamination in determining for the intended purposes.
The maximum load sustained by the specimen was recorded to compute the compressive strength. The primary focus was on the compressive strength testing of these cubes, comparing those made with river water to those made with potable water. By analyzing the strength of the river-sourced samples against the control sample, the study aimed to determine the impact of the river water impact on concrete performance. The results from these tests indicates how variations in water quality affect the strength of concrete.
The variables are grouped into three: independent, dependent, and controlled variables. Independent variables are those variables that are not influenced by others; the properties of dependent variables, on the other hand, are influenced by other variables. Controlled variables are used as a benchmark to evaluate the properties of other variables. Water quality parameters collected from four different sites were taken as independent parameters; however, the compressive strength tested on the 7, 14, and 28 days was taken as a dependent variable, which mainly depends on the water quality. Controlled variables are those materials commonly used for sample preparation, such as sand, aggregate, and cement. In addition, potable water used to mix concrete is taken as a reference for controlled variables.
Water Quality Index (WQI)
The Water Quality Index (WQI) synthesizes complex scientific information on quality variables into a single dimensionless number. It is one of the most effective methods for describing water quality by normalizing values to subjective rating curves [20]. In this study, the Weighted Arithmetic Index method is used. The method is widely used [21]. The quality rating scale for each parameter is calculated by using Equation 1.
Where Qi is quality rating scale; Vn is the actual amount of the nth parameter; Vi is the ideal value of the parameter (Vi is equal to zero except for pH, which is seven and dissolved oxygen, DO, which is 14.6 mg/L); and Si is the recommended value (standard or permissible value). The relative weight (Wi) is calculated by using Equation 2; the value is inversely proportional to the recommended standard (Si ) value of the ith parameter
Where K is the proportionality constant and it is calculated by using the Equation 3.
The overall WQI is calculated by using Equation 4:
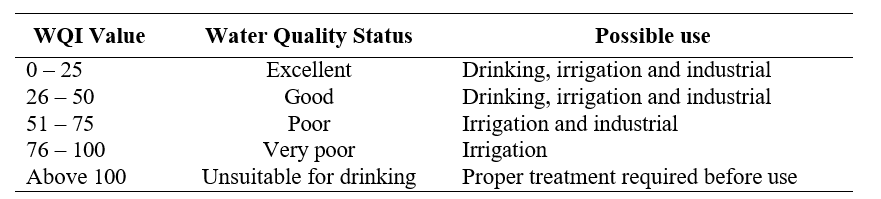
Table 2: Water Quality Rating as Per Weight Arithmetic Water Quality Index [22]
Results and Discussion
Water Quality
The analysis of water quality across the four rivers revealed that notable variations were influenced by environmental, geological, and human factors. Figure 2 shows the chemical water quality parameters determined in the samples. Sulphate levels showed that they were highest at Betel (P3) with 36.37 mg/L, while other samples ranged between 21.40 and 24.40 mg/L. The ACI recommends that the sulphate content should not exceed 1,000 mg/L. All the samples fall well within this permissible limit, thus minimizing the risk of sulphate attack, which can cause expansion and cracking in concrete. The maximum permissible concentration of nitrate for construction use is 400 mg/L [23]. Consequently, the nitrate concentration at Betel (P3) during the dry season was 58.4 mg/L, which was below the permissible limit and suitable for construction purposes. Other samples have nitrate levels between 8.30 and 24.87 mg/L. High nitrate levels can indicate pollution and may affect the setting time and strength of concrete.
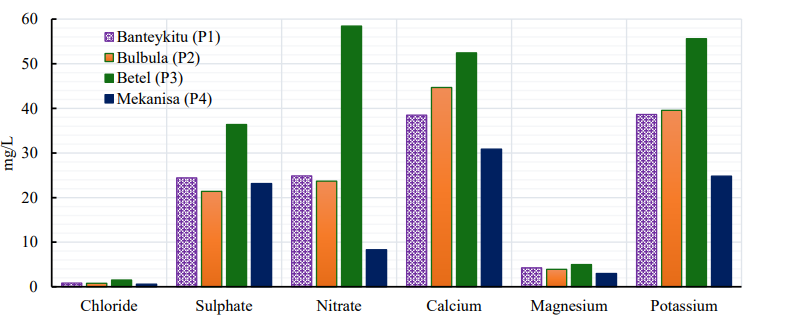
Figure 2: Average Concentration Level at Sampling Points
Calcium content is highest at Betel (P3) with 52.44 mg/L, indicating the hardness of water. Other samples ranged from 30.87 to 44.67 mg/L. Calcium levels in mixing water do not have a strict permissible limit but can contribute to the overall hardness of water, which can influence the concrete setting process. Higher calcium levels can benefit the concrete by contributing to strength development. Magnesium levels are fairly low, with Betel (P3) having the highest at 4.99 mg/L. The permissible limit for magnesium in mixing water is generally less than 50 mg/L. All sampling points fall well within this limit. High magnesium content can contribute to scaling and deterioration of concrete, but the levels are in the safe limit. Moreover, the potassium levels are highest at Betel (P3) with 55.63 mg/L. Potassium does not have a significant impact on concrete properties, and there are no specific permissible limits for potassium content in mixing water.
It indicated that chlorine and magnesium concentrations were almost the same at all sampling points. In contrast, nitrate and potassium concentrations were varied. It is evident that the source of nitrate is the nitrogen fertilizers, as well as municipal & industrial wastewater. Upstream agricultural activities and direct disposal of wastewater into rivers are likely sources of pollutants. The results showed that the sample collected from Betel (P3) had a high concentration of all pollutants, while Mekanisa (P4) exhibited a comparatively low level of contaminants. Although Betel (P3) is located upstream of Mekanisa (P4), the main reason for the low concentration at P4 was probably the dilution effects of other rivers. It implied that other rivers flowing into Mekanisa (P4) had lower concentration levels than Betel (P3). These findings highlight the dynamic interplay between natural and anthropogenic factors affecting water quality. They underscore the importance of tailored interventions to manage pollution and explore sustainable uses of river water.
As shown in Figure 3, the pH level for Bulbula (P2) was quite close to seven. The pH levels in all samples fell within the acceptable range according to Lea. The test result of pH in the four locations indicated its values ranging from 6.72 to 7.24, which indicates a slightly acidic to slightly basic. pH levels and acidity are shaped by urban runoff, industrial effluents, and agricultural activities, with Bulbula (P2) and Mekanisa (P4) exhibiting relatively higher acidity due to urban pollution, while Banteykitu (P1) maintains more neutral conditions. As per the ACI 318-19 guidelines, the ideal pH range for mixing water is between 6.0 and 8.0. All four sampling points fall within this permissible range, making them suitable for concrete mixing. However, it is evident that pH levels increase from upstream to downstream. An increase in water pH occurs when hydroxide ions (OH-) are more concentrated than hydrogen ions (H+), usually due to minerals such as calcium and magnesium. Magnesium levels were not significant at the sampling points, and calcium concentration was assumed to be the primary cause. Calcium may be due to the interaction between groundwater and surface water.
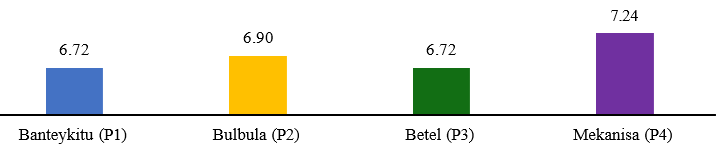
Figure 3: pH Values at the Sample Locations
Acidity levels vary significantly, with Betel (P3) having the highest acidity at 4.00 mg/L and Mekanisa (P4) the lowest at 0.40 mg/L (Figure 4). High acidity can affect the durability of concrete.
The permissible limit for acidity in mixing water is generally less than 1.00 mg/L. Betel (P3) exceeds this limit, which could potentially lead to problems such as decreased concrete strength and durability. The test results of acidity revealed that samples collected from Bulbula (P2) and Mekanisa (P4) can be used for concrete work. Alkalinity levels are relatively consistent, ranging from 8.00 to 8.80 mg/L. Alkalinity helps in neutralizing acidity and provides a buffer capacity. The permissible limit for alkalinity is not strictly defined but should be sufficient to counterbalance the acidity according to general guidelines of ACI 318-19. Other samples fall within a safe range that can effectively neutralize their respective acidity levels.
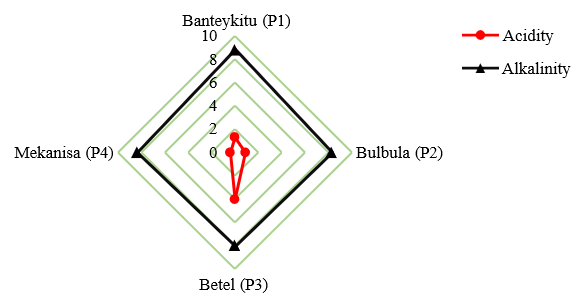
Figure 4: Acidity and Alkalinity Levels
The sample taken at Betel (P3) has the greatest chloride level, 1.50 mg/L, whereas values are low at all other locations. For reinforced concrete, the ACI states that the chloride content should be less than 500 mg/L. All sampling points are well within this limit, making them safe in terms of chloride content. High chloride content can lead to corrosion of reinforcement in concrete, but the levels are negligible.
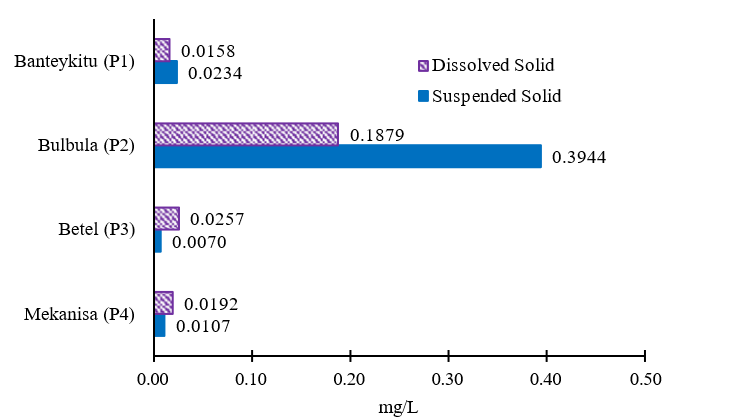
Figure 5: Dissolved and Suspended Solids, in mg/L
The solids shown in Figure 5 showed that Bulbula (P2) had comparatively higher values. Suspended solids were higher than dissolved solids in Banteyketu (P1) and Bulbula (P2), and vice versa for Betel (P3) and Mekanisa (P4). The total solid concentrations indicated that all four locations are significantly below the permissible limit of 50 g/L. The test results indicated that the total solid content in the samples were low and cannot affect the concrete's quality. In comparing the different sampling points, Mekanisa (P4) stands out with the lowest total solid concentration. Its inorganic and organic solid concentrations are also very low, enhancing its suitability for concrete mixing. Bulbula (P2), despite having a slightly higher inorganic solid concentration than the other sources, is still well within the permissible limit for concrete mixing water. According to Mandar & Deshmukh [23], the acceptable values for organic and inorganic solids in water for construction purposes are 200 mg/L and 3000 mg/L, respectively. Furthermore, the WQI analysis for P1, P2, P3 and P4 sample sites resulted in values of 41.1, 15.5, 41.6, and 18, respectively. Bulbula (P2) and Mekanisa (P4) achieved values below 20, thus, being excellent (safe for all construction since it meets drinking water quality). Banteyketu (P1) and Betel (P3), on the other hand, achieved values just above 40, thus being classified as good (acceptable for general use). The results demonstrated that water from these sources can be effectively used for concrete mixing without compromising concrete quality. All samples from various locations in Addis Ababa rivers met the concrete mix requirements of ASTM C1602/C1602M standards. However, careful follow- up is required, and blending with other better sources is being considered to achieve higher concrete quality.
Compressive Strength
As shown in Figure 6, the highest compressive strength recorded on days 7, 14 and 28 was 11.89, 14.97 and 18.17 MPa, respectively, and was achieved using Bulbula (P2) specimen. While on days 7 and 28, the compressive strength of concrete using the Mekanisa (P4) sample shows the lowest values. On the 7 day, the control sample (potable water) exhibited a compressive strength of 11.40 MPa. The sample from Banteyketu (P1) also showed a compressive strength of 11.40 MPa, similar to the control. The Bulbula (P2) sample had a slightly higher compressive strength (11.89 MPa), suggesting better early strength development. The Betel (P3) sample showed a compressive strength of 11.61 MPa, which is marginally higher than the control. Whereas, Mekanisa (P4) demonstrated a lower compressive strength of 11.01 MPa compared to the control. In the case of Mekanisa (P4), the pH value of sample water is slightly above seven.
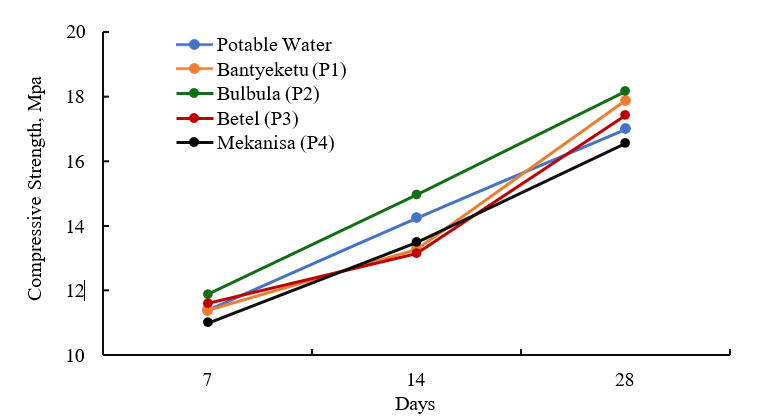
Figure 6: Compressive Strength Values on days 7, 14 and 28
The average compressive strength on day 7 using potable water was 11.40 MPa, while the minimum value of the different samples was 11.01 MPa (about 96% of potable water). According to Kucche et al. [24] above 90% the mean strength of the control sample is acceptable. This indicates that all samples meet the minimum requirements and can be used for concrete mixes. According to the standards, concrete should achieve approximately 70% of its 28th day strength by the 7th day. Given the target 28th day strength of 17.00 MPa, the expected strength on the 7th day should be around 11.90 MPa. The Bulbula and Betel samples met this benchmark more closely, indicating their potential for acceptable early strength development. On the 14th day, the control sample's compressive strength increased to 14.25 MPa. The Banteyketu (P1) showed a slightly lower strength of 13.28 MPa.
In contrast, the Bulbula (P2) demonstrated a strength of 14.97 MPa, surpassing the control sample. The Betel (P3) had a compressive strength of 13.16 MPa, slightly less than the control. The Mekanisa (P4) showed a compressive strength of 13.50 MPa. In general, on days 14 concrete is expected to achieve around 90% of the corresponding 28th day strength. This translates to an expected strength of about 15.30 MPa. The Bulbula (P2) sample’s performance was notable as it exceeded the control strength and approached the target 14th day strength, indicating a good rate of strength gain. Although the Banteyketu, Betel, and Mekanisa samples were below the expected 90% target, their results still indicate satisfactory progress in strength development.
On the 28th days, the control sample reached the target strength of 17.00 MPa. The Banteyketu (P1) exceeded this with a strength of 17.88 MPa. The Bulbula (P2) showed the highest compressive strength at 18.17 MPa. The Betel (P3) also performed well, achieving a strength of 17.44 MPa. The Mekanisa (P4) demonstrated a slightly lower strength of 16.57 MPa. The 28th day compressive strength is a critical indicator of the long-term performance and durability of concrete. According to the ACI and BS standards, the concrete samples from Banteyketu, Bulbula, and Betel not only met but also exceeded the control sample’s strength, indicating that river water from these locations can use for concrete mixing and curing.
The differences between the highest and the lowest compressive strengths computed for the specimens on days 7, 14 and 28 were 0.88, 1.81 and 1.60 MPa, respectively. The finding was compared with the result of Ojo [25], who analyzed the compressive strength of concrete cubes manufactured using water samples from boreholes, rain, rivers, wastewater, and well water. The values achieved on days 7, 14 and 28 were 14.13, 16.93 and 22.27 MPa, respectively, using the rainwater sample. The optimal compressive strength for C-20 concrete on day 28 is approximately 20 MPa. The result obtained in this study is close to the optimal value.
Conclusion and Recommendations
The research investigates the chemical and physical properties of river water in Addis Ababa and its effects on the compressive strength of concrete. Chemical analysis revealed a nitrate concentration in the Betel River was 58.4 mg/L, while the threshold is up to 400 mg/L, well below the permissible limit. Furthermore, compressive strength tests of the concrete revealed that water from the Bulbula (P2) had the highest strength values: 11.89 MPa (7 days), 14.97 MPa (14 days), and 18.17 MPa (28 days). The difference between the highest and lowest compressive strengths of all samples was 0.88 MPa (7 days), 1.81 MPa (14 days), and 1.60 MPa (28 days). Although the results showed varying levels of contamination in the river water, each sample produced concrete with sufficient strength. This means that Addis Ababa’s river water can, in principle, be used for mixing concrete without significantly compromising its strength..
The study confirmed that river water in Addis Ababa can be a viable option for concrete mixing with appropriate quality control measures. Although each river sample met the minimum standards, variations in contamination levels were noted. The Betel (P3) had higher nitrate and acidity levels, requiring caution, while the Bulbula (P2) yielded the highest concrete strength. The concentration of calcium and potassium is also significant; possible causes include agricultural activities and the discharge of wastewater into the river system. The findings highlighted the importance of sustainable water resource management in urban development and emphasized the need for continuous monitoring and interventions.
The study also found that certain river water samples produced concrete with strengths close to that of potable water. However, the presence of contaminants in the river water may slightly affect concrete performance over time, necessitating continuous monitoring. These findings highlighted the importance of monitoring and, where appropriate testing river water before its use in concrete production, especially in large-scale construction projects where long-term durability is critical.
In times of water scarcity, water allocation is mandatory. Exploring alternative sources to meet the needs of the construction industry facilitates the sustainable use of resources. However, it is essential to conduct quality testing according to minimum standards before any use. Quality management is an ongoing process, as parameters will change over time. River water must be tested for pH changes, nitrates, and other contaminants that could affect concrete performance. Even if the current water quality meets permissible standards, caution is still needed. Interventions such as blending with potable water can improve optimal concrete’s strength and reduce dependence on domestic supplies. Furthermore, policies and guidelines for the use of alternative water sources must be established to ensure compliance with ASTM and ACI guidelines. Stakeholders in the construction sector should also be encouraged to implement sustainable water management strategies to minimize environmental impacts and enhance resource recovery.
References
- Salehi, M. (2022). Global water shortage and potable water safety; Today’s concern and tomorrow’s crisis. Environment International, 158, 106936.
- Zablon Adane, E. S. (2021). World Resources Institute.
- Woldemariam, B. H. (2009). Water resource management in Ethiopia: the case of Addis Ababa (Doctoral dissertation, University of KwaZulu-Natal, Pietermaritzburg).
- Adugna, A. (2019). Ethiopia 2050: Population Growth and Development. In the Ethiopia: 2050 Conference, Skylight Hotel, Addis Ababa, December 19 and 20. Posted. Paper.
- Weldeghebrael, E. H. (2021). Addis Ababa: city scoping study. African Cities Research Consortium, The University of Manchester: Manchester, UK.
- Tefera, G. W., Dile, Y. T., Srinivasan, R., Baker, T., & Ray, R.L. (2023). Hydrological modeling and scenario analysis for water supply and water demand assessment of Addis Ababa city, Ethiopia. Journal of Hydrology: Regional Studies, 46, 101341.
- Alemu, Z. A., & Dioha, M. O. (2020). Modelling scenarios for sustainable water supply and demand in Addis Ababa city, Ethiopia. Environmental Systems Research, 9(1), 7.
- Assefa T, Moreda F (2023). Addis Ababa’s Chronic Urban Water Supply: The Ticking Time Bomb.
- Heravi, G., & Abdolvand, M. M. (2019). Assessment of water consumption during production of material and construction phases of residential building projects. Sustainable Cities and Society, 51, 101785.
- Bardhan, S. (2011). Assessment of water resource consumption in building construction in India. WIT Trans. Ecol. Environ, 144(2011), 93-101.
- Mohamed Rameez, Fathima Taskeen, Indrapriya (2022). Factors Affecting Water Consumption in the Construction Process in Tamilnadu. International Research Journal of Modernization in Engineering Technology and Science 4(6): 5167-5177
- Hewlett, P., & Liska, M. (Eds.). (2019). Lea's chemistry of cement and concrete. Butterworth-Heinemann.
- Neville, A. M. (1973). Properties of concrete [by] AM Neville. Wiley.
- Mehta, P. K., & Monteiro, P. J. (2006). Concrete microstructure,properties, and materials. McGraw-hill.
- Alhozaimy, A. M., Soroushian, P., & Mirza, F. (1996). Mechanical properties of polypropylene fiber reinforced concrete and the effects of pozzolanic materials. Cement and Concrete Composites, 18(2), 85-92.
- Krishna, R. S., Khan, H. A., Vamsi, R., & Sameer, S. K. (2023, December). Utilization of Treated Wastewater in Concrete. In IOP Conference Series: Earth and Environmental Science (Vol. 1280, No. 1, p. 012016). IOP Publishing.
- Mohe, N. S., Shewalul, Y. W., & Agon, E. C. (2022). Experimental investigation on mechanical properties of concrete using different sources of water for mixing and curing concrete. Case Studies in Construction Materials, 16, e00959.
- Mathur, A., & Chhipa, R. C. (2023). Statistical analysis of the effect of different water for mixing and curing on the mechanical properties of M-sand concrete. International Journal of Advanced Technology and Engineering Exploration, 10(99), 187.
- Haileslassie, A., Tesema, E., Mersha, M., Bekele, T. W., Desalegne, M., & Haile, A. T. (2024). Diversity and trade- offs of water values in the Akaki River system in Ethiopia: context of urban–rural linkage. Sustainable Water Resources Management, 10(2), 101.
- Tyagi, S., Sharma, B., Singh, P., & Dobhal, R. (2013). Water quality assessment in terms of water quality index. American Journal of water resources, 1(3), 34-38.
- Hyarat, T., & Al Kuisi, M. (2021). Comparison between weighted arithmetic and Canadian council of ministers of the environment water quality indices performance in Amman-Zarqa Area, Jordan. Jordan Journal of Earth and Environmental Sciences, 12(4), 295-305.
- Marouf, A. A., Ameen, H. A., & Qasim, M. J. (2025). Water quality index utilization for groundwater quality assessment for wells in Zakho District, Kurdistan Region-Iraq. Water Science, 39(1), 325-335.
- Joshi, M., & Deshmukh, S. K. (2019). Quality of water for construction-effects and limits. J. Emerg. Technol. Innov. Res., 6(4), 215-217.
- Kucche, K. J., Jamkar, S. S., & Sadgir, P. A. (2015). Quality of water for making concrete: a review of literature. International Journal of Scientific and Research Publications, 5(1), 1-10.
- Ojo, O. M. (2019). Effect of water quality on compressive strength of concrete. European Scientific Journal, 15(12), 172.