
Petroleum and Chemical Industry International(PCII)
ISSN: 2639-7536 | DOI: 10.33140/PCII
Impact Factor: 0.719

Research Article - (2025) Volume 8, Issue 2
Simulation Study of Underground LPG Storage in a Depleted Conceptual Oil Reservoir
2Universidade Estadual de Campinas Instituto de Geociencias, Campinas, State Of Sao Paulo, Brazil
3School of Geology and Mining Engineering, Universityof Ngaoundere, P.O. Box 115, Meiganga, Cameroon
Received Date: Feb 04, 2025 / Accepted Date: May 12, 2025 / Published Date: May 14, 2025
Copyright: ©Â©2025 Donald Kuiekem, et al. This is an open-access article distributed under the terms of the Creative Commons Attribution License, which permits unrestricted use, distribution, and reproduction in any medium, provided the original author and source are credited.
Citation: Kuiekem, D., Kingue, S. D. E., Boroh, W., Noupa, R. K., Matateyou, J., Ngounouno, I. (2025). Simulation Study of Underground LPG Storage in a Depleted Conceptual Oil Reservoir. Petro Chem Indus Intern, 8(2), 01-14.
Abstract
Energy storage gained vital resource in the highly competitive energy market. The study looked at storing liquefied petroleum gas (LPG), in depleted reservoirs that have run dry. A synthetic reservoir model was built. It featured constant porosity and an initial oil in place of 0.25858E+09 STB. Also, it had an initial gas in place of 0.32839E+12 SCF using a numerical simulator. Different scenarios were simulated to assess reservoir behavior in various circumstances. LPG injection and production scenar- ios varied widely during tests. Results showed the potential benefits of using depleted reservoirs for LPG storage. Challenges remained regarding long-term viability. The research highlighted both successes and failures in the approach taken to store LPG effectively. Further studies could explore alternative methods for energy storage. The findings indicated that utilizing depleted reservoirs for LPG could have lasting impacts on energy management strategies moving forward. The study results provided fresh perspectives on storing LPG in empty reservoirs. Also, LPG had a unique response to pressure. It became clear that mon- itoring reservoir pressure was vital for the fuel performance. Further, the established technology demonstrated potential for testing with other energy fluids. Natural gas and hydrogen were among those tested. This opened up substantial and ecologically possibilities for energy storage
Keywords
Energy Storage, Liquefied Petroleum Gas (LPG), Depleted Reservoirs, Reservoir Pressure Monitoring, Numerical Simulation
Introduction
Energy storage has assumed a critical significance within contemporary energy systems. It served to alleviate interruptions in supply. Such interruptions originated from a variety of sources. One contributing factor was the limited capacity for production. Additionally, disruptions in transportation emerged as a concern. Constraints imposed on refining processes further compounded the difficulties faced. Through the establishment of a strategic reserve of energy resources, nations were able to safeguard their local requirements. This strategy also contributed to the enhancement of energy sovereignty [1]. Storage solutions were necessary throughout the petroleum value chain. They existed at different value chain. Crude oil storage was essential first. Then there were intermediate products that needed storing too. Finally, finished fuels required effective storage before ultimate consumption. In summary, effective energy storage systems ensured stability in an unpredictable environment while supporting national autonomy in energy matters [2]. Tanks are prevalent in the petroleum sector. Spherical and cylindrical configurations represent the most extensively utilized forms. For liquefied petroleum gas, two primary alternatives are available. Cylindrical and spherical structures function as repositories. Liquefied petroleum gas (LPG) is characterized as the lightest (possessing the lowest density) liquid fuel generated within a refinery. Its density is comparatively lower than that of alternate fuels. The management of this supply is imperative for economic stability. The methodologies for storage are contingent upon the modalities of storage and transportation. Subterranean storage presents numerous advantages. It appeared to be a feasible substitute for conventional methodologies. This category of storage utilized underground spaces for diverse purposes. It contributed to the conservation of surface land. Furthermore, it afforded protection against climatic conditions and various hazards. The notion gained prominence in the latter part of the 20th century. There was a growing emphasis on more efficient methods for resource storage. Traditional storage frequently encountered constraints such as spatial and security challenges [3].
There are three main methods that hydrocarbons can be stored underground:
• Mined Tunnels: These are excavated using conventional mining techniques and are suitable for liquid or liquefiable products.
• Salt Cavern Storage: This method involves dissolving rock salt to create large cavities in salt deposits. It is suitable for all liquid, gaseous, and liquefied hydrocarbons.
• Aquifers and Depleted Fields: These natural formations can be repurposed for gas or oil storage, providing a cost-effective and environmentally friendly solution [4].
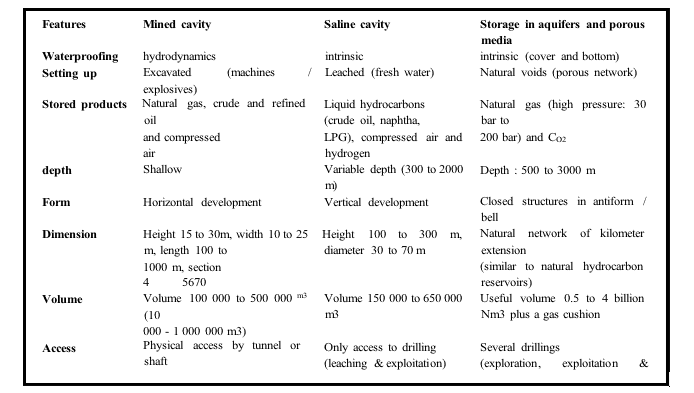
Table 1: Summarizes the Different Types of Underground Storage Media and Their Characteristics
Today, liquefied petroleum gas (LPG) is extensively employed by both industrial operators and private individuals in their mobile endeavors. When combined, LPG can also function as a fuel source for vehicles (LPG-c).The primary constituents of LPG, propane and butane, exist in a gaseous state at standard atmospheric pressure (1 bar) and ambient temperature (15°C). Nevertheless, these substances can be readily converted into liquid form, facilitating efficient handling, transportation, and storage in compact volumes:
• One liter of liquid butane yields 239 liters of gas (at 15°C under 1 bar of pressure).
• Conversely, one liter of liquid propane generates 311 liters of gas (at 15°C under 1 bar of pressure).
Propane and butane exhibit variations in the temperature and pressure conditions required for their transition from gaseous to liquid states. Under standard atmospheric pressure (1 bar):
• Propane transitions to liquid state when the temperature decreases below -42°C, while butane liquefies when the temperature falls below 0°C.
• LPG fuel, comprising a mixture of propane and butane, possesses a distinct liquefaction temperature compared to its individual constituents, transitioning to liquid at - 25°C under atmospheric pressure.
In contrast, methane (CH4), the predominant component of natural gas, requires either elevated pressure (47 bar at - 82°C) or extremely low temperature (1 bar at -161°C) to achieve liquefaction. The critical point of a pure substance is defined as the location on the temperature-pressure diagram where the liquid-gas equilibrium curve terminates [5]. The critical temperature (TC) and critical pressure (PC) represent the specific temperature and pressure at which a substance transitions. The molar volume and density corresponding to these parameters are referred to as the critical volume and critical density, respectively. When the temperature and pressure exceed the critical values, no phase transition between liquid and gas occurs, and the substance is classified as supercritical. Supercritical fluids display distinctive properties, amalgamating traits of both liquids and gases, thereby rendering them advantageous for a myriad of industrial applications [6].
Materials and Methods
Model Design
To construct the reservoir model, we utilized the CMG software, specifically the Builder and Imex interfaces. To simplify the model, several assumptions were made:
• Temperature Effects: The influence of temperature on reservoir properties was neglected.
• Rock Compressibility: Rock compressibility was assumed to be constant.
• Injection and Production Operational and Monitoring Variables: they were set at their maximum and minimum allowable.
• Simulation Time step: was defined as annual.
• Water Salinity: Injected water was assumed to be non- saline.
• Gas Composition: The gas that was injected consisted of 12% ethane, 38% propane, and 50% butane.
A non-sealing fault that crosses the model was incorporated into a three-layered synthetic Cartesian grid that was constructed for the case study. The directional permeabilities in the model are varied, but the porosity was fixed as a constant at 30%. A five-spot well layout that was inverted was used in the first production plan. It is possible that the well types will need to be modified in order to achieve the remaining production, injection, and LPG storage milestones. A black oil model, which uses partial differential equations to explain fluid flow behavior, was used to simulate fluid flow. The following are the equations for the extended black oil model [7].
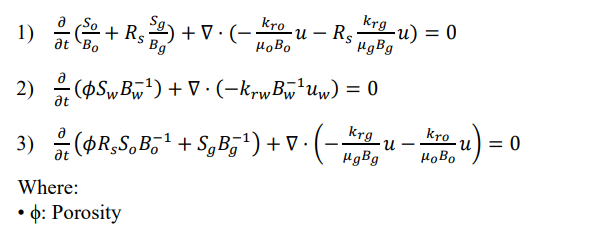
• Sw: Water saturation
• So: Liquid phase saturation
• Sg: Vapor phase saturation
• Bo: Formation oil volume factor
• Bw: Formation water volume factor
• Bg: Formation gas volume factor
• Rs: Ratio of gas solution in oil phase
• Rv: Ratio of vaporized oil in gas phase

Figure 1: Typical Phase Diagram of Black Oil
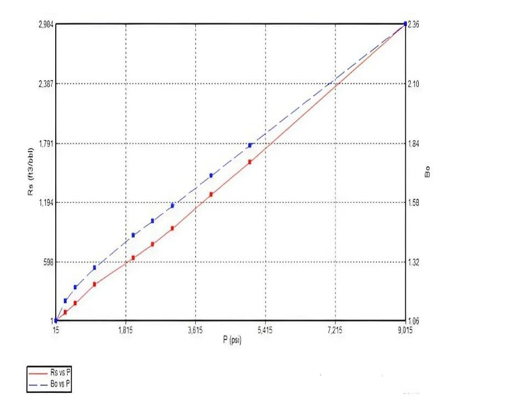
Figure 2: Relationship between Solution Gas Ratio, Formation Oil Volume Factor and Pressure
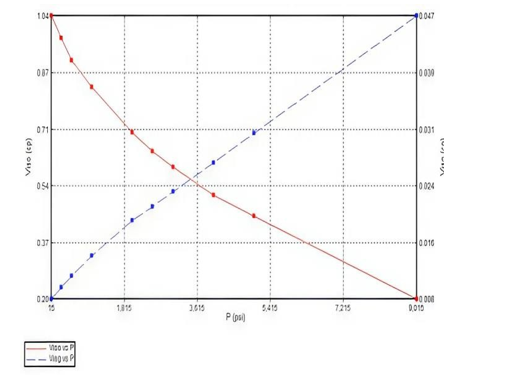
Figure 3: Relationship Between Oil and Gas Viscosity as Function of Pressure
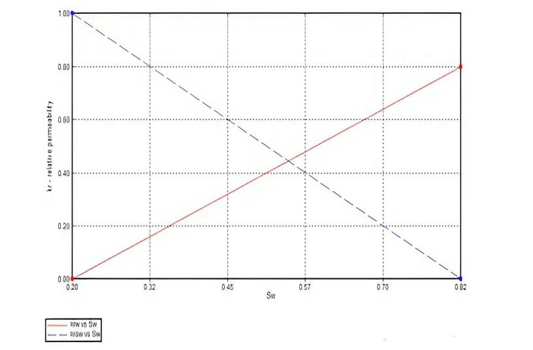
Figure 4: Relationship Between Relative Oil and Water Permeability as Function of Water Saturation
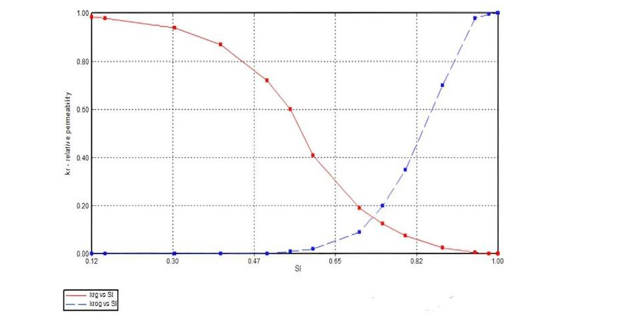
Figure 5: Relationship Between Relative Permeability of Oil and Gas as Function of Liquid Saturation
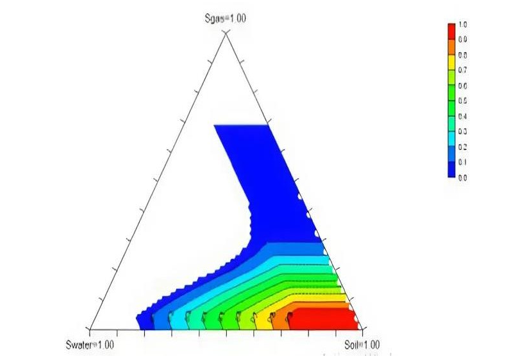
Figure 6: Ternary Plot of Water, Oil and Gas Saturation
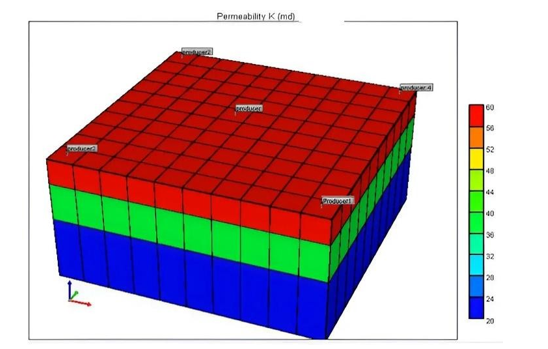
Figure 7: Distribution of Vertical Permeability
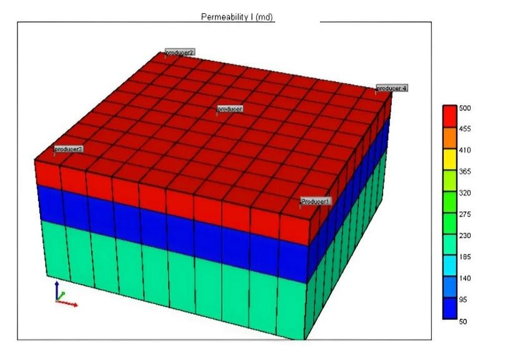
Figure 8: Distribution of Horizontal Permeability

Figure 9: Declination Curves According to the Drive Mechanism
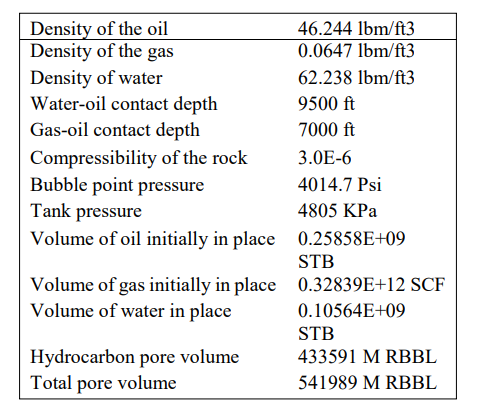
Table 2: Reservoir Parameters
Primary and secondary recovery operations were simulated on 14 years. Initially, the reservoir contained no free gas due to its pressure being above bubble point pressure.
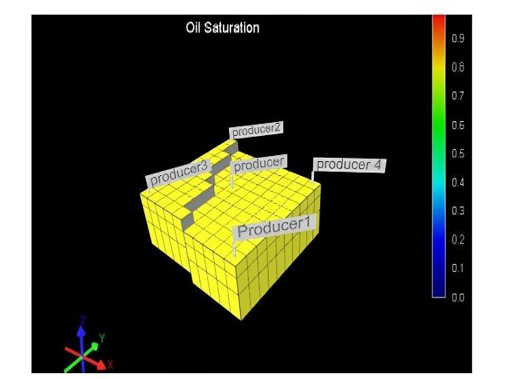
Figure 10: Initial Oil Saturation

Figure 11: Initial Gas Saturation
Gas Injection, Storage, and Production
A 40–70% recovery was anticipated after secondary recovery, enabling LPG infusion. The volume needed to sustain reservoir pressure is known as the base gas, which is made up of both injected and native gas. The amount injected and withdrawn during typical storage cycles is known as the working gas, which makes up 70% of the total gas [8]. The gas-water front shifts as a result of edge water being displaced by the creation of a gas bubble. The Buckley-Leverette theory explains this displacement mechanism. Three stages are involved in the creation of gas bubbles, as Figure 12 shows.

Figure 12: Formation of a Gas Bubble; De Muller-Kirschbauer; [18]; Chapter 6; Slide 42
|
Stage |
Duration |
Operations |
|
Stage1 |
10 years |
Gas injection through the corner |
|
|
|
wells (wl1, wl2, wl3 and wl4) |
|
Stage2 |
5 years |
Monitoring of the reservoir |
|
Stage3 |
5years |
Production from the central well |
|
Stage 4 |
10 years |
Periodic production of the central |
|
|
|
well (50%) |
|
Stage 5 |
5 years |
Injection of gas from wells 1,3 and |
|
|
|
4 and production from central well |
|
Stage 6 |
1 year |
Production from the central well |
|
Stage7 |
4 years |
Production and periodic injection |
|
|
|
from the central well |
|
Stage 8 |
2 years |
Central production |
|
Stage 9 |
3 years |
Rest |
|
Stage |
5 years |
Gas injection by the 4 wells |
|
10 |
|
|
|
Stage |
3 years |
Production by the 4 wells |
|
11 |
|
|
Table 3: Schedule of Injections, Rest and Production Operations
Results & Discussion
Primary Recovery
The reservoir produced a total of 28,871 MSTB of oil, 264,779 MMSCF of gas, and 35,336 MSTB of water during the natural depletion period. As a consequence, the reservoir contained 229,684 MSTB of oil, 63,473 MMSCF of gas, and 105,603 MSTB of water. With 12% oil and 80% gas, the hydrocarbon recovery percentage was 46%. During production, the reservoir pressure dropped dramatically and got close to the bubble pressure. In the reservoir, gas saturation rose noticeably [9].
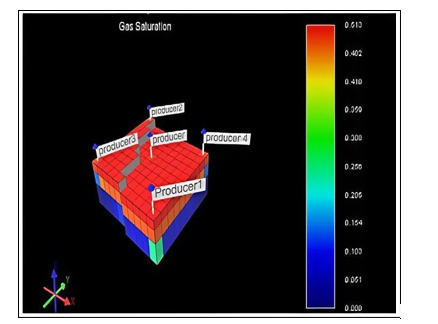
Figure 13: Distribution at the end of the Primary Recovery of Gas Saturation
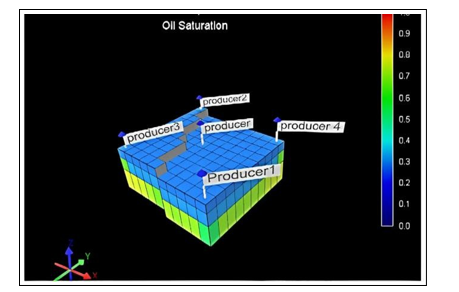
Figure 14: Oil saturation at the end of Primary Recovery
Secondary Recovery
After primary recovery, 54% of hydrocarbons remained in the reservoir. Water injection through wells wl3 and wl4 was implemented to sweep remaining oil towards the producer. Water injection led to a rapid decrease in gas saturation. Over five years, 3,090 MMSTB of water was injected, resulting in a total hydrocarbon recovery of 64%, an 18% improvement over primary recovery (41% oil and 81% gas) [10].
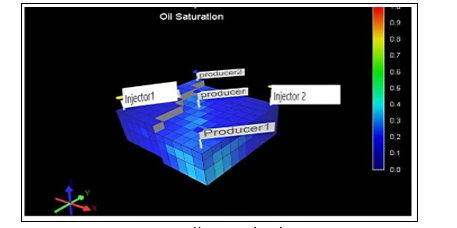
Figure 15: Oil Sweeping by Water
Gas Injection, Storage, and Production
Over 64% of the hydrocarbon reserves in the reservoir were produced, an estimated 108.6 MMSTB of oil and 286,288 MMSCF of gas were extracted. In all, 2,708 MMSTB and 3,092 MMSTB of water were generated and injected. At standard pressure settings, this implies a 284,593 MMSCF storage potential. Considering the compressibility characteristics of the gas alongside the elastic properties of the reservoir, an increased volume of gas may be introduced. The occurrence of fractures in the cap rock may arise from elevated pressure within the reservoir, which could subsequently threaten the overall stability of the reservoir [11].
Gas Injection (4 wells)
After water injection, an increase in reservoir pressure was observed. The pressure distribution differed from water injection due to the diagonal well placed. Water injection resulted in a pressure increase from injectors towards the center, reflecting water mobility. Gas injection through four wells led to a more homogeneous pressure distribution. Gas saturation remained relatively unchanged, suggesting two possibilities:
• Injected gas dissolved in residual oil.
• LPG remained in the liquid phase, treated as oil by the simulator.

Figure 16: Oil Saturation After Injection
Rest and Observation
During the resting period, pressure, bubble pressure, and gas saturation remained stable. However, a slight increase in oil saturation was observed, possibly due to gas dissolution into the oil phase. To release dissolved gas, reservoir depressurization would be necessary to reduce bubble pressure [12].

Figure 17: Bubble Pressure Distribution After Gas Injection
Production by the Central Well
To depressurize the reservoir, the central well was opened, leading to oil migration towards the depressurization zone. This reduced bubble pressure in oil-saturated zones and resulted in a significant release of dissolved gas.

Figure 18: Oil Saturation
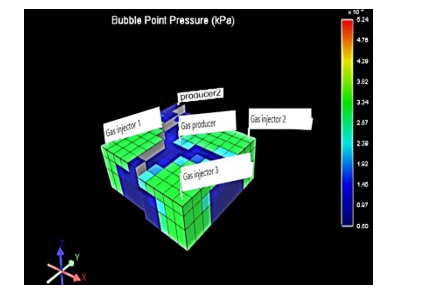
Figure 19: Bubble Pressure
Periodic Production of the Central Well (50%)
To maintain gas release, the central well was kept open 50% of the time. This led to a decrease in oil saturation and an expansion of free gas in the upper reservoir layers.
Production by Central Well
Bubble pressure decreased, leading to gas release and improved gas saturation.
Production and Periodic Injection from Central Well
Periodic injection and production resulted in increased gas saturation and significant gas expansion at the surface. Oil accumulated in the lower layers, particularly near the central well.

Figure 20: Gas Saturation in 2040
Central Production and Rest
Reservoir pressure decreased due to central well production. The resting phase aimed to assess gas expansion slowing. However, oil migrated from lower layers to the surface, changing phase.
Gas Injection by the 4 Wells
A second injection phase was conducted to evaluate gas dissolution and free gas behavior. Injection increased reservoir pressure, facilitating gas dissolution and limiting free gas expansion. Bubble pressure increased significantly in the upper layers

Figure 21: Distribution of Bubble Pressure in 2050
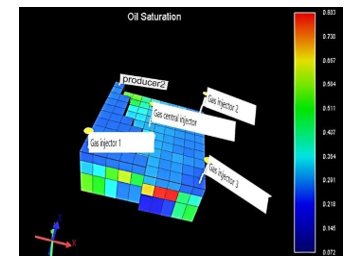
Figure 22: Oil Saturation in end Stage
Production by the 4 Wells
Oil reserves that were kept close to the injectors were produced as a result of simultaneous production from all operating wells. Gas saturation was rising as oil collected close to producer 2. Reservoir pressure and bubble pressure both decrease significantly [13].
In order to ascertain which theory about gas dissolution was right, Figures 23 and 24 were examined.

Figure 23: Gas Production From Wells
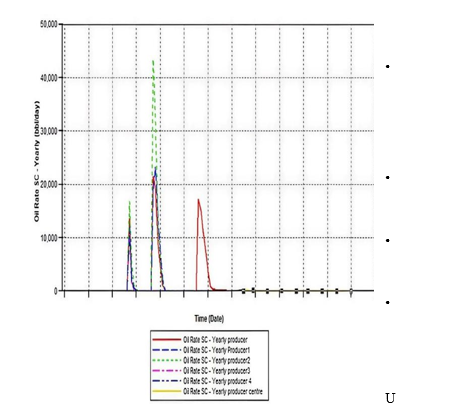
Figure 24: Oil Production From Wells
The simulator’s treatment of LPG as oil indicates that it remained in the liquid phase underground, as indicated by the model’s increasing gas saturation and the notable drop in gas production. The LPG gas phase, which can be viewed as losses because of its growth restricting storage capacity, is represented by the measured gas saturation [14].
Conclusion
The approach established in this work examined the effectiveness of LPG storage in depleted petroleum deposits and examined the fundamental mechanisms controlling gas flow and storage. Gas production and storage were conducted after primary and secondary recovery procedures to ascertain the best storage conditions. The following are the main conclusions of this work:
• Liquid Phase Storage: Until the LPG bubble point pressure is not achieved, LPG stays in the liquid phase in the reservoir. For LPG storage to be successful, reservoir pressure monitoring is therefore essential for controlling the LPG phase [15].
• Multi-Phase Production: Light oil, water, and gas make up the mixture that is created [16].
• Production Difficulties: Production abandonment may result from damage to reservoir structures, excessive water production, and pressure decline [15].
• Pre-Injection Studies: Laboratory experiments should be run to evaluate rock-fluid interactions between the reservoir, formation fluids and injected fluid. This could help to predict for instance miscibility occurrences and capillary changes after LPG injection [17].
• Versatility: Underground reservoirs could be used to store different kinds of gas [18].
• Long-Term Planning: Successful implementation requires extensive reservoir studies and planning to establish optimal production and injection scenarios.
• Well Configuration: Multiple injectors per producer can maintain pressure balance, promote fluid migration, and limit degassing. A control well and water injector should be maintained for reservoir purging [19].
Underground storage in porous media offers substantial potential for repurposing abandoned oil formations into storage facilities for natural gas, liquefied petroleum gas, carbon dioxide (COâ??), or methane. These formations vast storage capacity and resistance to mechanical deformation have contributed to their widespread adoption [20-44].
References
- Aina, O. (2024). Energy storage systems technologies, evolution and applications. Energy and Power Engineering, 16(2), 97-119.
- Gao, Y. (2020). Petroleum-based storage device.
- Lerena, P., Auerkari, P., Knaust, C., Vela, I., & Krause, U. (2013). Approaches towards a generic methodology for storage of hazardous energy carriers and waste products. Journal of risk research, 16(3-4), 433-445.
- Malachowska, A., Lukasik, N., Mioduska, J., & Gebicki, J. (2022). Hydrogen storage in geological formations—The potential of salt caverns. Energies, 15(14), 5038.
- Higgs, S., Da Wang, Y., Sun, C., Ennis-King, J., Jackson, S. J., Armstrong, R. T., & Mostaghimi, P. (2023). Comparative analysis of hydrogen, methane and nitrogen relative permeability: Implications for Underground Hydrogen Storage. Journal of Energy Storage, 73, 108827.
- Singh, J. (2021). Supercritical fluids for inorganic nanomaterials synthesis. In Green Sustainable Process for Chemical and Environmental Engineering and Science (pp. 227-236). Elsevier.
- Lee, S. H., Wolfsteiner, C., & Tchelepi, H. A. (2006). Black oil formulation for the multi-scale finite-volume method. In In Proceedings of XVI International Conference on Computational Methods for Water Resources.
- Cho, J., Min, B., Jeong, M. S., Lee, Y. W., & Lee, K. S. (2021).Modeling of CO2-LPG WAG with asphaltene deposition to predict coupled enhanced oil recovery and storage performance. Scientific Reports, 11(1), 2082.
- Ahmed, T. (2010). Oil recovery mechanisms and the material balance equation reservoir engineering handbook. Gulf Prof Publ, 733-809.
- Martines, G., Prakoso, S., Fathaddin, M. T., Rakhmanto, P. A., Setiati, R., & Mardiana, D. A. (2022). Basic understanding of water flooding as a secondary recovery concept: Literature review. International Research Journal of Engineering, IT and Scientific Research, 8(6), 283-289.
- Matveev, S., Gazizov, A., Gazizov, A., Garipov, R., & Galaktionova, L. (2019, April). Increasing sweep efficiency by shutting off water flow through thief zones in a heterogeneous reservoir. In SPE Oil and Gas India Conference and Exhibition? (p. D031S020R002). SPE.
- Dong, Y., Liu, F., Zhang, Y., & Wu, Q. (2022). Prediction of Oil Saturation during Water and Gas Injection Using Controllable Convolutional Long Short-Term Memory. Energies, 15(14), 5063.
- Alabri, S., Ghafram, H., & AlKalbani, M. (2020, November). A Method to Correlate Interactions Between Injectors and Producers. In Abu Dhabi International Petroleum Exhibition and Conference (p. D011S002R002). SPE.
- Nielsen, M. H., Arekhov, V., Whitson, C. H., Clemens, T., Zhainakov, T., & Wegner, J. (2023, June). Fluid Modeling of Underground Hydrogen Storage in a Depleted Natural Gas Field. In SPE Europec featured at EAGE Conference and Exhibition? (p. D021S001R002). SPE.
- Ma, Q., Zhong, M., Guo, Y., You, J., He, Y., Chen, J., & Zhang,Z. (2022). Study on the characteristic of boiling expansion process of superheated LPG and its vapor cloud explosion. Journal of Loss Prevention in the Process Industries, 78, 104831.
- Alizadeh, A., Ghazanfari, M. H., Taghikhani, V., & Badakhshan, A. (2014). Experimental investigation of water alternating CH4-CO2 mixture gas injection in light oil reservoirs. International Journal of Oil, Gas and Coal Technology 74, 8(1), 31-40.
- Barton, N., & Quadros, E. (2019). Understanding the need for pre-injection from permeability measurements: what is the connection?. Journal of Rock Mechanics and Geotechnical Engineering, 11(3), 576-597.
- Tomanek, D. Hlincik, T. (2023). Storage of a mixture of natural gas and hydrogen in underground gas reservoirs. Paliva.
- Alizadeh, N., & Salek, B. (2021). Waterflood optimization using an injector producer pair recovery factor, a novel approach. Journal of Petroleum Exploration and Production, 11(2), 949-959.
- Kuiekem, D., Matateyou, J., Boroh, W., & Ngounouno, I. (2021). Simulation Of Underground Liqufied Petroleum Gas (LPG) Storage In A Depleted Field.
- Egermann, P., & Vizika, O. (2000, October). Critical gas saturation and relative permeability during depressurization in the far field and the near-wellbore region. In SPE Annual Technical Conference and Exhibition? (pp. SPE-63149). SPE.
- Mithani, A. H., Ranjan, R., Salleh, K. S., Lien Wee, H., & Md Zainuri, M. Z. (2022, April). Strategy Shifting in Reservoir Management Plan through Integrated Data Analysis for a Mature Reservoir Offshore Malaysia: Lessons Learnt and Pavement to the Best Practices. In Offshore Technology Conference (p. D031S035R007). OTC.
- Arlot, S., & Celisse, A. (2010). A survey of cross-validation procedures for model selection.
- U.S. EPA (2015) Supercritical Fluid Extraction of TotalRecoverable Hydrocarbons. U.S. EPA Method 3560
- Vérillon, F. (1998). Supercritical or not, pressurized fluids atPittcon'98. Analusis, 26(4), 81-83.
- Renaud, M. (2020). Petroleum - Storage. Universalis.
- Gaya, A. (2020). The underground storage of hydrocarbons: Situation in the world and opportunities for Tunisia. Leaders.
- Soubrance, Q. (2020). With the world economy in a state of collapse, we will soon no longer know where to store the oil that is flowing. BFM Business
- Mines Paris Tech (2015).
- CMG (Computer Modelling Group). (2020). General release.
- El-Hoshoudy, A., & Desouky, S. (2019). PVT Properties ofBlack Crude Oil. Processing of Heavy Crude Oils, 23.
- Jiménez Morales, S. (2012). Recuperación secundaria en campos de petróleo y su conversión en almacenamientos subterráneos de gas natural.
- Mokhatab, S., Poe, W. A., & Mak, J. Y. (2018). Handbook of natural gas transmission and processing: principles and practices. Gulf professional publishing.
- Khilyuk, L. F., Chilingar, G. V., Endres, B., & Robertson, J. (2000). Gas migration. Events preceding earthquakes, 390.
- Lacoste, A. C., & Bérest, P. (1981). Stockages souterrains d'hydrocarbures: sécurité et protection de l'environnement. Revue Française de Géotechnique, (14 bis), 61-68.
- Lallemand, D. A. (1975). Consulted.
- Öztürk, B. (2004). Simulation of depleted gas reservoir for underground gas storage (Master's thesis, Middle East Technical University (Turkey)).
- Roche, V. (2011). Architecture et croissance des failles dansles alternances argilo-calcaires: exemples dans les alternances du Bassin du Sud-Est (France) et modélisation numérique (Doctoral dissertation, Paris 6).
- Berest, P. (2018). Underground storage of gases and hydrocarbons: prospects for the energy transition. Encyclopédie de l’Environnement.
- Liang, G., & Zhang, B. (2011, October). The Dynamic Simulation of Underground Gas Storage by Computer. In 2011 International Conference on Computational and Information Sciences (pp. 538-541). IEEE.
- Stopa, J. (2012, June). Simulation and practice of the gas storage in low quality gas reservoir. In 25th world gas conference, Kuala Lumpur (pp. 4-8).
- Khamehchi, E., & Rashidi, F. (2006, May). Simulation of underground natural gas storage in Sarajeh Gas Field, Iran. In SPE Kingdom of Saudi Arabia Annual Technical Symposium and Exhibition (pp. SPE-106341). SPE.
- Sainz-Garcia, A. A. (2017). Dynamics of underground gas storage. Insights from numerical models for carbon dioxide and hydrogen (Doctoral dissertation, Université Toulouse 3 Paul Sabatier (UT3 Paul Sabatier)).
- Campbell, J. M. (2010). Petroleum Engineering Handbook (6th ed.). Society of Petroleum Engineers.