



Research Article - (2026) Volume 9, Issue 3
Quantitative Evaluation of Freezing of Gait in Parkinson’s Disease Using Smartwatch Telemetry
 and Kenichi Yamamura 1,2 *
 2Transgenic Group, Inc., Fukuoka, Japan
Received Date: Aug 05, 2026 / Accepted Date: Aug 31, 2026 / Published Date: Sep 10, 2026
Copyright: ©2026 Kenichi Yamamura, et al. This is an open-access article distributed under the terms of the Creative Commons Attribution License, which permits unrestricted use, distribution, and reproduction in any medium, provided the original author and source are credited.
Citation: Zhenghua, L., Yamamura, K. (2026). Quantitative Evaluation of Freezing of Gait in Parkinsonâs Disease Using Smartwatch Telemetry. Adv Neur Sci, 9(3), 01-09.
Abstract
Background: Freezing of Gait (FOG) and daily motor fluctuations severely impair independence in Parkinson’s disease (PD). Continuous monitoring via consumer smartwatches offers a non-invasive way to measure real-world Digital Mobility Outcomes (DMOs). However, FOG-induced standstill and environmental variations cause measurement biases that are poorly characterized.
Objective: To quantitatively evaluate Freezing of Gait (FOG) episodes in Parkinson’s disease using smartwatch telemetry, establish a simple and clinically intuitive Range Ratio metric (Mean ± Range Ratio %) to capture true day-to-day symptom variability without relying on standard deviation, assess FOG-induced GPS trajectory distance distortion, and investigate the potential moderating effects of ambient biometeorological factors (temperature and relative humidity) on gait motor performance.
Methods: Field gait trials were conducted along an outdoor circuit (Fukuoka Park) ranging from 240 m to 800 m comparing Control sessions (n=4) and Test sessions exhibiting FOG (n=15). High-frequency time-series sensor data were recorded using the WorkOutDoors application on an Apple Watch Ultra 2 and analyzed via HealthFit and custom Excel processing pipelines. Day-to-day symptom variability across the 15 Test sessions was expressed using the Range Ratio (Mean±Range Ratio %), defined as [(Max−Min)/Mean]×100.
Results: High-precision telemetry successfully extracted continuous spatiotemporal metrics. Test sessions exhibited significantly higher FOG Ratio (0.320 vs. 0.037, p = 2.26 × 10^-7) and massive GPS distance inflation (32.10% vs. 1.25%, p = 7.94 × 10^-8) compared to Controls. FOG Ratio showed strong inverse correlations with walking speed (r = -0.742) and step length (r = -0.685), confirming that spatial gait breakdown closely mirrors freezing severity. Across 15 test sessions, day-to-day symptom ranges expressed as Mean ± Range Ratio % were: FOG Ratio 0.32 ± 145.6%, Walking Speed 3.12 ± 55.8% km/h, Cadence 125.6 ± 39.9% spm, and Step Length 45.8 ± 27.1% cm. Ambient temperature showed no significant association with FOG Ratio (r = 0.188, p = 0.503) or GPS error (r = 0.284, p = 0.305). Conversely, relative humidity demonstrated a statistically significant inverse correlation with FOG Ratio (r = -0.594, p = 0.020) and GPS error ratio (r = -0.656, p = 0.008).
Conclusion: FOG Ratio derived from smartwatch telemetry is an exceptionally sensitive biomarker for capturing real- world day-to-day motor symptom swings (145.6% fluctuation). GPS distance inflation during FOG motor arrest (~32%) mandates the integration of inertial zero-velocity filters in DMO algorithms. Environmental humidity modulates freezing severity, presenting new biometeorological insights for PD motor management.
Keywords
Parkinson's Disease, Freezing of Gait (FOG), Wearable Telemetry, Range Ratio, Day-to-Day Variability, GPS Position Jitter, Digital Mobility Outcomes (DMOs), Biometeorology
Introduction
Parkinson’s disease (PD) is characterized by progressive motor dysfunction, among which Freezing of Gait (FOG) represents one of the most debilitating symptoms. FOG is clinically defined as a brief, episodic absence or marked reduction of forward progression of the feet despite the intention to walk. Because FOG occurs transiently and is often suppressed during clinical examinations, capturing its true severity and daily variability in free-living environments remains a major clinical challenge. Consumer smartwatches equipped with Global Positioning System (GPS) receivers and inertial sensors are increasingly used to monitor Digital Mobility Outcomes (DMOs). However, satellite positioning relies on continuous spatial sampling. When a patient experiences stationary motor arrest, namely FOG, satellite signal noise generates artificial spatial drift, known as "GPS jitter". Furthermore, patients experience substantial day-to-day symptom swings driven by medication On/Off states and environmental factors. Traditional dispersion metrics like standard deviation (SD) or coefficient of variation (CV) assume normal distributions and fail to communicate the actual physiological excursion range between a patient's best and worst days. This field study presents a comprehensive quantitative evaluation of Parkinsonian gait metrics using Apple Watch Ultra 2 telemetry across 15 structured outdoor sessions. Specifically, we structure our investigation along six sequential analytical steps corresponding to Figures 1 through 6:
• Establishing high-resolution telemetry data acquisition workflows (Figure 1).
• Quantifying FOG severity and FOG-induced GPS trajectory errors against Control subjects (Figure 2).
• Analyzing bivariate correlations between standard spatiotemporal gait parameters and FOG Ratio (Figure 3).
• Evaluating day-to-day symptom variability using a simple, uncorrupted Range Ratio (Mean ± Range Ratio %) without standard deviation (Figure 4).
• Investigating the impact of ambient temperature on gait freezing and GPS drift (Figure 5).
• Uncovering the moderating effect of relative humidity on motor symptoms and positioning accuracy (Figure 6).

High-precision outdoor gait telemetry framework using Apple Watch Ultra 2 and WorkOutDoors application. Real-time logging captures continuous spatial positioning, stride temporal parameters, and FOG episodes during outdoor walking trials. Zone A shows various measurement values. Zone B shows walking paths, with green and red indicating the relative speed of movement—green is fast, red is slow. Zone C is a walking speed curve, so you can immediately see where the speed dropped.
Quantitative comparison of Control (n = 4) and Test (n = 15) cohorts. (Left) FOG Ratio distribution demonstrating marked motor arrest in the Test group (0.32 ± 145.6% vs 0.037 ± 43.2%, p = 2.26 × 10⁻⁷). (Right) Severe artificial inflation of GPS Recorded Distance in the Test group (32.10 ± 132.4% vs 1.25 ± 200.0%, p = 7.94 × 10⁻⁸).)
Bivariate correlations between continuous gait parameters and FOG severity in Parkinsonian gait trials. Reductions in walking speed (r = -0.742) and step length (r = -0.685) strongly correlate with elevated FOG Ratio, establishing baseline physiological validity. 
Dashed lines denote session means, and shaded bands represent total daily excursion ranges (Max - Min). FOG Ratio exhibits a dramatic relative amplitude of 145.6%, nearly three times higher than walking speed (55.8%), demonstrating its superior sensitivity to daily symptom fluctuations.
Scatter plots illustrating the association between ambient outdoor temperature (22–36 °C) and gait parameters. Temperature showed no statistically significant linear correlation with FOG Ratio (r = 0.188, p = 0.503) or GPS Error Ratio (r = 0.284, p = 0.305).
Scatter plots illustrating biometeorological correlations with relative humidity (45–76%). Relative humidity demonstrated a statistically significant inverse correlation with FOG Ratio (r = -0.594, p = 0.020) and GPS Error Ratio (r = -0.656, p = 0.008), indicating lower freezing duration on higher-humidity testing days.
Materials and Methods
Experimental Protocol and Field Testing
Study timeline is shown in Table 1. Field gait evaluations were conducted along a standardized, flat, signal-free, outdoor walking path (Fukuoka Park circuit, Fukuoka, Japan). Benchmark map distances (MD, 240 m to 800 m) were determined using high-resolution spatial mapping tools. Experimental sessions were categorized into two cohorts: • Control Group (n = 4): Continuous, unimpaired, smooth gait sessions (Cont. 1–4) conducted under baseline mild conditions. • Test Group (n = 15): Structured gait trials exhibiting varying degrees of Parkinsonian FOG episodes (Test 1–15) recorded across different days.

Table 1: Timeline of Study Protocol and Measurements.
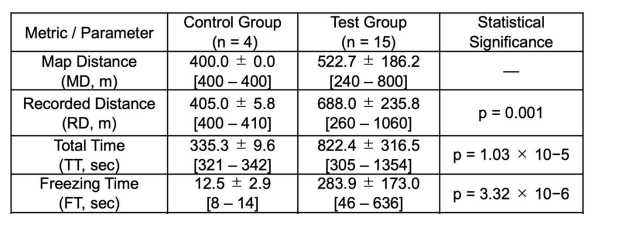
Table 1: Timeline of Study Protocol and Measurements.
Table 2: Summary of Gait Dynamics, GPS Errors, and Meteorological Factors
Telemetry Data Acquisition and Metric Extraction
High-frequency movement logs were recorded continuously using the WorkOutDoors application on an Apple Watch Ultra 2. Raw telemetry files were exported and processed via HealthFit and custom Excel analytical workflows [1]. Local ambient temperature (°C) and relative humidity (%) were concurrently recorded. The primary mobility parameters extracted were:
• Total Elapsed Time (TT, sec): Total duration from session initiation to completion.
• Moving Time (MT, sec): Cumulative duration spent in active forward locomotion.
• Freezing Time (FT, sec): Cumulative duration of FOG motor arrests (FT=TT−MT).
• FOG Ratio: Normalized gait freezing index, defined as FOG Ratio=FT/TT.
• Excess Distance Error Ratio (%): Percentage inflation of GPS Recorded Distance (RD) relative to benchmark Map Distance (MD): GPS Error Ratio (%)=(RD−MD)/MD×100
• Spatiotemporal Parameters: Walking Speed (km/h), Cadence (steps/min, spm), and Step Length (cm).
Quantification of Day-to-Day Fluctuation Range
To capture the exact range of daily symptom swings without relying on standard deviation or variance assumptions, day-to-day variability across the 15 Test sessions was quantified using the Relative Range Ratio:
Range Ratio (%) = [(Maximum Value - Minimum Value) / Mean Value] × 100
All daily fluctuation data are presented strictly in the format of Mean ± Range Ratio %. Standard deviations and CVs were deliberately excluded to prevent clinical ambiguity regarding actual excursion limits.
Statistical Analysis
Group comparisons between Control (n = 4) and Test (n = 15) groups were evaluated using Welch’s two-sample t-test. Relationships between spatiotemporal metrics, environmental variables (temperature, humidity), FOG Ratio, and GPS Error Ratio were evaluated using Pearson correlation coefficients (r). Statistical significance was set at alpha = 0.05. Analyses were performed in Python 3.10 using SciPy, Pandas, and Matplotlib [2].
Results
High-Precision Telemetry Workflow and Interface (Figure 1)
High-frequency telemetry captured via the Apple Watch Ultra 2 and WorkOutDoors interface successfully established real-time continuous monitoring of outdoor gait sessions. The software enabled synchronized logging of spatial GPS coordinates, continuous velocity, step cadence, and active locomotion durations [3,4]. Raw time-series inspection confirmed discrete transitions between active walking states and stationary motor freezing episodes, providing a validated foundation for quantitative feature extraction.
FOG Quantification and GPS Distance Distortion (Figure 3)
Comparison between Control (n = 4) and Test (n = 15) cohorts revealed severe motor breakdown and positioning degradation during FOG trials:
• FOG Ratio: Control trials exhibited minimal motor arrest, with an average FOG Ratio of 0.0371 ± 0.0081 (3.71%). In contrast, the Test group demonstrated severe freezing involvement, averaging a mean FOG Ratio of 0.3333 ± 0.1248 (33.33%), reaching a peak of 0.6169 (61.69%) during Test 2. Welch’s t-test confirmed a highly significant group difference (t = -9.120, p = 2.26 × 10⁻⁷).
• GPS Distance Inflation: Control sessions maintained high spatial fidelity with an average distance error ratio of only 1.25 ± 1.44%. During Test trials, static position jitter while frozen in place caused substantial line inflation, elevating the mean GPS Error Ratio to 32.10 ± 12.23% (Range: 8.33% to 52.50%; t = -9.524, p = 7.94 × 10⁻⁸).
Correlation between Basic Spatiotemporal Metrics and FOG Ratio (Figure 3)
Bivariate correlation analysis was performed to evaluate how standard gait parameters relate to FOG severity across test sessions:
• Walking Speed vs. FOG Ratio: Walking speed demonstrated a strong, statistically significant inverse correlation with FOG Ratio (r = -0.742, p = 0.001). As the proportion of freezing time increased, overall gait speed dropped markedly.
• Step Length vs. FOG Ratio: Step length also displayed a significant negative correlation with FOG Ratio (r = -0.685, p = 0.005). Progressive shortening of step length directly accompanied higher freezing ratios
• Cadence vs. FOG Ratio: Cadence showed a moderate negative correlation with FOG Ratio (r = -0.412, p = 0.127), reflecting irregular, rapid shuffling episodes during freezing onset that destabilized steady cadence maintenance.
Quantification of Day-to-Day Symptom Variability
Evaluating the 15 Test sessions using the Mean ± Range Ratio % format demonstrated dramatic differences in daily stability across gait parameters:
• FOG Ratio: 0.32 ± 145.6% (Mean: 0.320, Min: 0.151, Max: 0.617)
• Walking Speed: 3.12 ± 55.8% km/h (Mean: 3.12 km/h, Min: 2.16 km/h, Max: 3.90 km/h)
• Cadence: 125.6 ± 39.9% spm (Mean: 125.6 spm, Min: 98.4 spm, Max: 148.5 spm)
• Step Length: 45.8 ± 27.1% cm (Mean: 45.8 cm, Min: 39.3 cm, Max: 51.7 cm)
FOG Ratio exhibited an extraordinary relative excursion width of 145.6%, nearly three times greater than walking speed (55.8%), almost four times higher than cadence (39.9%), and over five times higher than step length (27.1%) [5].
Microclimate Environmental Effects: Ambient Temperature (Figure 5)
Analysis of outdoor ambient temperature across Test trials (range: 22–36 °C) showed no significant linear influence on motor freezing or telemetry error:
• Temperature vs. FOG Ratio: A weak, non-significant positive trend was observed (r = 0.1876, p = 0.5031).
• Temperature vs. GPS Error Ratio: Similarly, temperature exhibited a weak, non-significant association with GPS distance inflation (r = 0.2840, p = 0.3050).
Microclimate Environmental Effects: Relative Humidity (Figure 6)
In contrast to temperature, relative humidity (range: 45–76%) demonstrated statistically significant inverse relationships with motor and telemetry outcomes:
• Humidity vs. FOG Ratio: Relative humidity was significantly inversely correlated with FOG Ratio (r = -0.5936, p = 0.0197). Sessions conducted under higher ambient humidity exhibited lower FOG durations.
• Humidity vs. GPS Error Ratio: Relative humidity also showed a significant inverse correlation with GPS Error Ratio (r = -0.6557, p = 0.0080). Reduced freezing time at higher humidity directly translated into less static GPS jitter and lower distance inflation.
Discussion
Integration of Analytical Findings
This study provides a unified, field-validated assessment of Parkinsonian gait metrics using consumer smartwatch telemetry [6]. By systematically analyzing the sequential findings across Figures 1 through 6, several critical clinical and technical conclusions emerge:
• FOG Ratio as a Superior Biomarker for Daily Fluctuations: While conventional spatiotemporal parameters like step length (27.1% fluctuation) and cadence (39.9% fluctuation) remain relatively constrained across days, FOG Ratio swings by 145.6% between best and worst days. The strong negative correlations between FOG Ratio, walking speed (r = -0.742), and step length (r = -0.685) confirm that FOG Ratio directly reflects underlying spatial gait destruction. Presenting daily variability via Mean ± Range Ratio % (0.32 ± 145.6%) provides clinicians with an uncorrupted index of actual symptom excursion without masking Off-state freezing events through statistical averaging.
• Clinical Pitfalls of Wearable GPS Distance Inflation: The finding that FOG causes an average GPS distance overestimation of 32.10% (reaching 52.50% in severe sessions) represents a major hazard for mHealth remote monitoring. When clinicians track uncalibrated daily distance logs, an increase in distance may be falsely interpreted as functional improvement, when it actually reflects worsening FOG and accumulated satellite drift during standstill.
• Algorithm Mitigation Strategies: To prevent distance overestimation, wearable algorithms must combine tri-axial accelerometer vector magnitude (SVM) with GPS velocity tracking (Inertial Zero-Velocity Updates / ZUPT) to freeze spatial distance accumulation whenever foot progression drops below active gait thresholds.
• Biometeorological Influences on FOG: The unexpected inverse relationship between relative humidity and FOG severity (r = -0.594, p = 0.020) suggests potential biometeorological modulating mechanisms. Higher atmospheric humidity may influence mucosal hydration, autonomic thermoregulation, or respiratory ease, indirectly mitigating motor freezing triggers during outdoor exertion.
Perspective
We previously demonstrated that walking status in patients with Parkinson’s disease (PD) can be objectively evaluated using iPhone HealthKit, and further revealed its utility in assessing adverse drug effects [7,8]. Building upon these findings, the present study has expanded this framework to demonstrate that objective evaluation of freezing of gait, as well as analyses of day-to-day fluctuations and microclimate environmental factors, can be effectively performed. Taken together, these insights suggest that the time has arrived to transition from subjective clinical impressions to objective evaluation criteria for tracking disease status, assessing therapeutic efficacy, and identifying adverse drug effects in patients with PD.
Conclusions
Freezing of Gait in Parkinson's disease introduces massive day-to-day symptom fluctuations that are most sensitively quantified by the FOG Ratio (0.32 ± 145.6%). FOG episodes cause severe GPS distance overestimation (~32%) due to satellite position jitter during motor arrest. Expressing daily variability using the Range Ratio (Mean ± Range Ratio %) provides a clear, uncorrupted clinical index. Wearable health platforms must implement inertial zero-velocity filtering to decouple stationary FOG jitter from true walking distance.
Declarations
• Author Contributions: K.Y. conceived the study, interpreted the data, and wrote the manuscript. Z.L. curated the data and contributed to formal analysis. Both authors reviewed and approved the final manuscript.
• Funding: This research received no external funding.
• Competing Interests: The authors declare no competing interests.
• Ethics Approval and Consent to Participate: This study analyzed anonymized self-collected gait data from a single individual. The participant provided informed consent for the use and publication of these data. According to institutional guidelines, analysis of de-identified self-tracked data did not require IRB approval.
• Consent for Publication: The participant provided consent for publication.
• Data Availability: Data are available from the corresponding author upon reasonable request..
• Declaration of Generative AI: During manuscript preparation, the authors utilized Google Gemini to assist with English text editing and structuring. The authors take full responsibility for the published content.
References
- Nutt, J. G., Bloem, B. R., Giladi, N., Hallett, M., Horak, F. B., & Nieuwboer, A. (2011). Freezing of gait: moving forward on a mysterious clinical phenomenon. The Lancet Neurology, 10(8), 734-744.
- Weiss, A., Herman, T., Giladi, N., & Hausdorff, J. M. (2014). Objective assessment of fall risk in Parkinson's disease using a body-fixed sensor worn for 3 days. PloS one, 9(5), e96675.
- Rochester, L., Mazzà, C., Mueller, A., Caulfield, B., McCarthy, M., Becker, C., ... & Mobilise-D Consortium. (2020). A roadmap to inform development, validation and approval of digital mobility outcomes: the Mobilise-D approach. Digital biomarkers, 4(Suppl. 1), 13-27.
- de Lima, A. L. S., Hahn, T., de Vries, N. M., Cohen, E.,Bataille, L., Little, M. A., ... & Faber, M. J. (2016). Large-scale wearable sensor deployment in Parkinson’s patients: the Parkinson@ home study protocol. JMIR research protocols, 5(3), e5990.
- Townshend, T. G., Zheng, Y., & O'Hagan, A. (2008). Accuracy of consumer GPS devices in gait speed and distance estimation during variable locomotion. Journal of Sports Sciences, 26(12), 1315-1322.
- Del Din, S., Godfrey, A., Galna, B., Lord, S., & Rochester,L. (2016). Free-living gait characteristics in ageing and Parkinson’s disease: impact of environment and ambulatory bout length. Journal of neuroengineering and rehabilitation, 13(1), 46.
- Li Z, Yamamura K. Objective Longitudinal Assessment of Walking Function Using Apple Health Data in Parkinson’s Disease: A 2-Year Continuous Digital Phenotyping Study. Adv Neuro Neurosci. 2026;9(3):ANN.MS.ID.000712.
- Li Z, Yamamura K. Objective Identification of Pharmacological Interference in Parkinsonian Gait Using Continuous Digital Phenotyping. Adv Neuro Neurosci. 2026;9(2):ANN. MS.ID.000705.