


Research Article - (2026) Volume 5, Issue 1
Quantifying the Use of Routine Health Service Data to Inform Policy and Interventions in Maternal and Child Healthcare Experience from Tanzania
2University of Dodoma, Dodoma, United Republic of, Tanzania
3African Leaders Malaria Alliance (ALMA), Dar Es Salaam, United Republic of, Tanzania
4Muhimbili University of Health and Allied Sciences, Dar Es Salaam, United Republic of, Tanzania
Received Date: Jan 22, 2026 / Accepted Date: Feb 20, 2026 / Published Date: Mar 05, 2026
Copyright: ©2026 RAhmad Mohamed Makuwani, et al. This is an open-access article distributed under the terms of the Creative Commons Attribution License, which permits unrestricted use, distribution, and reproduction in any medium, provided the original author and source are credited.
Citation: Makuwani, A. M., Habib, I. R., Mpembeni, R., Katalambula, L. K., Duque, D., et al. (2026). Quantifying the use of routine health service data to inform policy and interventions in maternal and child healthcare. Experience from Tanzania. J Surg Care, 5(1), 01-08.
Abstract
Introduction: Global experts and agencies often downplay the value of routine Reproductive, Maternal, Newborn, Child and Adolescent Health (RMNCAH) data. Therefore, we demonstrate the significance of a Health Information Management System (HMIS) for tracking progress and determining the usefulness of RMNCAH data for improving healthcare systems, particularly in low-resource settings.
Methods: We utilised HMIS and related datasets to evaluate the availability and usefulness of RMNCAH routine data in Tanzania between 2014 and 2024.
Results: Increases in service delivery points correlated with the following improvements in key maternal health indicators: antenatal visits before 12 weeks (15.1% to 42.9%; 2014–2023), institutional births (64.4% to 85.8%; 2014–2023), cesarean sections (5.6% to 11.6%; 2014–2022), and postnatal visits (45.3% to 91.6%; 2014–2023). The RMNCAH scorecard transitioned from predominantly red in 2014 to green in 2024, reflecting improved maternal and perinatal mortality surveillance. Obstetric haemorrhage and pre-eclampsia accounted for two-thirds of maternal deaths; competency and accountability were critical determinants. Neonatal deaths and stillbirths during 2018–2023 numbered 50,123 and 82,995, respectively, with 80% of neonatal deaths attributed to prematurity, birth asphyxia, and sepsis. Limited neonatal services contributed to mortality, with only 14 hospitals containing neonatal care units in 2018, compared with 156 district and 28 regional hospitals in 2024.
Conclusion: When systematically tracked and analysed, routine RMNCAH data provide crucial evidence to inform policymaking and track RMNCAH intervention outcomes. Our findings highlight the value of stakeholders investing in routine data to enhance data-driven decision-making and real-time progress tracking.
Keywords
Health Information Systems, Maternal Health, Maternal Mortality, Neonatal Mortality, Perinatal Mortality, Pre-Eclampsia, StillbirthKey Messages
The global experts, stakeholders, and scholars have consistently downplayed the significance and capacity of routine data for tracking performance and informing policy in the design of new interventions and approaches. Apparently, the argument is that routine data are often incomplete and do not reflect the community at large. However, routine data are readily available in the developing world, and when appropriately managed, they can be a reliable and highly informative source for the health sector. This study provides an opportunity to learn from Tanzania's experience using routine data for health sector planning, tracking, and measuring progress on various health systems, such as improving RMNCAH service delivery and strengthening interventions to reduce maternal and perinatal deaths.Introduction
The Health Information Management System (HMIS) was introduced in 1980, when public and non-governmental organisation sectors operated multiple separate health data collection tools. Specifically, the Extended Program Immunisation, the National AIDS Control Program, and the National TB and Leprosy Program each had its own independent system. The fragmented nature of data collection tools led to a lack of bottom-up feedback, overburdened health workers, and inefficiencies. In 1991, a pilot study was conducted in Iringa and Mbeya, Tanzania, which was then expanded to 20 regions in 1997 [1]. HMIS data collection relies on paper-based tools at health facilities (HFs), which are summarised and entered into the District Health Information System version 2 (DHIS2) at the district council level. However, a combination of paper-based and electronic tools can impede data quality, particularly during collection and processing for entry into electronic systems [2]. Rumisha et al. (2020) observed that inconsistencies in HMIS tools compromise data accuracy owing to incompleteness, misreporting, and the use of tally sheets at household and district levels [3,4]. The Tanzania National Health Policy 2007 provides a framework for health system performance, emphasising collaboration with private and international organisations to enhance data stewardship, surveillance, and response [5]. The Health Sector Strategic Plan V acknowledges progress in data quality, availability, and reliability, but highlights challenges such as parallel and disintegrated data systems that hinder interoperability. Despite aiming to improve data quality and efficiency, electronic medical record development remains insufficiently integrated with standard HMIS platforms [6].
Routine data in developing countries is a primary source of information in the healthcare sector, yet undervalued by global experts [7]. HF maternal deaths are reviewed to identify health bottlenecks, enabling corrective actions. Similarly, HMIS data in Tanzania have guided the government decision-making, including budget prioritisation, service delivery tracking, and disease burden assessment. These data are periodically visualised using scorecards coded with traffic-light colours (grey, red, yellow, green) to facilitate interpretation by decision-makers.
On October 28–29, 2013, a team from the Ministry of Health, Tanzania, attended a data-use course organised by the World Health Organisation (WHO), Africa Leaders Malaria Alliance (ALMA), and other stakeholders. By then, the ALMA scorecard was already in use, serving as a case study for the utilisation of Reproductive, Maternal, Newborn, Child, and Adolescent Health (RMNCAH) data. The Tanzania team requested technical assistance from ALMA to develop and launch its first RMNCAH scorecard.
Routine data collected in Tanzania include maternal death data, which are systematically collected from HFs and the community, reported to a network of reproductive and child health coordinators at district and regional levels, and finally provided to the Ministry of Health after review. Maternal death reports are typically received within 24 h, although the Maternal and Perinatal Death Surveillance and Response (MPDSR) guideline requires 48 h [8]. Notifications are sent via WhatsApp and verified after 1 week via a designated email account. In this study, we assess the performance and routine reporting of RMNCAH indicators in Tanzania since their implementation. We also evaluate maternal and perinatal death reporting through the MPDSR system from 2018 to 2024. The aim of this study is to demonstrate the importance of using routine RMNCAH data to inform the implementation and development of health policies. By highlighting changes in RMNCAH and Emergency Obstetric and Newborn Care (EmONC) indicators from 2014 to 2024, this study provides valuable insights regarding the use of routine data in low-resource countries.
Methods
Study Design
This cross-sectional descriptive study utilised Tanzania HMIS data to track RMNCAH indicator performance and routine reporting of maternal and perinatal deaths.
Study Setting and Participants
HMIS routine data were collected from all public and private HFs at the regional and council levels. These included clinics, dispensaries, health centres, district hospitals, regional referral hospitals, and national hospitals that provide RMNCAH services and report maternal and perinatal deaths across the Tanzania Mainland.
Study Variables
Study variables included RMNCAH indicators, EmONC coverage indicators, and maternal and perinatal deaths reported through the MPDSR system. EmONC coverage was measured using the following UN processes indicators (9): number and geographical distribution of EmONC facilities, proportion of births in EmONC facilities, cesarean section rate per population, met need for EmONC services, and case fatality rate. RMNCAH indicators We employed HMIS data from DHIS2, the vaccine information management system (VIMS), and the electronic logistics management information system (eLMIS) (Table 1). Data collection begins at HFs, where paper-based or electronic systems record client, service, and health commodity information using standard HMIS registers. In paper-based systems, a tally sheet records daily variables, which are summarised monthly and then entered into DHIS2/VIMS/eLMIS within the first week of each month. Data from paper-based systems are summarised at the HF and submitted to the district council, where the HMIS focal person enters them into the electronic DHIS2 system.
HFs using electronic medical records export summarised data locally to DHIS2 for routine data storage and analysis. Facility summary data entered into DHIS2, VIMS, and eLMIS are discrete variables aggregated into council, regional, and national summaries. Summarised data are mathematically processed using an in-built formula with numerators and denominators to generate RMNCAH indicators. These indicators are expressed as proportions and rates (in percent), using denominators based on total service beneficiaries or the population available within DHIS2.
|
Pre-pregnancy care |
Pregnancy care |
Postpartum care |
Child health care |
HMIS data quality |
|
i.% of contraceptive |
iii.% of ANC visits before |
xiii.% of Postnatal (PNC) |
xiv.% of PNC baby |
xx.% of average |
|
coverage -modern |
12 weeks |
mothers (with 48 hours) |
(within 48 hours) |
timeliness |
|
methods |
iv.% of ANC 4th visits |
|
xv.% of infants received |
|
|
ii.% of female clients |
Coverage |
|
ARV prophylaxis |
|
|
who received long-term |
v.% of ANC IPT 2 |
|
xvi.% of infants received |
|
|
contraceptive methods |
coverage |
|
PCR test |
|
|
|
vi.% of pregnant women |
|
xvii.% of children |
|
|
|
received Fefol (Iron Folic) |
|
received Penta3 |
|
|
|
supplementation |
|
xviii.% of children |
|
|
|
vii.% of couples tested for |
|
received MR2 |
|
|
|
HIV |
|
xix.% of children 12 – 59 |
|
|
|
viii.% of adolescents who |
|
months received vitamin |
|
|
|
are pregnant or have started |
|
A supplementation |
|
|
|
childbearing |
|
|
|
|
|
ix.% of institutional |
|
|
|
|
|
delivery coverage |
|
|
|
|
|
x.% of deliveries conducted |
|
|
|
|
|
by skilled attendant |
|
|
|
|
|
xi.% of deliveries by |
|
|
|
|
|
skilled attendant |
|
|
|
|
|
% of mothers given |
|
|
|
|
|
uterotonic interventions |
|
|
|
|
(ANC – antenatal care, IPT – intermittent presumptive treatment, ARV – anti-retrovirus, PCR – polymerase chain reaction, MR – measles rubella vaccine, HMIS – Health Management Information System) |
||||
Table 1: Variables for the RMNCAH Scorecard from 2014 – 2024
The RMNCAH scorecard, which has tracked performance trends from 2014 to 2024, visualizes indicators through a traffic-light system, reflecting country-set performance thresholds from sector strategies, where red, yellow, and green indicate not on track, progress requiring more effort, and target achieved/on track, respectively. EmONC indicators EmONC facility data were extracted from the Health Facility Registration System, with maternal and perinatal death data obtained from the MPDSR system. Data on facilities providing basic and comprehensive EmONC services were collected from the HF registration system, which tracks facility coverage and helps monitor ongoing progress expanding EmONC services in Tanzania.
The estimated number of women with EmONC complications was calculated as 15% of expected annual pregnancies, with case fatality determined using the number of maternal deaths per year divided by the number of complications multiplied by 100 (%). Maternal and perinatal death data Maternal and perinatal death data are collected through the MPDSR system from HFs and the community. Notifications are sent daily, and reports are submitted weekly from the point of care to council, regional, and national levels.
Data Quality
The data used in this study were validated upon entry, with monthly and quarterly quality reviews and assessments conducted at facility, council, regional, and national levels. Data summits represent a standard process for ensuring quality. To maintain accuracy, data validation occurs during and after entry, with performance, timeliness, and completeness flagged at facility, council, and regional levels. Data extraction is performed by the Ministry’s M&E Officer, who ensures data completeness and accuracy. The analysis included
(i) Coverage of the six UN process indicators.
(ii) RMNCAH scorecard evolution and visualization (2014–2024).
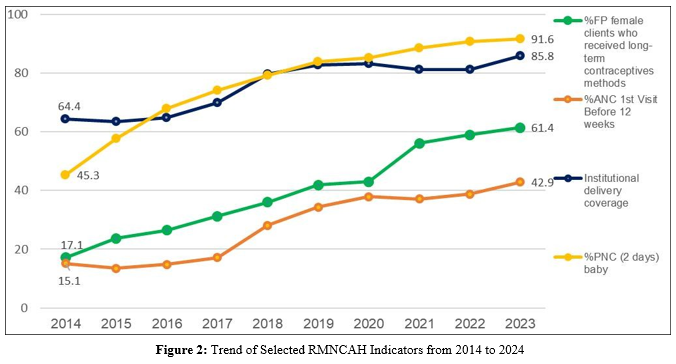
(iii) Graphic trends of “antenatal care 4th visit”, “institutional delivery”, “postnatal care”, and “pentavalent/DPT third dose” (2014–2024).
(iv) Changes in MPDSR data over time in relation to survey data.
Statistical Analysis
This study used simple pictures and simple ratios to describe the patterns of health system development, including the availability of EmONC services, RMNCAH scorecards and trends for maternal and newborn deaths. The EmONC health facility and service coverage analysis employed simple ratios and pictorial representations to demonstrate the change. The RMNCAH scorecard used was chosen at 2 2-year intervals from 2014 – 2024 and was presented in pictorial colour changes from red (bad), yellow (making progress), and green (on target).
Ethical Approval
Data collection and review of routine RMNCAH, maternal, and perinatal deaths are part of routine quality-improvement efforts. These data are processed, reviewed, stored, and archived at the Ministry of Health and are presented as aggregates that do not include patient names, with maternal and perinatal deaths kept confidential. Patient consent was not required because this study used archived data. Permission to publish these results was granted by the University of Dodoma Institutional Research Review Committee, on behalf of the National Health Research Ethics Sub-Committee of the National Institute for Medical Research, with reference number MA.84/261/67/16.
Patient and Public Involvement
It was neither appropriate nor possible to involve patients or the public in the design, conduct, reporting, or dissemination plans for our research. This study used archived HMIS data. No patients were directly involved. The data are collected from the health facilities, analysed and deposited at the district level, and finally appear in the National database. Periodically, RMNCAH data are reviewed and disseminated to the public and made available on various platforms, including the web.
Results
Between 2014 and 2024, the United Republic of Tanzania invested in expanding the availability of HFs providing RMNCAH services. This study included 8,319 dispensaries, 1,250 health centres, and 452 hospitals across 184 councils in 26 regions, of which 14.6% are privately owned.
Coverage of UN EmONC Process Indicators
This study observed an increase in the number of EmONC facilities over time. In 2015, the number of HFs providing EmONC services was 6,790, which increased to 10,380 by 2021/2022. Additionally, the number of health centres performing cesarean sections increased from 107 (19.7%) in 2015 to 523 (43.9%) in 2023. As shown in Table 2, the summary of UN EmONC process indicators reflects the progress made in expanding EmONC services over time.
|
UN process indicator |
Definition |
Recommended level |
Progress made by Tanzania |
|
Amount of EmONC services available |
Number of health facilities with EmONC services |
Min: 1 CEmONC and 4 BEmONC for 500,000 population |
Every ward has EmONC HF |
|
Geographical distribution of EmONC health facilities |
Geographical distribution of health facilities providing EmONC services |
Min: 100% of subnational areas have an acceptable number of BEmONC facilities |
Good |
|
Proportional births in EmONC facilities |
Percentage of births in the population taking place in health facilities |
Minimum 15% |
85% |
|
Met need for EmONC services |
Percentage of women with obstetric complications treated in EmONC facilities |
At least 100% (estimated to be 360,000, which is 15% of all pregnancies) |
Limitation: skills, practice, and attitude (MPDSR report) |
|
Cesarean as a percentage of all births |
Cesarean section as a percentage of all births in the population |
Recommended: 5–15% |
11% (HMIS) |
|
Case fatality rate |
The percentage of women with complications who die |
Maximum: 1% |
0.7 (projection from national MMR) |
|
BEmONC: Basic Emergency Obstetric and Newborn Care; CEmONC: Comprehensive Emergency Obstetric and Newborn Care; Yellow: In progress; Green: On target |
|||
Table 2: Summary of UN EmONC process indicators [9]
Visualisation of RMNCAH Scorecards from 2014 to 2024
Figure 1 illustrates improvements in RMNCAH indicators over 9 years, progressing from poor (red) to moderate (yellow) to excellent (green). The increase in service delivery points correlated with an upward trend in the 4th antenatal visit (from 46.4% in 2017 to 110.4% in 2022), institutional births (from 69.9% in 2017 to 81.1% in 2022), cesarean section rates (from 5.6% in 2015 to 11.6% in 2022), and pentavalent vaccine coverage for children under five years (from 88.9% in 2017 to 93.8% in 2022) (Figure 2). This progress was driven by increased budget allocation for medicines and supplies from the government and development partners through direct financing, the Health Basket Fund, and the Compact Agreement with UNFPA, ensuring RMNCAH commodity security. The RMNCAH scorecard transitioned from predominantly red in 2014 to predominantly yellow, then green in 2024, indicating improvements.

Figure 1: RMNCAH Scorecard from 2014 – 2024
Use of Maternal and Neonatal Death Data to Inform Policy
The number of maternal deaths reported through the surveillance system was 1,744 in 2018, compared with 1,498 in 2023 (Table 2). Similarly, 11,524 neonatal deaths and 17,082 stillbirths were reported in 2018, compared to 7,164 and 13,714 in 2023, respectively. Tracked maternal death data indicated that over 90% occur in HFs, with two out of every five occurring in referral HFs. From 2018 to 2023, tracked neonatal deaths and stillbirths numbered 50,123 and 82,995, respectively (Table 3). The leading clinical causes of maternal deaths were obstetric haemorrhage (44.4%), pre-eclampsia/eclampsia (16.6%), abortion complications (10%), puerperal sepsis (9.5%), pulmonary embolism (6.8%), surgical and anaesthesia complications (3.3%), and other causes (9.4%). A review of maternal deaths revealed that obstetric haemorrhage and pre-eclampsia accounted for more than two-thirds of cases. Moreover, the underlying contributors to these deaths were health system bottlenecks, particularly competency, clinical practice, attitude, and accountability.
A review of tracked neonatal deaths showed that 80% resulted from low birth weight (prematurity), birth asphyxia, and sepsis. Other causes included congenital anomalies, such as gastroschisis, omphalocele, neural tube defects, and congenital heart diseases. Critically, these infants died because of limited services; as of 2014, only 14 hospitals in Tanzania had neonatal care units (NCUs). This evidence reached the highest levels of government decision-making, elevating the neonatal care agenda to a national priority. By June 2024, 156 district hospitals and 28 regional referral hospitals had established NCUs.
|
Year |
2018 |
2019 |
2020 |
2021 |
2022 |
2023 |
Total |
|
No. of maternal deaths |
1,744 |
1,657 |
1,640 |
1,588 |
1,541 |
1,498 |
9,668 |
|
Referral hospitals (%) |
41.0 |
39.1 |
37.2 |
42.2 |
47.8 |
46.9 |
42.2 |
|
District hospitals (%) |
34.3 |
30.3 |
29.1 |
22.5 |
21.5 |
22.7 |
27.0 |
|
Health centres and dispensaries (%) |
18.1 |
23.6 |
26.5 |
28.7 |
23.8 |
23.3 |
23.9 |
|
Community (%) |
6.5 |
6.9 |
7.1 |
6.6% |
17.0 |
6.8 |
6.8 |
|
Stillbirth and neonatal deaths |
28,606 |
27,020 |
20,366 |
18,269 |
17,979 |
20,878 |
133,118 |
|
% of neonatal deaths |
40.3 |
35.8 |
40.2 |
36.9 |
37.9 |
34.3 |
37.7 |
|
% of stillbirths |
59.7 |
64.2 |
59.8 |
63.1 |
62.1 |
65.7 |
62.3 |
Table 3: Tracked Maternal and Neonatal Deaths Between 2018 and 2023
Discussion
Routine data tracking, processing, and utilisation have significantly contributed to the growth of the health sector in Tanzania and informed population health needs. This aligns with a recent Internal Auditor General report, which showed an improvement in data quality from 45% in 2016 to 92% in 2019 [2,10]. Data visualisation through scorecards enables rapid assessment of health sector achievements. During the 2013/14 midterm review, the scorecard system identified inadequate HF coverage as a critical barrier to service delivery in Tanzania, prompting the 2015 EmONC assessment, which confirmed EmONC service gaps in certain regions. At that time, the cesarean section rate was 5% in urban areas and 3% in rural regions, with Simiyu 1% below the WHO-recommended range of 5–15% [11,12]. Investments in EmONC services have since expanded access, and the 2022 TDHS report now shows a cesarean section rate of 11%, which is higher than that in both 2015 (6%) and 2010 (5%) [13-15].
Innovative maternal and newborn death reviews have generated strategic insights into governance, leadership, skill gaps, clinical practice, attitudes, and accountability, sparking a national dialogue on professional development. Tracking and reviewing stillbirth and neonatal outcome data has been crucial in understanding why the neonatal mortality rate in Tanzania remained statistically unchanged from 2010 to 2022. In 2005, the neonatal mortality rate was 32 per 1,000 live births, dropping to 26 per 1,000 live births in 2010. The prioritisation of key investments in NCUs, mentorship, and supportive supervision, such as the Helping Babies Breathe initiative, introduced in 2009, ensured that this rate remained stable, then declined to 25 per 1,000 live births in 2015/16 and 24 per 1,000 in 2022 [13,14,16,17]. Root-cause analysis revealed that 20% of newborns require admission after birth, yet Tanzania initially lacked wards to manage sick neonates. This identified gap led to investments in NCUs, increasing the number of hospitals with NCUs from 14 in 2014 to 156 district hospitals and 28 regional hospitals today [18].
Effectiveness of Evidence to Advocate for Change to Policymakers
Evidence from the RMNCAH scorecard, maternal death, neonatal death, and stillbirth studies has been instrumental in advocacy efforts from the highest levels of government to the Ministry of Health and planning authorities. Drawing from the English idiom “he who pays the piper calls the tune,” technocrats and program managers generated evidence (the pay) and presented it to politicians (the piper) to drive momentum in reducing maternal, newborn, and child mortality, aligning with the RMNCAH Sharpened Plan 2014–2015, Health Sector Strategic Plan V, One Plan III, and the “Jiongeze Tuwashe Salama” Campaign launched in November 2018 [6,19-21]. Based on this evidence, the government increased the health sector budget, initiated an ambitious plan to construct and equip EmONC facilities and NCUs, and improved access to RMNCAH life-saving commodities and maternal and neonatal care.
Conclusion
This study demonstrates the importance of systematically improving the tools used to track and analyse routine health data in low-resource countries. For example, Tanzania began over 30 years ago with investments in routine health data, and today benefits from the significant improvements achieved in this area. Routine data, when properly tracked and analysed, serve as a valuable evidence base for policymaking regarding interventions, both when the health system is performing well and when it is lagging behind. Although researchers and global agencies may undervalue routine data, it has been instrumental in transforming the health sector in Tanzania. Therefore, we urge countries and stakeholders to invest in high-quality, cost-effective routine data to strengthen health sector decision-making. This study has some limitations. Managing data, particularly during the transition from paper-based to electronic systems, always incurs the risk of errors in data entry, processing, and system integration. However, data validation can mitigate these challenges. In conclusion, Tanzania has utilised routine RMNCAH data to inform the progress of various interventions and made significant contributions to developing new approaches for saving lives. This study serves as a wake-up call to avoid neglecting the value embedded in routine data, instead employing it to improve quality, enhance data-driven decision-making, and facilitate real-time progress tracking.
Funding
None declared.
Acknowledgments
We would like to express our sincere gratitude to Tanzanian health workers, including district and regional health management teams and the national HMIS team, for their dedication in collecting, storing, processing, and ensuring the release of a complete set of health system indicators. We also thank Mr Salum Faru for his invaluable time and effort in generating multiple data visualisations for this study.
Competing Interest
None declared. Ethics Approval Approved by the Patient Consent for Publication Not required (retrospective anonymized data).
Data Availability Statement
The datasets used and/or analysed during the current study are available from the corresponding author on reasonable request. The RMNCAH scorecards may be accessed from the link below: https://hmisportal.moh.go.tz/hmisportal/
Contributorship
Author contributions are written in accordance with the CRediT statement: AMM: Conceptualization, Methodology, Analysis, Acquiring data, Writing – Original Draft, Visualization and Project administration; IRH: Conceptualization, Methodology, Analysis, Supervision, Visualization, JC: Conceptualization, Methodology, Analysis, Supervision, Visualization; RM: Conceptualization, Methodology, Analysis, Writing – Original Draft, Visualization; LKK: Conceptualization, Methodology, Analysis, Writing – Original Draft, Visualization; DD: Conceptualization, Methodology, Analysis, Writing – Original Draft, Visualization; AM: Conceptualization, Methodology, Analysis, Writing – Original Draft, Visualization; FAB; Conceptualization, Methodology, Analysis, Writing – Original Draft, Visualization; NC: Conceptualization, Methodology, Analysis, Writing – Original Draft, Visualization; GMM: Conceptualization, Methodology, Analysis, Writing – Original Draft, Visualization; and, SKN: Conceptualization, Methodology, Analysis, Writing – Original Draft, Visualization.
References
- Rubona, J. J. (n.d.). Routine health information systems that operate in Tanzania. Dar es Salaam.
- United Republic of Tanzania, Ministry of Finance and Planning, & Integrated Assessment Group for Development. (2016, August). Independent verification of health service results supported by the Health Basket Fund and the Strengthening of Primary Health Care for Results Programme for the financial year 2015/16. Dar es Salaam.
- Rumisha, S. F., Lyimo, E. P., Mremi, I. R., et al. (2020). Data quality of the routine health management information system at the primary healthcare facility and district levels in Tanzania. BMC Medical Informatics and Decision Making, 20(1), 340.
- Mremi, I. R., Rumisha, S. F., Chiduo, M. G., et al. (2018). Hospital mortality statistics in Tanzania: Availability, accessibility, and quality 2006–2015. Population Health Metrics, 16(1), 16.
- United Republic of Tanzania, Ministry of Health and Social Welfare. (2007). Tanzania health policy. Dar es Salaam.
- United Republic of Tanzania, Ministry of Health. (2021). Health Sector Strategic Plan Five July 2021 – June 2026 (HSSP V): Leaving no one behind. Dar es Salaam.
- Mgawadere, F., Kana, T., & van den Broek, N. (2017). Measuring maternal mortality: A systematic review of methods used to obtain estimates of the maternal mortality ratio (MMR) in low- and middle-income countries. British Medical Bulletin, 121(1), 121–134.
- United Republic of Tanzania, Ministry of Health and Social Welfare. (2019). Maternal and perinatal death surveillance and response guidelines (3rd ed.).
- Averting Maternal Death and Disability (AMDD). (2003). AMDD workbook: Using the UN process indicators for emergency obstetric services-Questions and answers. Columbia University, Mailman School of Public Health.
- Internal Auditor General Department. (2024, May). Independent verification of health service results supported by the Health Basket Fund (HBF) and Tanzania Maternal and Child Health Investment Program (TMCHIP) – 2023. Dar esSalaam.
- Ministry of Health and Social Welfare. (2015). Assessment on reproductive maternal newborn and child health in Tanzania Mainland. Dar es Salaam.
- Ministry of Health and Social Welfare. (2013). Mid-term review of the national road map strategic plan to accelerate reduction in maternal, newborn, and child deaths in Tanzania (2008–2015). Dar es Salaam.
- Ministry of Health Tanzania Mainland, Ministry of Health and Social Welfare Zanzibar, National Bureau of Statistics, Office of Chief Government Statistician, & ICF. (2022). Tanzania Demographic and Health Survey and Malaria Indicator Survey 2022 final report.
- Ministry of Health, Community Development, Gender, Elderly, and Children (Tanzania Mainland), Ministry of Health and Social Welfare (Zanzibar), National Bureau of Statistics, Office of Chief Government Statistician, & ICF. (2016). Tanzania Demographic and Health Survey and Malaria Indicator Survey (TDHS-MIS) 2015–16. Dar es Salaam, Tanzania, and Rockville, MD, USA.
- Ministry of Health and Social Welfare Tanzania Mainland, Ministry of Health and Social Welfare Zanzibar, National Bureau of Statistics, Office of Chief Government Statistician, & ICF Macro. (2011). Tanzania Demographic and Health Survey 2010. Dar es Salaam, Tanzania.
- Msemo, G., Massawe, A., Mmbando, D., et al. (2013). Newborn mortality and fresh stillbirth rates in Tanzania after Helping Babies Breathe training. Pediatrics, 131(2), e353–e360.
- Afnan-Holmes, H., Magoma, M., John, T., et al. (2015). Tanzania’s Countdown to 2015: An analysis of two decades of progress and gaps for reproductive, maternal, newborn, and child health, to inform priorities for post-2015. The Lancet Global Health, 3(7), e396–e409.
- Division of Reproductive Health and Child Health Services. (2024). Availability of neonatal care units in Tanzania. Dodoma.
- United Republic of Tanzania, Ministry of Health and Social Welfare. (2014). The national road map strategic plan to accelerate reduction of maternal, newborn and child deaths in Tanzania 2008–2015 (Sharpened One Plan).
- United Republic of Tanzania, Ministry of Health. (2018). Jiongeze Tuwashe Salama: A plan to increase accountability to all players in maternal and child health.
- Ministry of Health, Community Development, Gender, Elderly, and Children (MOHCDGEC). (2021). National plan for reproductive, maternal, newborn, child and adolescent health & nutrition (2021/2022–2025/2026): One Plan III. Dar es Salaam: MOHCDGEC.