
Petroleum and Chemical Industry International(PCII)
ISSN: 2639-7536 | DOI: 10.33140/PCII
Impact Factor: 0.719

Research Article - (2025) Volume 8, Issue 3
Production Decline and Maturity Assessment of the Rio Del Rey Basin, Cameroon: A Decade-Long Analysis (2012–2022)
2Center for Energy and Petroleum Studies (CEPETRO), Universidade Estadual de Campinas, (UNICAMP), Rua Cora Carolina, 350, Campinas, Sao Paulo, Brazil
3School of Geology and Mining Engineering, University of Ngaoundéré, P.O. Box 115, Meiganga, Cameroon
Received Date: Sep 30, 2025 / Accepted Date: Oct 24, 2025 / Published Date: Dec 08, 2025
Copyright: ©2025 Donald Kuiekem, et al. This is an open-access article distributed under the terms of the Creative Commons Attribution License, which permits unrestricted use, distribution, and reproduction in any medium, provided the original author and source are credited.
Citation: Kuiekem, D., Kingue. S. D. E., Noupa, R. K., Boroh, W., Bessong, M., et al. (2025). Production Decline and Maturity Assessment of the Rio Del Rey Basin, Cameroon: A Decade-Long Analysis (2012
Abstract
The Rio Del Rey Basin, historically Cameroon's primary hydrocarbon province, is undergoing irreversible structural decline that threatens the country's energy security and economic stability. This study presents a comprehensive quantitative assessment of the basin's maturity through analysis of production, drilling, and reserves data from the National Hydrocarbons Corporation (SNH) from 2012 to 2022. Our findings reveal a critical reserves renewal crisis, evidenced by a 0% oil Reserve Replacement Ratio (RRR) in 2021–2022 and continuous erosion of the oil Reserves to Production (R/P) ratio. Simultaneously, the gas R/P ratio experienced a dramatic plunge following the 2018 startup of the Hilli Episeyo FLNG facility, marking Cameroon's strategic transition toward gas exploitation. The root causes are identified as systematic abandonment of oil exploration coupled with accelerated reservoir degradation. This research demonstrates that current maintenance drilling strategies yield diminishing returns and concludes that only immediate implementation of enhanced oil recovery techniques and strategic infrastructure repurposing can mitigate decline and maximize residual value from this mature basin.
Keywords
Production Decline, Mature Basin, Reserve Replacement Ratio (RRR), Reserves-to-Production Ratio (R/P), Reservoir Depletion; Enhanced Oil Recovery (EOR)
Nomenclature
bbl: barrel
Bopd: barrels of oil per day
Bcpd: barrels condensate per day
mD: millidarcy
M bbl : million barrels
Mmscf/d: million standard cubic feet per day
Mtpa: million tonnes per annum
Scf: standard cubic feet
TCF: trillion cubic fee
t Φ: porosity
K: permeability
Abbreviations
API: American Petroleum Institute
AR: Added Reserves
DKC: Douala/Kribi-Campo Basin
EOR: Enhanced Oil Recovery
FLNG: Floating Liquefied Natural Gas
GOR: Gas-Oil Ratio
KPI: Key Performance Indicator
LB: Logone Birni Basin
LPG: Liquefied Petroleum Gas
P&A: Plugged and Abandoned
RDR: Rio Del Rey Basin
R/P: Reserves-to-Production Ratio
RRR: Reserve Replacement Ratio
SNH: Société Nationale des Hydrocarbures (National Hydrocarbons Corporation)
SPE: Society of Petroleum Engineers
USGS: United States Geological Survey
Introduction
For decades, Cameroon's oil sector has been a cornerstone of its economy. However, since the late 2010s, this vital industry has entered a period of sustained structural decline. The numbers tell a clear story: average daily crude production has plummeted from a peak of around 100,000 barrels per day in the 2000s to an estimated 54,000–60,000 barrels in 2024–2025. This downturn is particularly acute in the Rio Del Rey (RDR) Basin, a region in the Gulf of Guinea that has historically supplied over 70% of the nation's oil. This challenge is not Cameroon's alone; it echoes across oil producing nations in Africa like Nigeria and Angola, all grappling with volatile global markets and the worldwide shift towards cleaner energy [1,2]. For Cameroon, the implications are severe. The decline threatens to undermine the country's energy security, reduce crucial state revenues (which still rely on oil for 16 – 20% of its budget), and destabilize macroeconomic growth, all while widening the current account deficit.
To this end, the investigation is guided by three primary objectives:
• To evaluate the maturity level of the Rio Del Rey Basin through a systematic analysis of its production history and reserves data.
• To quantify the observed production decline by employing key industry metrics, specifically the Reserve Replacement Ratio (RRR), the Reserves-to-Production (R/P) ratio, and well flow rates.
• To classify reservoir performance based on production data, thereby distinguishing areas with residual potential from those nearing exhaustion. T
hrough this structured approach, the study seeks to provide a critical diagnostic foundation for strategic planning aimed at mitigating production decline and optimizing the basin's remaining value [3,4].
Context of Petroleum Activities in Cameroon
Cameroon's hydrocarbon resources are geographically and strategically defined by three principal sedimentary basins: the Rio Del Rey (RDR), the Douala/Kribi-Campo (DKC), and the Logone Birni (LB). Together, these formations constitute the core of the nation's oil and gas sector, yet they represent markedly different stages of the resource lifecycle. (Société Nationale des Hydrocarbures n.d.) The Rio Del Rey (RDR) Basin stands as the patriarch of Cameroonian production. Having entered development in 1977, its long history of extraction has led to a state of advanced maturity, which is now characterized by a natural and structural decline in reserves. In contrast, the Douala/Kribi- Campo (DKC) Basin represents a more contemporary chapter. Its development, beginning in 1997, has established it as a strategic hub, distinguished not by oil but by its substantial natural gas reserves, making it the primary focus for 90% of the country's gas resources. The third member of this trio, the onshore Logone Birni (LB) Basin in the Far North, remains an enigma. Its potential is overshadowed by persistent regional insecurity, which has effectively suspended exploration and left its resources untapped [5].
Confronted with the RDR's decline, a strategic national pivot is underway, shifting focus toward the gas-rich DKC basin. This reorientation is not merely theoretical; it is physically embodied by infrastructures like the Floating Liquefied Natural Gas (FLNG) unit at Kribi, which enables the export and monetization of this critical resource. This strategic shift is part of a coherent, multi- axial national strategy. To bolster domestic energy security, gas is being channeled to fuel new power plants, directly addressing chronic electricity deficits. Concurrently, the government seeks to revitalize exploration through new licensing rounds and is modernizing its legal framework under the revised 2019 Petroleum Code to improve governance and attract investment.
The tangible outcome of this gas pivot is most evident in the performance of the Kribi FLNG unit, officially named the Hilli Episeyo [6]. Operated in partnership with Perenco and the state- owned SNH, this facility began exporting in March 2018 with an initial capacity of 1.2 million tonnes per annum (Mtpa). Through an agreement with partners Perenco and SNH, utilization has been steadily increased toward 1.4 Mtpa in 2022 and up to 1.6 Mtpa from 2023 onward. This operation is critical: it not only provides a crucial revenue stream that offsets losses from the RDR's aging oil fields but also supplies condensates and LPG for domestic consumption, while securing Cameroon's place on the global LNG map [7].

Figure 1: Overview Of The Oil And Gas Domain As Of 12/31/2022 (Source: Snh 2022 Report)
Methodology
Synthesis of SNH Reports from 2015–2022
The synthesis of SNH reports was conducted by aggregating and normalizing raw production, drilling, and reserves data to quantify depletion dynamics. This retrospective approach is justified by its ability to identify structural trends over a multi- year period, reducing biases related to annual fluctuations and optimizing extrapolation for future modeling. Data were extracted from official SNH reports and validated by cross-referencing with USGS databases for similar basins.
National Production Dynamics (2012–2022)
To analyze production, annual variations were calculated as follows:
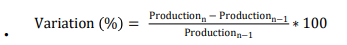
This simple yet robust formula, commonly used in petroleum economics, allows for measuring decline or growth rates, optimizing the detection of peaks (e.g., 2015 for oil) and inflection points (e.g., FLNG launch in 2018 for gas). The choice to include 2012–2014 ensures a pre-peak baseline, avoiding biases from truncated analyses [8-11].
|
Year |
Oil Production (M bbl) |
Crude Variation (%) |
Commercial Gas Production (M scf) |
Gas Variation (%) |
|
2012 |
22.35 |
... |
151.99 |
... |
|
2013 |
24.28 |
+8.63% |
5376.44 |
+3437.49% |
|
2014 |
27.50 |
+13.26% |
10859.55 |
+101.99% |
|
2015 |
34.97 (Peak) |
+27.18% |
13048.20 |
+20.17% |
|
2016 |
33.69 |
−3.67% |
12612.52 |
−3.34% |
|
2017 |
27.726 |
−17.69% |
13886.97 |
+10.10% |
|
2018 |
25.13 |
−9.36% |
51678.62 |
+272.28% (FLNG Startup) |
|
2019 |
25.995 |
+3.43% |
70856.13 |
+37.11% |
|
2020 |
26.556 |
+2.16% |
75243.08 |
+6.19% |
|
2021 |
25.610 |
−3.56% |
78973.25 |
+4.96% |
|
2022 |
24.951 |
−2.58% |
88224.44 |
+11.71% |
Table 1: Evolution of National Hydrocarbon Production (2012–2022)
This method was chosen for its alignment with SPE standards, allowing for international comparison of decline rates [12].
Drilling Activities (2015–2022)
Drilling data were classified by type (development vs. exploration), with the calculation of the average flow rate:
• Average Flow Rate (bopd) = Sum of Flow Rates / Number of Wells Drilled.
This indicator, recommended for assessing unit productivity, optimizes the identification of maturity by quantifying the decreasing efficiency of infill wells.
Exploration/Appraisal Share (%) = (Number of Explo/Appre Wells / Number of Wells Drilled) × 100
It measures the priority given to renewal, a key KPI (Key Performance Indicator) for mature basins [13].
|
Year |
Total Wells Drilled |
Main Activity |
Key Highlight |
Notable Wells |
|
2015 |
6 |
RDR Development |
Completion of major Padouk wells |
PDK-4L (6000 bopd) |
|
2016 |
12 |
RDR Development |
Manatee-1 exploration failure; Start of Logbaba gas drilling |
BJM-004 (3500 bopd) |
|
2017 |
10 |
DKC Gas Development |
Heavy investment in DKC for FLNG (Sanaga South), Decline of RDR |
LA-107 (40−60 mmscf/d); SSA-9 (60 mmscf/d) |
|
2018 |
17 |
RDR Infill Development |
FLNG ramp-up; 13 infill wells in RDR (Kole Marine/Lima) with modest flow rates |
KLM-16ST (1500 bopd); IE-4 (P&A) |
|
2019 |
21 (Peak) |
RDR Infill Development |
Attempted oil rebound; Emergency drilling in RDR |
OCM-001 (4500 bopd); OAK- S1A (4400 bopd) |
|
2020 |
16 (8 completed) |
RDR Infill Development |
Covid-19 slowdown; Completion of 2019/ early 2020 wells |
EKM-061ST (1490 bopd) |
|
2021 |
16 |
RDR Development |
2 failures (P&A) in RDR; 2 Sanaga South gas wells |
EKM-058ST2 (2053 bopd); KB-007/008 (50 mmscfd) |
|
2022 |
22 (Peak) |
RDR Infill Development |
Record activity to compensate for falling reserves/production |
KL-004 (1194 Bcpd); RDR wells mostly modest |
Table 2: Summary of Drilling Activity and Operational Results by Year (2015−2022)
Reserves Evaluation and Sustainability (2015–2022)
The formulas used are:
• Added Reserves (AR) = Reserves_n - Reserves_{n-1} + Production_n
• RRR (%) = (AR / Production_n) × 100
• R/P (years) = Proved Reserves / Production_n
The RRR (Reserve Replacement Ratio) was chosen for its ability to quantify renewal, a critical indicator for mature basins like the RDR, while the R/P (Reserves/Production) ratio assesses temporal sustainability, optimizing depletion projections. The inclusion of 2014 as a baseline ensures calculation continuity [14,15].
|
Year |
Proved Reserves (M bbl) |
Production (M bbl) |
Added Reserves AR (M bbl) |
RRR (%) |
R/P (Years) |
Key Highlight |
|
2014 |
276.97 |
27.50 |
N/A |
N/A |
10.07 |
Reserve baseline for 2015 |
|
2015 |
288.03 |
34.97 |
36.03 |
103.03% |
8.24 |
Production peak. RRR>100% (positive reserve revision) |
|
2016 |
240.96 |
33.69 |
−13.38 |
−39.71% |
7.15 |
Start of RRR crisis (Declassification of 47 M bbl) |
|
2017 |
210.62 |
27.726 |
−2.614 |
−9.43% |
7.61 |
Continued reserve decline |
|
2018 |
196.95 |
25.13 |
−11.40 |
−45.36% |
7.84 |
Worst RRR of the period (Sharp fall in reserves) |
|
2019 |
311.30 |
25.995 |
140.345 |
539.90% |
11.97 |
Artificial rebound (Inclusion of condensates/major re- evaluation) |
|
2020 |
309.97 |
26.556 |
25.226 |
95.00% |
11.67 |
Stabilization (Added Reserves close to Production) |
|
2021 |
284.36 |
25.610 |
0.00 |
0.00% |
11.10 |
RRR at zero (No compensation) |
|
2022 |
259.41 |
24.951 |
0.00 |
0.00% |
10.40 |
RRR at zero (Second consecutive year) |
Table 3: Dynamics of Proved Oil Reserves, Replacement Rate (RRR) and Life Horizon (R/P) (2015−2022)
|
Year |
Resources (TCF) |
Production (TCF) |
Added Reserves (TCF) |
RRR (%) |
R/P (Years) |
Key Highlight |
|
2014 |
5.430 |
0.010860 |
N/A |
N/A |
499.98 |
Reserve baseline for 2015 |
|
2015 |
6.106 |
0.013048 |
0.689 |
5285.9% |
467.91 |
Extremely high RRR (Major reserve re-evaluation) |
|
2016 |
6.064 |
0.012613 |
−0.029 |
−2.30% |
480.77 |
|
|
2017 |
6.050 |
0.013887 |
−0.0007 |
−0.05% |
435.66 |
|
|
2018 |
6.000 |
0.051679 |
0.0017 |
3.25% |
116.11 |
R/P Plunge (FLNG Production Surge) |
|
2019 |
6.430 |
0.070856 |
0.5009 |
707.03% |
90.75 |
RRR Rebound (Major Re- evaluation) |
|
2020 |
6.350 |
0.075243 |
−0.005 |
−6.97% |
84.40 |
|
|
2021 |
6.275 |
0.078973 |
−0.004 |
−4.68% |
79.45 |
|
|
2022 |
6.187 |
0.088224 |
−0.0006 |
−0.72% |
70.13 |
|
Table 4: Dynamics of Proved Gas Reserves, Replacement Rate (RRR) and Life Horizon (R/P) (2015−2022)
Drilling Data Analysis
Drilling indicators were calculated as follows:
• Average Flow Rate (bopd) = Sum of Flow Rates / Number of Wells Drilled
• Exploration/Appraisal Share (%) = (Number of Explo/Appre Wells / Number of Wells Drilled) × 100
These metrics, standard in productivity analysis, were chosen for their ability to quantify efficiency and strategic priority, optimizing the assessment of RDR maturity [16].
Production Data Analysis
For production dynamics, decline/growth rates were calculated as indicated, with the average post-oil-peak rate being the mean of variations from 2016–2018 and 2021–2022 (excluding the rebound). This choice excludes anomalies for a robust estimate of structural decline. Parallel charts optimize the visualization of the oil/gas decoupling.
For the reserves renewal crisis:
• Negative average RRR (2016–2018) = Absolute mean
• R/P Erosion Rate = [(R/P_2018 - R/P_2015) / R/P_2015] × 100
• Uncompensated Production = Sum 2021–2022
This three-step methodology assesses the asset decommissioning speed: first, the Reserve Replacement Ratio (RRR) measures the rate of non-compensation of reserves, particularly significant before the artificial adjustment in 2019. Second, the R/P Ratio Erosion Rate precisely quantifies the loss of the sustainability horizon that preceded the same rebound. Finally, calculating the total amount of oil extracted from reserves without being replaced during the critical years (2021−2022) certifies the structural depletion of the asset [17].
For gas dynamics:
• R/P plunge = [(R/P_2022 - R/P_2017) / R/P_2017] × 100
• Contribution to RRR (2019) = Gas RRR / Oil RRR
The analysis of gas dynamics is performed in two complementary steps to measure the strategic transition of the sector, a choice optimized for measuring the impact of a major project. First, the Gas Production Curve (M scf) with FLNG Annotation serves to highlight the dependence of exponential gas growth on a single project (Hilli Episeyo) started in 2018. Second, the Gas R/P Curve (Years) allows visualization of the direct impact of this new production on the resource's sustainability horizon [18].
Results & Discussion
Analysis of Drilling Data

Figure 2: Curve of Total Wells Drilled Per Year (2015-2022)
This curve highlights the scale of investment required to sustain production levels. The intensive drilling campaigns conducted in 2019 (21 wells) and 2022 (22 wells) reveal a corrective strategy in maturing fields, where increasing the number of wells struggles to compensate for the natural decline of the reservoirs.

Figure 3: Activity Concentration Diagram
This diagram demonstrates the strategic focus. The massive share of Development (or infill) wells confirms that activity is primarily concentrated on maintaining existing reservoirs.

Figure 4: Average Flow Rate per Well (bopd) Curve
Its purpose is to measure the unit return on investment and demonstrate the declining quality of the targeted reservoirs. Despite increased effort, the average flow rate post-2018 remains stagnant at a low level (300–700 bopd), proving that the new infill zones are structurally less productive.

Figure 5: Exploration/Appraisal Share (%) Curve
The low percentages (10–18% after 2018) signal a neglect of oil Exploration in favor of gas and short-term maintenance. The location of drilling relative to the basins allows for their classification according to their lifecycle.
|
Analysis/Detailed Information |
Role and Finding (Based on your data) |
Supporting Example |
|
Identification of Mature Basin (Rio Del Rey - RDR) |
The majority of drilling is concentrated in one area (the RDR) and is primarily of the Development/Infill type. This maintenance drilling indicates advanced maturity and structural decline of existing fields |
The drilling peaks in 2019 (21 wells) and 2022 (22 wells) are Infill efforts in the RDR to compensate for decline, not to discover new reserves |
|
Identification of Emerging Basin (Douala Kribi Campo - DKC) |
The low number of wells, but those focused on Exploration/Appraisal, indicates a basin in the de-risking or early development phase. The DKC is the home of gas |
The SSA wells (2017) and activity associated with the FLNG illustrate a concentration of effort on gas resources in a basin less explored for oil |
|
Missed Discoveries and Dead Zones |
Exploration failures in certain concessions, despite drilling, signal dead zones or high geological risk, which will be avoided by future oil investors |
The Manatee-1 (2016) exploration failure or P&A (Plug & Abandon) wells like IE-4 (2018) reveal geographical sectors where the exploration risk is too high |
Table 5: Characterization of Oil and Gas Basins by Drilling Activity (2015–2022)
|
Reservoir Classification (Based on Initial Flow Rate) |
In-Situ Characterization and Justification |
Key Strategic Implication |
|
Class I: Very High Flow Rate (≥2000 bbl/d) |
High-quality reservoir (Sweet Spots). Represents the best sands or less depleted compartments |
Benchmark of quality/maximum potential. These zones are largely depleted post-2019, justifying the urgency of EOR intervention |
|
Class II: Medium Flow Rate (300 to 1500 bbl/d) |
Medium quality and mature reservoir. Typical rate for Infill drilling in the RDR. Production often depends on Stimulations (fracturing) |
Decline in Drilling Efficiency. The Average Flow Rate dropped to 341 bopd in 2022, proving that maintenance efforts no longer compensate for permeability degradation |
|
Class III: Very Low Flow Rate (<<100 bbl/d) |
Poor quality or highly depleted reservoir. Indicator of very low permeability or risk of Water Breakthrough |
High Operational Risk. These wells are often abandoned, signaling the imminent depletion of certain peripheral areas of the field |
|
Gas Characterization (M scf) |
Gas/Oil Separation. Location of gas- dominated (DKC) versus oil-dominated (RDR) reservoirs |
Strategic Shift. The flow rate in M scf (SSA-9, FLNG) confirms that the future of the DKC basin is centered on gas sustainability |
|
Classification |
Flow Rate Trend |
Estimated Porosity (Φ) |
Estimated Permeability (K) |
Inferred Reservoir Characteristics |
Supplementary (Production Factor) |
|
I. High Performance |
≥2500 bbl/d or ≥40 mmscf/d |
≈25% to 35% |
Very High (Hundreds of mD to D) |
Very clean Pleistocene or Miocene sands. Strong connectivity |
Natural drainage = fewer wells |
|
II. Good Performance |
1000 to 2500 bbl/d |
≈20% to 28% |
High (Tens to Hundreds of mD) |
Good quality Rio Del Rey sands. Primary reservoirs |
Pressure monitoring = sustainable profitability |
|
III. Moderate Performance |
300 to 1000 bbl/d |
≈15% to 22% |
Moderate (Low Tens of mD) |
Finer sands, or Heavily Exploited (Mature). Rates limited by reduced permeability or pressure |
Artificial lift = high OPEX |
|
IV. Low Performance / Depleted |
<<100 bbl/d or Non-Productive |
Low (<15%) |
Very Low (<<1 mD or <<10 mD) |
Cemented, clayey, or Highly Depleted reservoirs. BKM-102 is a case of "reservoir degradation" |
Infill drilling = profitability not guaranteed |
Table 7: Reservoir Classification by Performance and Estimated Petrophysical Properties
|
Indicator |
Calculation |
Result |
Analytical Commentary |
|
Average Post-Peak Oil Decline Rate (2016–2022) |
Mean (−3.67;−17.69;−9.36;−3.56;−2.58) Excluding 2019−2020 as technical rebound |
−7.37% |
Structural decline = accelerated depletion of the RDR |
|
Gas Growth Rate (2017–2018) |
+272.28% (FLNG Startup) |
+272.28% |
The FLNG project (Hilli Episeyo) is the sole driver of the gas transition |
Table 8: Production Dynamics (Oil vs. Gas)
This juxtaposition confirms the RDR basin's irreversible structural decline in oil production, while simultaneously highlighting the pivotal role of major gas infrastructure in redefining the national energy portfolio.

Figure 6: Oil Decline and Gas Growth
The graph clearly shows the Oil Peak in 2015 followed by a structural decline (negative average rate), contrasting with the quantum leap in gas in 2018 (+272.28% variation).

Figure 7: Gas Contribution to Total Energy mix
The contribution of gas to total energy produced has skyrocketed since 2018, highlighting the country's de facto energy transition
|
Indicator |
Calculation |
Result |
Analytical Commentary |
|
Average Negative RRR (2016–2018) |
Absolute Mean of 2016–2018 (39.71; 9.43; 45.36) |
-31.50% |
Exploration crisis: 30% of production not compensated before 2019 |
|
Oil R/P Erosion Rate (2015–2018) |
(7.84 - 8.24) / 8.24 × 100 |
-4.85% |
Sustainability decreased by 5% before the artificial addition of condensates in 2019, confirming the degradation of the oil asset |
|
Uncompensated Production (2021–2022) |
25.610 + 24.951 (M bbl) (Since AR=0 for 2021–2022) |
50.561 M bbl |
Two years of lost production (RRR = 0%), due to a lack of profitable discoveries |
Table 9: Oil Renewal Crisis
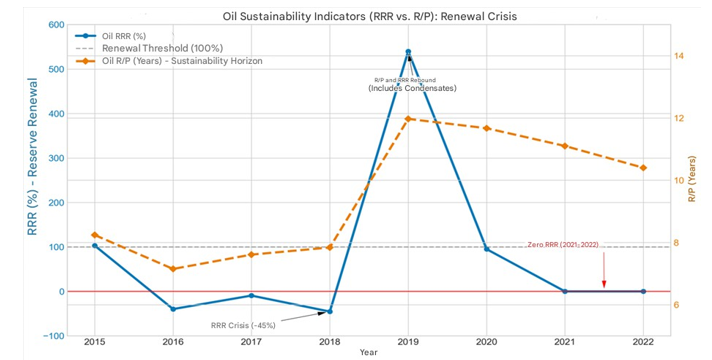
Figure 8: Oil RRR and Oil R/P Curve
This combined graph reveals that the Cameroonian oil industry has been in a structural renewal crisis since 2015, temporarily masked by accounting adjustments.
• Immediate Negative Correlation: Periods of negative RRR (2016−2018) correspond to the erosion of the R/P horizon (which drops from 8.24 to 7.84 years). The lack of exploration reduces sustainability.
• The 2019 (Artificial) Effect: The spectacular RRR of 539.90% in 2019 causes an immediate jump in the R/P to nearly 12 years. This illustrates how major re-evaluations (inclusion of condensates) mask the real renewal crisis.
• Post-2019 Crisis: The R/P begins to decline again after 2019, despite the rebound, because the RRR falls back to 0% in 2021−2022. This confirms that the oil stock continues to be consumed without being renewed.

Figure 9: Combined Gas RRR and Gas R/P Diagram
Analysis of the Combined Gas RRR and Gas R/P Chart reveals the following key points:
• Trigger for Exploitation: The major event is the massive drop in Gas R/P in 2018 (from 435 to 116 years). This plunge is the direct consequence of the FLNG production surge and marks the transition from a dormant reserve to a consumed asset.
• Extreme RRR Volatility: The RRR is either very high (re- evaluation of existing resources) or close to 0% or negative (production without adding new discoveries). The volatility of the RRR is less concerning than for oil, as the R/P horizon remains above 70 years, indicating a very comfortable long- term sustainability.
• Gas Strategy: After 2019, the low RRR suggests the operator is focusing on exploiting already proven reserves rather than drilling for new (costly) gas discoveries.

Figure 10: Combined Gas R/P and Gas Production Curve with FLNG Startup Impact
The commissioning of the Hilli Episeyo FLNG unit in 2018 redefined the dynamics of Cameroon's gas sector along two fundamental axes:
• The transformation of the reserve profile materialized through a significant adjustment of the gas R/P ratio. Although maintained at a comfortable horizon exceeding seventy years, this post-2018 recalibration attests to a strategic transition: gas has shifted from being a strategic reserve to a fully integrated asset within the production portfolio.
• Concurrently, the production architecture underwent a major reconfiguration. The exponential growth recorded since 2018 reveals a near-exclusive dependence on the Hilli Episeyo project. This project has progressively established the DKC basin as the main driver of national hydrocarbon growth, concentrating the majority of investments and sectoral development prospects.

Figure 11: Combined Oil RRR and Gas RRR Curve
Synthesis of Drilling and Production Data
The Rio Del Rey basin now exhibits the characteristic signs of advanced maturity, where reservoir degradation is reflected in a significant drop in flow rates. These rates fell from 4,500 barrels per day in 2019 in the last areas of optimal productivity to just 341 barrels per day in 2022. This erosion of unit productivity forces operators to multiply drilling campaigns (22 wells in 2022) and resort heavily to artificial stimulation techniques, mechanically increasing operational costs and reducing the marginal profitability of projects. Faced with this structural decline in oil production and the simultaneous emergence of exponential gas growth, the basin is undergoing a fundamental energy transition. The very nature of the remaining resources - predominantly gas in the Douala/Kribi- Campo basin or in the form of heavy oils - mandates a strategic reorientation towards liquefied natural gas and enhanced recovery methods. This evolution proves essential to preserving the long- term economic viability of the national hydrocarbon industry.
The current reliance on infill drilling for maintenance is unsustainable, serving only to delay (not prevent) the basin's structural decline. Recent initiatives, however, signal a shift towards revitalization. Cameroon's 2025 licensing round for nine blocks and Tower Resources' planned NJOM-3 appraisal well in 2025 represent critical steps to reinvigorate exploration.

Figure 12: Strategic Correlation between Exploration and Oil Sustainability
Conclusions
The Rio Del Rey Basin is undergoing a structural decline, marked by a zero oil Reserve Replacement Ratio (RRR) and consistently deteriorating well productivity. In response to this well-documented crisis, authorities and operators have initiated measures such as a new nine-block licensing round, the extension of Perenco's operating contract, and targeted drilling campaigns like the NJOM-3 well. While these actions demonstrate a commitment to revitalizing exploration, the current strategy remains overly reliant on conventional methods and marginal field development, failing to implement Enhanced Oil Recovery (EOR) at the necessary scale. A decisive strategic reorientation is therefore imperative, one that integrates an ambitious EOR program, builds on ongoing exploration projects, and ultimately considers repurposing existing infrastructure for COâ?? storage. This integrated pathway represents the most viable approach to maximizing the basin's residual value and ensuring a sustainable energy transition for Cameroon.
Funding
The authors declare that no external funding was received for the preparation of this manuscript.
Data Availability
The data that support the findings of this study are available from the corresponding author upon reasonable request.
Conflicts of Interest
The corresponding author, on behalf of all authors, declares no conflicts of interest.
References
- Ecofin Agency. (2025, October 14). Cameroon increases transparency to restore confidence of oil and gas investors.
- Daily Oil Futures. (2024, April 23). Cameroon's oil output to drop in 2025.
- Business in Cameroon. (2024, July 3). Cameroon's 2024 oil revenue target may be out of reach
- CEMAC ECO Finance. (2024). Cameroon records drop in oil and gas revenue.
- Domra Kana, J., Diab Ahmad, A., Gouet, D. H., Djimhoudouel, X., & Koah Na Lebogo, S. P. (2021). Sandstone reservoir characteristics of Rio Del Rey basin, Cameroon, using well- logging analysis. Journal of Petroleum Exploration and Production Technology, 11(6), 2621-2633.
- Isakov, M., Gabrielli, P., Nformi, E., & Culwick, S. (2023). Seismic Foldout: Cameroon: Douala Kribi-Campo Basin– Seize the opportunity
- République du Cameroun. (2019). *Loi N°2019/008 du 25 avril 2019 portant Code pétrolier* [PDF].
- Enerdata. (2022, July 28). Perenco and SNH agree to increase LNG output from Hilli Episeyo (Cameroon).
- Société Nationale des Hydrocarbures (SNH). (2022). Rapport annuel 2022: Stability. SNH Cameroun.
- DataCameroon. (2024, August 16). Pétrole brut : la production nationale de plus en plus faible.
- U.S. Geological Survey (USGS). (2024). World oil and gas resource assessments. Central Energy Resources Science Center.
- USGS Energy Resources Program. (2024). United States assessments of undiscovered oil and gas resources
- Pennsylvania State University. (n.d.). Field and well performance with Arps decline curves. PNG 301: Introduction to Petroleum and Natural Gas Engineering.
- Fekkane, A., & Tiab, D. (2001, May). Application of decline- curve analysis technique in oil reservoir using a universal fitting equation. In SPE Permian Basin Oil and Gas Recovery Conference (pp. SPE-70036). SPE.
- Ahmed, T. (2018). Reservoir engineering handbook. Gulf professional publishing.
- Salacz, D., Allam, F., Mubarak Al Araimi, W., & Al Mansoori, Y. (2021, September). Forecasting Reserves Replacement Ratio RRR: A Method for Benchmarking the Ability of the Company to Mature Projects and Reduce Uncertainty. In SPE Annual Technical Conference and Exhibition? (p. D011S007R001). SPE.
- Haneef, J., & Sheraz, A. (2023). A comparative analysis of well key performance indicators (KPIs) with well complexities using well complexity calculator. Arabian Journal for Science and Engineering, 48(7), 9339-9356.
- Société Nationale des Hydrocarbures (SNH). (n.d.). Sedimentary basins.