
International Journal of Women's Health Care(IJWHC)
ISSN: 2573-9506 | DOI: 10.33140/IJWHC
Impact Factor: 1.011

Research Article - (2020) Volume 5, Issue 1
Prevalence of HIV Sero-discordance among Couples in Sub Saharan Africa, 2019, Systematic Review and Meta Analysis
Received Date: Jan 25, 2020 / Accepted Date: Feb 10, 2020 / Published Date: Feb 20, 2020
Copyright: ©Mihretie Gedfew. This is an open-access article distributed under the terms of the Creative Commons Attribution License, which permits unrestricted use, distribution, and reproduction in any medium, provided the original author and source are credited.
Abstract
Background: HIV/AIDS ranks among the world’s most devastating diseases because it spreads rapidly through sexual intercourse (90-95%) and mainly affects young people in their most productive years especially discordant couples are at continuous risk for acquiring the infection. But many individuals are unaware of their partner’s and their own Sero status. So this Meta-analysis aimed to assess the prevalence of HIV Sero discordance among adult discordant couples in Sub Saharan Africa, 2019.
Methods: published and unpublished studies were searched systematically using electronic databases such as Google scholars, Medline, hennery, Scopes and Pub Med. All observational studies, which were assessing and reporting the prevalence of HIV sero discordance were identified and included in analysis. Investigators using a data extraction tool did data extraction. STATA statistical software version 14 was used for data analysis. The I2 test was used to evaluate study heterogeneity, the random effect model was used to estimate the pooled association, and the Egger test was used to check for publishing bias.
Results: Ten studies met the inclusion criteria and were included in the Meta - analysis. The findings of these 10 studies revealed that there was 23.77 (95 percent CI: 10.48, 37.09) pooled prevalence of sero discordance. The highest prevalence of HIV sero discordance was found in Uganda and SSA OR: 49.2 (95% CI = (47, 50.9) and OR: 43 (95% CI = (41, 45) respectively.
Conclusion: In this Meta-analysis the pooled prevalence of HIV sero discordant was high in Africa.
Keywords
Discordance Couples, HIV, Prevalence, Systematic review and Meta-analysis
Abbreviations
AOR - Adjusted Odd Ratio
CI - Confidence Interval
HIV - Human immune deficient virus
HSV - Hepatitis virus
OR - Odd Ratio
Background
HIV / AIDS is one of the most devastating diseases in the world because it is spreading rapidly and affecting young people in their most productive years. Although significant progress has been made in the scale-up of HIV treatment in low and middle income countries, particularly in sub-Saharan Africa, around 2 million people worldwide acquire HIV infection and in 2017 around 24 million people are living with HIV / AIDS including discordant couples [1-3].
Particularly couples where one person is living with HIV and the other is HIV-negative, the HIV-negative partner is at continuous risk of infection (10% annual risk). But many people in stable relationships do not know the HIV status of their partner, and many people with a HIV - positive partner do not know their own status. Only 40% of HIV-positive individuals worldwide know their outcome and approximately 50% of people living with HIV in relationships are estimated to be part of discordant couples, but such discordant couples’ needs in the world are not readily available. This could contribute to the high incidence of Sero conversion [4-7].
According to UNAIDS, 2016 after HIV was discovered nearly three decades ago, it infected at least 60 million people and in some parts of the world was considered the leading cause of death [8]. According to the World Bank 2013 report about 2.5 million people were newly infected with HIV and about 1.5 million of them died of HIV-related causes in 2011. Nowadays, it is still a major global public health issue. Approximately 940 000 people worldwide died of HIV-related complications in 2017 and approximately 37 million people were living with HIV at the end of 2017 with 1,8 million newly infected people in 2017, including sero-discordant people [9-12]. The WHO reports that till the end of 2016 more than 70 million people worldwide have been infected with HIV/AIDS of whom 35 million have died of HIV/AIDS and related complications. In 2017 there were 722,248 people living with HIV and about 22,827 people were newly infected and there were 14,872 deaths during 2017. Africa is the most affected region, in which about 25.7 million people living with HIV in 2017. Recently, Sub-Saharan Africa accounted for 68 percent of all new infections and nearly 50% of all deaths globally occurred in Southern Africa and in areas where HIV/AIDS epidemic is predominant majority of HIV infections occur among heterosexual couples [13-16].
In Africa the magnitude of Sero discordant individuals was high (16%) and among Sero-discordant couples found a high rate of mortality attributable to HIV infection (it ranges from 1.8% in South East to 5.5% in South Nigeria) [16-21]. This may related with the poor knowledge of sero- discordance towards the risk behavior in Africa. About 30% of married HIV positives have negative spouse(sero-discordant) and those HIV-discordant couples are at 10% annual risk of acquiring HIV infection and large number of new HIV infections occur in stable partnerships [22].
The Ethiopian demographic health survey (EDHS) 2016 report indicates that even if the magnitude of HIV decreases from 2011 to 2016 the burden of the disease is still high throughout Ethiopia. Regionally, HIV prevalence is higher in Gambelia (4.8%), Addis Ababa (3.4%), Dire Dawa (2.5%), and Harari (2.4%) than other regions. The HIV Sero-negative partners of people with HIV are at greatest risk of contracting HIV through sexual transmission. About 60% of new HIV infections occur in HIV Sero-discordant couples [23-25]. HIV Sero discordance have long recognized but underappreciated, so this study was aimed to determine the prevalence of sero-discordance couples in sub Saharan Africa.
Methods
The review was planned and reported in accordance with the Meta-analysis of Observational Studies in Epidemiology (MOOSE) guidelines and the control group was those HIV negative concordant couples.
Search Strategy
A systematic review of peer-reviewed literature was undertaken to identify studies that estimated the prevalence of HIV discordance in sub Saharan Africa. The study was conducted by literature search of PubMed, hennery and Google scholar and these databases upto January 2019 for studies describing the prevalence of HIV Sero-discordances among couples. No limitation on the study design or the nature of the control group, which could consist of HIV negative concordant couples or the general population. In addition, the reference lists of retrieved articles to identify any studies that had not been identified by the preliminary literature searches were reviewed. Only articles published in the English language were considered.
Inclusion Criteria
This analysis included studies assessing the prevalence of Sero discordance in SSA: Included studies were those that obtained ethical approval and were undertaken in high HIV burden countries (SSA countries) and/or reported the prevalence of HIV sero-discordance among HIV-discordance couples, peer-reviewed studies with cross-sectional survey, case-control, cohort study designs, and those studies that involved primary outcome(s) of interest (prevalence) were included. If the study populations were reported more than once, the study with the longest follow-up time was included. Published, unpublished, and written with only in English language were included.
Exclusion Criteria
Studies that conducted on couples who were not in stable relationships, studies not including couples with sero discordant HIV status, unpublished data of any form including conference proceedings, case reports, dissertations, studies with unclear titles, lack of abstracts, publications reporting duplicate data from the same population were excluded.
Data Extraction
Two reviewers (Mihretie Gedfew and Melaku Desta) independently screened the titles and abstracts of identified studies and assessed the full text of potentially eligible studies. Any controversy was resolved by consensus. We made some efforts to communicate the authors whenever further information was needed. Data from the included studies were extracted independently by these reviewers. Data were described and analyzed according to the nature of outcomes being assessed which is prevalence. Data on authors, study year, region of study, study design and sample size, risk estimates and corresponding 95% CI and covariates adjusted in the statistical analysis. were extracted using Microsoft excel. The overall prevalence of discordance was also extracted from each included study.
Study Sources
• Google scholars
• Medline
• hennery
• Pub Med
Quality Assessment
Quality assessments were performed independently by the investigators (Mihretie Gedfew and Melaku Desta) using the systematic articles were assessed for quality score using Newcastle-Ottawa Scale adapted for cross-sectional studies quality assessment tool, with a score of ≥5 out of 10 considered as high quality score. The reviewers compared quality appraisal scores and resolved any disagreements before calculating the final appraisal score. All included studies were of high quality score.
Statistical Analysis
The data were pooled multivariable adjusted risk estimates where such estimates were reported. If adjusted analysis was unavailable, unadjusted estimate was pooled. The ORs were considered as a common measure of the association between prevalence of HIV Sero discordance and the countries in which the individual studies were conducted, and both hazard ratio (HRs) and relative risks (RRs) were considered equivalent to ORs, because the ORs and RRs provide similar estimates of risk when the outcome is rare.
One study consisting of two separate cohorts was considered as two independent studies.
When appropriate, a fixed-effects model or random-effects model was used. The ORs were pooled using the fixed-effects model if no heterogeneity was detected, or the random-effects model was used otherwise, and the weights were equal to the inverse variance of each study’s effect estimation.
Subgroup analyzes and sensitivity analyzes were conducted to investigate potential heterogeneity across studies, and Meta-analysis (using STATA ‘metareg’ command) tested the differences between subgroups. Priori hypotheses were formed to explore interactions between subgroups to explain inconsistency between studies in the direction and magnitude of associations. The Altman and Bland method was used to test the subgroup effect hypotheses that involve an interaction test with a 0.05 predetermined two-tailed α. For each study, a leave-one-out analysis was performed to examine the magnitude of influence on pooled ORs of each study. With visual inspection of the funnel plot, Begg correlation test and Egger linear regression test, potential publishing bias was evaluated. The nonparametric trim-and-fill method used by Duval and Tweedie has been used to adjust potential publishing bias. With STATA 14, all statistical analyzes were conducted and all tests were two-sided with a meaning level of 0.05.
Results
Study Selection About 61 published articles and 1 unpublished study were found in the review. Then we removed 17 duplicate records and excluded 27 records by title and abstract after screening. A total of 18 full-text articles were screened for eligibility. Finally, 10 articles were selected for systematic review and meta-analysis and the rest 8 articles were excluded by eligibility criteria
Characteristics of Included Studies
Six cross-sectional studies, two cohort studies, one case control study and one clinical trial were included in this review [16,24-30]. All the articles included were published studies and the sample size ranged from a minimum of 154 studies conducted in Ethiopia to a maximum of 2589 studies conducted in sub-Saharan Africa [24,30]. The final review included a total of 16,296 participants. The studies were carried out in different countries in Africa between 2003 and 2015. Three studies have been conducted in Ethiopia from selected articles three studies in South Africa, two studies in Uganda, three studies in Nigeria, Tanzania and SSA, one in each country [16,18,24-30] (Figure 1).
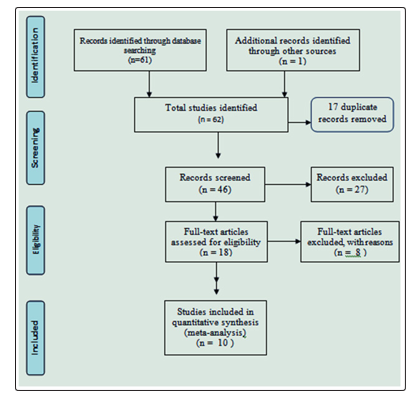
Figure 1: Flow diagram of the studies included in the meta-analysis of the prevalence of HIV sero- discordance among couples in sub Saharan Africa, 2019
One of the studies included using simple random sampling techniques, three of them using consecutive sampling techniques, and the remaining studies did not indicate their sampling techniques. The maximum and minimum response rate was approximately 100% and 95%, while the response rate was not specified in six studies (Table 1).
Table 1: Summary of Included Studies regarding prevalence of HIV sero-discordance among couples in sub Saharan Africa, 2019
|
Author |
year of publication |
country |
study design |
study population (residence) |
duration follow-up |
sample size |
cases |
response rate |
pr |
CI |
|
Ermias Habte, MD |
2015 |
Ethiopia |
case–control |
|
|
398 |
199 |
100% |
.084 |
95% |
|
Girma Temam |
2012 |
Ethiopia |
cross-sectional |
VCT clients |
|
396 |
26 |
99% |
.065 |
95% |
|
Moges Tadesse |
2014 |
Ethiopia |
cross sectional |
VCT clients |
|
154 |
9 |
99% |
.03 |
95% |
|
Willy A. Were |
2006 |
Uganda |
cross sectional |
VCT clients |
|
2373 |
1021 |
99% |
.43 |
95% |
|
Mark N. Lurie |
2003 |
South Africa |
cross-sectional |
couples |
|
168 |
35 |
100% |
.21 |
95% |
|
Jairam R |
2008 |
SSA |
clinical trial |
couples |
2007-2008 |
2589 |
1269 |
100% |
.49 |
95% |
|
Samuel Biraro |
1013 |
Uganda |
Cohort |
couples |
1989 -2007 |
2465 |
9 |
100% |
.105 |
95% |
|
Innocent AO Ujah |
2015 |
Nigeria |
Cohort |
couples |
2004-2013 |
4435 |
1379 |
100% |
.668 |
95% |
|
David Paul Ngilangwa,1,2 |
2015 |
northern Tanzania |
cross-sectional |
couples |
|
1,333 |
220 |
100% |
.16 |
95% |
|
William Kilembe |
2015 |
South Africa |
cross- sectional |
couples |
|
|
|
|
|
|
|
|
|
1,814 |
268 |
95% |
.295 |
95% |
|
|
|
|
TThe final pooled Meta-analysis showed a statistically significant prevalence of HIV sero-discordance with a p-value of 0.001 (Figure 2).
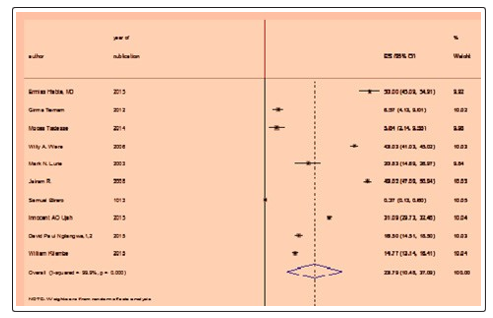
Figure 2: The final pooled meta-analysis showed that the prevalence of HIV Sero-discordance is statistically significant with a p-value of 0.001
Publication Bias
Funnel plot asymmetry has been used to check for publishing bias. The result of the funnel plot showed that the distribution of articles was high asymmetrical. To confirm this asymmetry, the tests conducted by Egger and Begg were used to check for publishing bias (Table 2).
Table 2: PRISMA-P (Preferred Reporting Items for Systematic review and Meta-Analysis Protocols) 2015checklist: recommended items to address in a systematic review protocol*
|
Section and topic |
Item No |
Checklist item |
Page number |
|
ADMINISTRATIVE INFORMATION |
|||
|
Title: |
|
|
|
|
Identification |
1a |
Identify the report as a protocol of a systematic review |
Page I |
|
Update |
1b |
If the protocol is for an update of a previous systematic review, identify as such |
Not applicable |
|
Registration |
2 |
If registered, provide the name of the registry (such as PROSPERO) and registration number |
Not applicable |
|
Authors: |
|
|
|
|
Contact |
3a |
Provide name, institutional affiliation, e-mail address of all protocol authors; provide physical mailing address of corresponding author |
Page 1 |
|
Contributions |
3b |
Describe contributions of protocol authors and identify the guarantor of the review |
Page 11 |
|
Amendments |
4 |
If the protocol represents an amendment of a previously completed or published protocol, identify as such and list changes; otherwise, state plan for documenting important protocol amendments |
Not Applicable |
|
Support: |
|
|
|
|
Sources |
5a |
Indicate sources of financial or other support for the review |
Not Applicable |
|
Sponsor |
5b |
Provide name for the review funder and/or sponsor |
Not Applicable |
|
Role of sponsor or funder |
5c |
Describe roles of funder(s), sponsor(s), and/or institution(s), if any, in developing the protocol |
Not Applicable |
|
INTRODUCTION |
|
|
|
|
Rationale |
6 |
Describe the rationale for the review in the context of what is already known |
Page 4 |
|
Objectives |
7 |
Provide an explicit statement of the question(s) the review will address with reference to participants, interventions, comparators, and outcomes (PICO/ PECO) |
Page 3, 4 &5 |
|
METHODS |
|
|
|
|
Eligibility criteria |
8 |
Specify the study characteristics (such as PICO, study design, setting, time frame) and report characteristics (such as years considered, language, publication status) to be used as criteria for eligibility for the review |
Page 4&5 |
|
Information sources |
9 |
Describe all intended information sources (such as electronic databases, contact with study authors, trial registers or other grey literature sources) with planned dates of coverage |
Page 5 |
|
Search strategy |
10 |
Present draft of search strategy to be used for at least one electronic database, including planned limits, such that it could be repeated |
Not applicable |
|
Study records: |
|
|
|
|
Data management |
11a |
Describe the mechanism(s) that will be used to manage records and data throughout the review |
Page 4-6 |
|
Selection process |
11b |
State the process that will be used for selecting studies (such as two independent reviewers) through each phase of the review (that is, screening, eligibility and inclusion in meta-analysis) |
Page 5 |
|
Data collection process |
11c |
Describe planned method of extracting data from reports (such as piloting forms, done independently, in duplicate), any processes for obtaining and confirming data from investigators |
Page 7 |
|
Data items |
12 |
List and define all variables for which data will be sought (such as PICO items, funding sources), any pre-planned data assumptions and simplifications |
Page 10 |
|
Outcomes and prioritization |
13 |
List and define all outcomes for which data will be sought, including prioritization of main and additional outcomes, with rationale |
Page 4 |
|
Risk of bias in individual studies |
14 |
Describe anticipated methods for assessing risk of bias of individual studies, including whether this will be done at the outcome or study level, or both; state how this information will be used in data synthesis |
Page 6 |
|
Data synthesis |
15a |
Describe criteria under which study data will be quantitatively synthesized |
Page 6 & 7 |
|
|
15b |
If data are appropriate for quantitative synthesis, describe planned summary measures, methods of handling data and methods of combining data from studies, including any planned exploration of consistency (such as I2, Kendall’s τ) |
Page 6 & 7 |
|
|
15c |
Describe any proposed additional analyses (such as sensitivity or subgroup analyses, meta-regression) |
Page 7 & 8 |
|
|
15d |
If quantitative synthesis is not appropriate, describe the type of summary planned |
|
|
Meta-bias(es) |
16 |
Specify any planned assessment of meta-bias(es) (such as publication bias across studies, selective reporting within studies) |
Page 7 |
|
Confidence in cumulative evidence |
17 |
Describe how the strength of the body of evidence will be assessed (such as GRADE) |
Page 9 |
*It is strongly recommended that this checklist be read in conjunction with the PRISMA-P Explanation and Elaboration (cite when available) for important clarification on the items. Amendments to a review protocol should be tracked and dated. The copyright for PRISMA-P (including checklist) is held by the PRISMA-P Group and is distributed under a Creative Commons Attribution Licence 4.0.
Egger’s and Begg’s results showed that there was no statistically significant bias in publishing (p=0.423) (Figure 3).
Figur 3: Funnel plot with 95% confidence limit of the pooled meta-analysis of the prevalence of HIV sero discordance, 2019
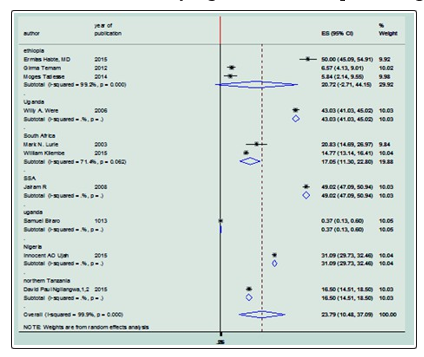
Subgroup Analysis In this Meta-analysis, Meta-analysis subgroup was evaluated based on the country of study. The Meta-analysis of the Subgroup showed that the prevalence of HIV discordance was not associated with the country of the study in Ethiopia. OR: 20.72 (95% CI = -2.71,44.15) but the prevalence of HIV discordance was associated with the country in which the study was conducted like, Uganda OR: 43 (95% CI = 41,45), South Africa OR: 18 (95% CI=13.25,22.84), sub-Saharan Africa OR: 49 (95% CI=47,50.9), Nigeria OR: 31 (CI=29.73,32.46),Tanzania OR: 16.5(CI=14.5,18.5) respectively [16,18,26-28,32,]. The lowest association OR: 16.5 (CI= 14.5,18.5) was observed in Tanzania (Figure 4).
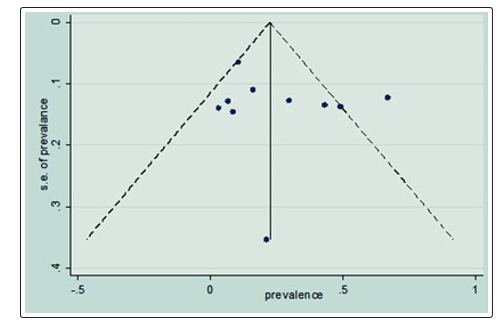
Figure 4: Sub-group analysis of the pooled meta-analysis of the prevalence of HIV Sero- discordance with the countries that the individual study conducted, 2019.
Discussion
The present Meta-analysis was carried out to determine the prevalence of HIV discordance in high HIV burden African countries. Existing evidence based on data from 10 included studies with 16296 participants in the study showed a 23.52% point prevalence of HIV discordance in African countries (CI=10.88,36.16). For the lowest and highest prevalence respectively in the sub-group analysis bay countries, the researchers observed significantly higher variation in the prevalence of discordance across different African countries 16.5% in northern Tanzania and 49% in SSA.
The result of this finding was greater than the studies conducted in Ethiopia ( 6.5% in Addis Ababa, 3% in Dilla, 8.4% in Jimma in the southern Ethiopia), 16% in northern Tanzania and 10.5 in Uganda [16,24,25,29,31]. This discrepancy might be due to the difference in the study population as those studies were conducted on the public VCT centers in which only volunteers were recruited. Including only volunteers groups might be under estimate the prevalence of Sero discordance since most of the participants might have good awareness about the HIV/AIDS, its ways of transmission and self-care behaviors for HIV. As a result, the result of this systematic review might be low. The other possible justification might be because of the study design difference in Jimma, Dilla (Cross-sectional study design), Addis Ababa (case control study design), Uganda (cohort study design) and Tanzania (Cross-sectional study design was used) this may under-estimate the result of the study in those countries (Ethiopia, Tanzania and Uganda). These variations in prevalence also might be due to the, sample size, sampling models, socio-demographic and lifestyle, and knowledge difference of Sero discordance towards the risk behavior in Africa in the those countries across the reviewed articles. As a result of having poor knowledge towards the risk behaviors HIV transmission the negative spouse will have a high chance to acquire the virus and the couples become sero concordant instead of staying HIV discordance.
To the contrary this study finding was less than the studies in Africa on the Regional Differences in Prevalence of HIV-1 Discordance in Africa and Enrollment of HIV-1 Discordant Couples into an HIV-1 Prevention Trial which is 49% , south Africa which is 29.5% and southwest Nigeria which is 66.8% on discordance and associated factors and Uganda [18,28,30,32]. This discrepancy might be due to the difference in the study population in which the Partners with HSV-2 was designed to assess the impact of HSV2 suppression with acyclovir (400 milligrams orally, twice daily) in the treatment group and with placebo in the control groups in the study in African regions. As a result of this HSV co infection management in the treatment group might be reduced the transmission of HIV from positive to negative couples and the prevalence of being sero discordant might be increased, so this may over-estimate the result of those studies.
The other possible justification might be the difference in the study design (clinical trial was used in those studies above). Similarly the other possible justification for the study in southwest Nigeria and south Africa might be because of the study population difference (only pregnant mothers were recruited in Nigeria and couples in south Africa) and the study design difference (cohort study design was used). On the other hand this study was in line with the cross-sectional stud in South Africa which is 21% [26].
Conclusion
In this study, the overall prevalence of HIV Sero discordance was varying among different African countries and the pooled result (prevalence) was high in magnitude.
Limitations
The inclusion of studies published only in English may compromise representativeness (language bias). Incapability to reliable differentiate between HIV-I and HIV -II as well because of variability across each country we did not explore factors affecting the prevalence of HIV Discordance.
Acknowledgements
Mihretie Gedfew and Melaku Desta conceived and designed the study, performed analysis and interpretation of data. Belayneh Mengist and Hailie Amaha advised and supervised the design conception, analysis, interpretation of data and made critical comments at each step of research. Dessalegn Hailie and Bekalu Bewket drafted the manuscript. All authors read and approved the final Manuscript.
References
- WHO, Global tuberculosis control: WHO report 2010. 2010: World Health Organization.
- Sidibé M, L Loures, B Samb (2016) The UNAIDS 90–90–90 target: a clear choice for ending AIDS and for sustainable health and development. Journal of the International AIDS Society 19: 21133.
- WHO U, C Mathers, (2017) Global strategy for women’s, children’s and adolescents’ health (2016-2030). Organization 2016.
- Organization, WH, Global tuberculosis control: WHO report 2011. 2011.
- Supply WUJW, SM Programme, Progress on drinking water and sanitation: 2014 Update. 2014: World Health Organization.
- WHO, WHO Expert Committee on Specifications for Pharmaceutical Preparations. World Health Organization technical report series 2012: 1.
- Courtenay-Quirk C, Wolitski RJ, Parsons JT, Gómez CA (2006) Is HIV/AIDS stigma dividing the gay community? Perceptions of HIV–positive men who have sex with men. AIDS Education & Prevention 18: 56-67.
- Gaolathe T, Wirth KE, Holme MP, Makhema J, Moyo S, et al. (2016) Botswana’s progress toward achieving the 2020 UNAIDS 90-90-90 antiretroviral therapy and virological suppression goals: a population-based survey. The lancet HIV 3: e221-e230.
- Group WB, World Development Indicators 2013. 2013: World Bank Publications.
- Deeks SG, SR Lewin, DV Havlir (2013) The end of AIDS: HIV infection as a chronic disease. The Lancet 382: 1525-1533.
- Gisslén M, Svedhem V, Lindborg L, Flamholc L, Norrgren H, et al. (2017) Sweden, the first country to achieve the Joint United Nations Programme on HIV/AIDS (UNAIDS)/World Health Organization (WHO) 90-90-90 continuum of HIV care targets. HIV medicine 18: 305-307.
- Davila JA, Cabral HJ, Maskay MH, Marcus R, Yuan Y, et al. (2018) Risk factors associated with multi-dimensional stigma among people living with HIV/AIDS who are homeless/ unstably housed. AIDS care 30: 1335-1340.
- Rödlach A, Witches, Westerners, and HIV: AIDS and cultures of blame in Africa. 2016: Routledge.
- Warren Kaplan, Veronika J Wirtz, Aukje Mantel-Teeuwisse, Pieter Stolk, Béatrice Duthey, et al. (2013) Priority Medicines for Europe and the World Update 2013 report. Methodology 2.
- Aralis HJ, Shoptaw S, Brookmeyer R, Ragsdale A, Bolan R, et al. (2018) Psychiatric Illness, Substance Use, and Viral Suppression Among HIV-Positive Men of Color Who Have Sex with Men in Los Angeles. AIDS and Behavior 22: 3117-3129.
- David Paul Ngilangwa, Rhoune Ochako, Beati Alphonce Mboya, Rita Honoratha Noronha, George Suleman Mgomella (2015) Prevalence and predictors of HIV sero-discordance among cohabiting couples tested in northern Tanzania. Pan African Medical Journal 22: 275.
- Spina A, Nigerias mixed epidemic: Balancing prevention priorities between populations. 2011.
- William Kilembe, Kristin M Wall, Mammekwa Mokgoro, Annie Mwaanga, Elisabeth Dissen, et al. (2015) Knowledge of HIV serodiscordance, transmission, and prevention among couples in Durban, South Africa. PLoS One 10: e0124548.
- Idele P, Gillespie A, Porth T, Suzuki C, Mahy M, et al. (2014) Epidemiology of HIV and AIDS among adolescents: current status, inequities, and data gaps. JAIDS Journal of Acquired Immune Deficiency Syndromes 66: S144-S153.
- Borre ED, Hyle EP, Paltiel AD, Neilan AM, Sax PE, et al. (2017) The clinical and economic impact of attaining National HIV/AIDS Strategy treatment targets in the United States. The Journal of infectious diseases 216: 798-807.
- de Bruyn G, Magaret A, Baeten JM, Lingappa JR, Ndase P, et al. (2012) Mortality in members of HIV-1 serodiscordant couples in Africa and implications for antiretroviral therapy initiation: results of analyses from a multicenter randomized trial. BMC infectious diseases 12: 277.
- Hiam Chemaitelly, Susanne F Awad, James D Shelton, Laith J Abu-Raddad (2014) Sources of HIV incidence among stable couples in sub-Saharan Africa. Journal of the International AIDS Society 17: 18765.
- Abebayehu Bitew Aniley, Tadesse Awoke Ayele, Ejigu Gebeye Zeleke, Assefa Andargie Kassa (2016) Factors Associated With Late HIV Diagnosis among Peoples Living with HIV, Northwest Ethiopia: Hospital based Unmatched Case-control Study. J HIV Retrovirus 2: 1-5.
- Tadesse M (2014) Assessment of HIV discordance and associated risk factors among couples receiving HIV test in Dilla, Ethiopia. BMC research notes 7: 893.
- Temam G, A Ali (2012) Prevalence of HIV and discordant rate and their associated factors among premarital Voluntary Counseling and Testing (VCT) clients in Addis Ababa public VCT centers, Addis Ababa, Ethiopia. Ethiopian Journal of Health Development 26: 160-168.
- Lurie MN, Williams BG, Zuma K, Mkaya-Mwamburi D, Garnett GP, et al. (2003) Who infects whom? HIV-1 concordance and discordance among migrant and non-migrant couples in South Africa. Aids 17: 2245-2252.
- William Kilembe, Kristin M. Wall, Mammekwa Mokgoro, Annie Mwaanga, Elisabeth Dissen, et al. (2015) Implementation of couples’ voluntary HIV counseling and testing services in Durban, South Africa. BMC public health 15: 601.
- Ujah IA, OC Ezechi, AG Ohihoin (2015) HIV status discordance: associated factors among HIV positive pregnant women in Lagos, Southwest Nigeria. African Journal of Reproductive Health 19: 107-115.
- Habte E, Yami A, Alemseged F, Abdissa Y, Deribe K, et al. (2015) Predictors of HIV serodiscordance among couples in southwestern Ethiopia. Journal of the International Association of Providers of AIDS Care 14: 234-240.
- Lingappa JR, Lambdin B, Bukusi EA, Ngure K, Kavuma L, et al., (2008) Regional differences in prevalence of HIV-1 discordance in Africa and enrollment of HIV-1 discordant couples into an HIV-1 prevention trial. PloS one 3: e1411.
- Were WA, Mermin JH, Wamai N, Awor AC, Bechange S, et al. (2006) Undiagnosed HIV infection and couple HIV discordance among household members of HIV-infected people receiving antiretroviral therapy in Uganda. Journal of Acquired Immune Deficiency Syndromes 43: 91-95.
- Biraro S, Ruzagira E, Kamali A, Whitworth J, Grosskurth H, et al. (2013) HIV-1 transmission within marriage in rural Uganda: a longitudinal study. PloS one 8: e55060.