


Research Article - (2021) Volume 6, Issue 2
Plasma Renin Activity after Diuretic Treatment in Patients with Stable Heart Failure: With Special Reference to its Association with Electrolyte Chloride
Received Date: Apr 23, 2021 / Accepted Date: Apr 29, 2021 / Published Date: May 08, 2021
Copyright: ©Hajime Kataoka. This is an open-access article distributed under the terms of the Creative Commons Attribution License, which permits unrestricted use, distribution, and reproduction in any medium, provided the original author and source are credited.
Citation: Hajime Kataoka (2021) Plasma Renin Activity after Diuretic Treatment in Patients with Stable Heart Failure: With Special Reference to its Association with Electrolyte Chloride. Cardio Open, 6(2): 123-133.
Abstract
A recent study reported an intimate association between urinary chloride (Cl) and plasma renin activity (PRA) in acute heart failure (HF) status, reflecting normal functioning of the ‘tubulo-glomerular feedback’ mechanism. Whether the ‘tubuloglomerular feedback’ mechanism functions normally in stable HF status, however, is unclear. This study examined whether the ‘tubulo-glomerular feedback’ mechanism functions normally under resolution of worsening HF after decongestive therapy. Data from 26 patients with acute HF and its recovery after decongestive therapy were analyzed. Clinical tests included measurement of peripheral blood tests, serum and spot urinary electrolytes, plasma neurohormones, and fractional urinary excretions of electrolytes. In a total of 26 patients, PRA increased after acute HF treatment (from 1.64±2.0 to 5.48±6.1 ng/ mL/h, p=0.002). Changes in the serum logPRA and urinary Cl concentration from worsening to its recovery tended to be inversely correlated (R2 =0.12, p=0.085) and logPRA and the serum Cl concentration at recovery were inversely correlated (R2 =0.23, p=0.01). When divided into 2 groups (n=13 in each) according to the median PRA, the group with greater PRA changes showed a larger decrease in the urinary Cl concentration (from 110±44 to 72.8±38, p=0.03). The group with higher PRA at recovery showed a lower serum Cl concentration than the group with lower PRA at recovery (102±6.5 vs 107±4.2 mEq/L, p=0.04). In conclusion, the association between PRA and the serum/urinary Cl concentration is blunted in stable HF under-decongestive therapy, possibly due to the physiologic status under full cardiovascular medication compared with that in acute HF status.
Keywords
Heart Failure, Chloride, Urinary Chloride Concentration, Tubulo-Glomerular Feedback, Plasma Renin Activity
Introduction
In the kidney, renal salt sensing and renin secretion are dependent on macula densa chloride (Cl) transport at the juxta-glomerular apparatus, which is central to the ‘tubulo-glomerular feedback’ mechanism [1-4]. A recent clinical study reported an inverse cor- relation between the urinary Cl concentration and plasma renin activity (PRA) in acute heart failure (HF) status, reflecting normal ‘tubulo-glomerular feedback’ function in the human body [5]. The relation of electrolyte Cl to this mechanism in clinically stable HF, however, remains unclear.
Thus, the present study evaluated the performance of the ‘tubu- lo-glomerular feedback’ mechanism in stable HF by analyzing the association between PRA and the serum/urinary Cl concentration in patients with stable chronic HF patients following decongestive therapy. Additionally, this study sought to explore the clinical ev- idence supporting the ‘chloride theory’ in HF patients receiving decongestive therapy [6-8].
Methods
Study Design
This study was a single-center observational study that enrolled consecutive 31 patients with acute HF at Nishida Hospital (Saiki- city, Oita, Japan) undergoing neurohormonal study between March 2017 and April 2018. Diagnosis of worsening of HF was estab- lished by standard clinical criteria of presentation, echocardiog- raphy, and serum b-type natriuretic peptide (BNP) [9]. Additional routine tests included thoracic ultrasound to evaluate the presence of pleural effusion [10,11] and monitoring the changes in body weight during follow-up (HBF-352-W, Omron Healthcare Co., Kyoto, Japan) [12]. Worsening HF was treated by conventional therapy with a combination of loop diuretics, aldosterone block- ade, thiazide diuretics, oral vasopressin antagonist, acetazolamide, and/or inotropic drugs by oral and/or intravenous routes in the hos-pital or outpatient clinic. Based on the follow-up examination, the response of worsening HF to treatment and return of the clinical presentation to stable HF status were determined. Acute HF pa- tients with cardiogenic shock, clinical diagnosis of acute coronary syndrome, or know advanced renal disease (serum creatinine level >3.0 mg/dL) were excluded from the present study.
Data Collection and Analytic Methods
Physical examination, blood tests of peripheral venous blood, and a spot urine test for electrolytes and creatinine were performed twice, i.e., at acute HF condition immediately before initiation of treatment, and at stable HF condition after well-done decongestive therapy. The blood and urine samples were obtained after patients rested in a supine or semi-supine position for 20-min. Peripheral blood tests, analyzed by standard techniques, included hemoglo- bin, hematocrit, serum electrolytes (sodium, potassium, and Cl), blood urea nitrogen, and creatinine. The spot urine test included measurement of electrolytes and creatinine concentrations, and osmolality. Plasma BNP was measured by chemiluminescent im- munoassay. Plasma adrenaline and noradrenaline were measured by high performance liquid chromatography. Plasma renin activity was measured by enzyme immunoassay. Plasma aldosterone and arginine vasopressin (AVP) levels were measured by radioimmu- noassay. The Strauss formula is used to estimate percentage (%) change in plasma volume [13,14]: % change in plasma volume= ([(Hb1/Hb2) × (100-Hct2)/(100-Hct1)–1] × 100, where 1=base- line and 2=end values, Hb=hemoglobin, and Hct=hematocrit. Fractional excretions of electrolytes were calculated as: fraction-al excretion of X=(Xurine/Xserum)×(Crserum/Crurine)×100 [15]. Urinary osmotic pressure was measured by the freezing point depression method using an OM-6060 type automatic osmotic pressure mea- suring device (Arkray Inc., Kyoto, Japan).
Statistical Analysis
All data are expressed as mean±SD for continuous data and per- centage for categorical data. Paired and unpaired t tests for con- tinuous data were used for two-group comparisons. Pearson’s cor- relation was performed to evaluate the linear association between logarithmically transformed PRA and other variables. A p value of <0.05 was considered statistically significant.
Results
Of the 31 acute HF patients, 5 were excluded from the present study because of lacked clinical data for analysis of the present study due to cardiac death during follow-up in 3 patients and in- sufficient data in 2. The remaining 26 patients (50% men; 81.2±12 years), including de novo acute HF patients (n=9), were enrolled in the present analysis. Clinical characteristics and maintenance medical use of study patients at acute HF presentation is shown in Table 1. All study patients presented with two to four HF signs on the basis of physical examination and searching for pleural ef- fusion by thoracic ultrasound. Plasma BNP levels ware elevated definitely (≥ 500 pg/mL) in 18 patients, moderately (500 pg/mL> to 200 pg/mL) in 6, and mildly (200 pg/mL> to 100 pg/mL) in 2. Treatment for acute HF was undertaken in hospital in 21 patients, and outpatient clinic in 5 patients.
Table 1: Clinical characteristics of the study patients at presentation of worsening heart failure
|
Characteristics |
Total N = 26 |
|
|
Age (years) |
||
|
|
Mean ± SD |
81.2±12 |
|
|
Range |
53-97 |
|
Male |
13 (50) |
|
|
Primary cause of HF |
||
|
|
Hypertension |
18 (69) |
|
|
Valvular |
4 (15) |
|
|
Ischemic/Cardiomyopathy |
3 (12) |
|
|
Arrhythmia |
1 (4) |
|
Left ventricular EF (%) |
||
|
|
Mean ± SD |
46.8±18 |
|
Left ventricular EF > 50% |
14 (54) |
|
|
Atrial fibrillation |
13 (50) |
|
|
NYHA-FC at acute HF presentation |
||
|
|
III |
5 (19) |
|
|
IV |
21 (81) |
|
HF-related physical findings at acute HF presentation |
||
|
|
Bilateral leg edema around or above the ankle |
22 (85) |
|
|
Bilateral pulmonary rales beyond the basal lung |
20 (77) |
|
|
Pleural effusion on thoracic ultrasound |
23 (88) |
|
|
Third heart sound (S3) |
5 (19) |
|
|
|
Number of HF sings (Mean±SD; range) |
2.69±0.62; 2-4 |
|
|
B-type natriuretic peptide (pg/mL) at acute HF presentation |
|||
|
|
2000≥ |
1 (4) |
|
|
|
2000 – 1000 |
5 (19) |
|
|
|
1000 – 500 |
12 (46) |
|
|
|
500 – 200 |
6 (23) |
|
|
|
200 – 100 |
2 (8) |
|
|
Baseline medication use at acute HF presentation |
|||
|
|
De novo HF patients without diuretic treatment |
9 (35) |
|
|
|
Diuretics |
|
|
|
|
|
Loop diuretics |
11 (42) |
|
|
|
Thiazide diuretics |
15 (14) |
|
|
|
MRA |
11 (42) |
|
|
|
Tolvaptan |
5 (19) |
|
|
|
Acetazolamide |
8 (31) |
|
|
ACE inhibitors/ARB |
10 (34) |
|
|
|
Beta-blockers |
7 (27) |
|
|
|
Calcium antagonists |
8 (31) |
|
Data presented as number (%) of patients otherwise specified. ACE: angiotensin-converting enzyme, ARB: angiotensin II receptor blocker, EF: ejection fraction, MRA: mineralocorticoid receptor antagonist, NYHA-FC: New York Heart Association functional class, HF: heart failure
After decongestive treatment for 25.2±17 (range 7â??78) days, all the study patients responded well to the treatment, resulting in dis- appearance of ≥2 HF-related signs in each, and minimal residual HF-related signs remained to be observed in only 5 patients (per- sistent basal rales in 3 and minimal pleural effusion in 2). Table 2 shows changes in the physical and blood laboratory results un- der diuretic treatment. Systolic and diastolic pressures, heart rate, and plasma logBNP levels decreased. Plasma volume estimated by the Strauss method and serum electrolyte concentrations did not change, whereas the serum blood urea nitrogen and creatinine concentrations increased. Urinary Cl and potassium concentrations decreased following decongestive therapy. Plasma adrenaline and noradrenaline concentrations decreased, but PRA and aldosterone concentrations increased. Individual logPRA values were widely distributed from relatively low to high in worsening HF (Figure 1A) and its recovery following decongestive therapy (Figure 1B). The histogram of logPRA shifted up in patients after receiving de- congestive treatment for worsening HF.
Figure 1. Distribution of log plasma renin activity (logPRA) in the 26 study patients under
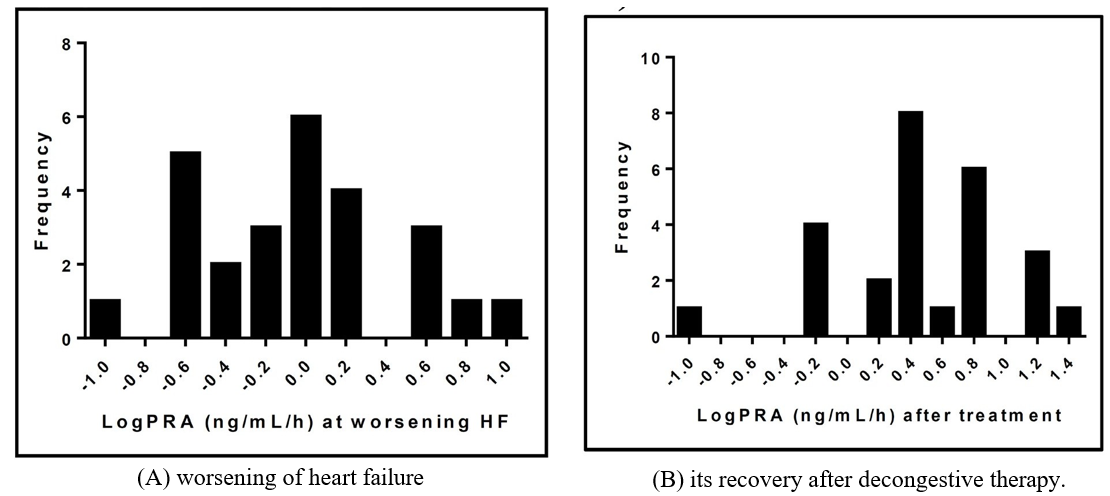
Table 2: Changes in physical and laboratory tests after decongestive treatment in 26 heart failure patients
|
|
|
|
Normal range |
Before |
After |
After vs. Before (in- crease/unchanged/ decrease) |
p value |
|
Physical examination |
|||||||
|
|
Blood pressure (mmHg) |
||||||
|
|
|
Systolic pressure |
|
135 ± 34 |
119 ± 17 |
8/ 0/ 18 |
0.0024* |
|
|
|
Diastolic pressure |
|
76.4 ± 21 |
66.1 ± 12 |
8/ 0/ 18 |
0.013* |
|
|
Heart rate (bpm) |
|
86 ± 21 |
71.7 ± 14 |
6/ 1/ 19 |
0.002* |
|
|
LogBNP (pg/mL) |
|
2.81 ± 0.34 |
2.25 ± 0.31 |
0/ 0/ 26 |
<0.0001* |
||
|
Peripheral blood test |
|||||||
|
|
|
Hemoglobin (g/dL) |
11.6â??14.8 |
11.7 ± 2.1 |
12.0 ± 2.5 |
15/ 1/ 10 |
0.28 |
|
|
|
Hematocrit (%) |
35.1â??44.4 |
35.4 ± 6.0 |
35.9 ± 6.9 |
13/ 0/ 13 |
0.48 |
|
|
|
%Changes in plasma volume |
|
— |
-0.2 ± 6.3 |
13/ 0/ 13 |
— |
|
|
Serum electrolytes |
||||||
|
|
|
Sodium (mEq/L) |
138â??145 |
139 ± 5.1 |
139 ± 4.7 |
12/ 5/ 9 |
0.82 |
|
|
|
Potassium (mEq/L) |
3.6â??4.8 |
4.27 ± 0.68 |
4.12 ± 0.51 |
8/ 3/ 15 |
0.28 |
|
|
|
Chloride (mEq/L) |
101â??108 |
104 ± 5.7 |
104 ± 5.8 |
11/ 1/ 14 |
0.71 |
|
|
Blood urea nitrogen (mg/dL) |
8.0â??20.0 |
26.5 ± 11 |
38.7 ± 19 |
22/ 1/ 3 |
0.0008* |
|
|
|
Serum creatinine (mg/dL) |
0.46â??0.79 |
1.26 ± 0.56 |
1.43 ± 0.60 |
20/ 1/ 5 |
0.004* |
|
|
|
Uric acid (mg/dL) |
3.7-7 |
6.38 ± 2.41 |
7.43 ± 2.12 |
20/ 0/ 6 |
0.023* |
|
|
Spot urinary examination |
|||||||
|
|
Concentration of urinary electrolytes |
||||||
|
|
|
Sodium (mEq/L) |
|
91.6 ± 45 |
78.7 ± 33 |
9/ 0/ 17 |
0.14 |
|
|
|
Potassium (mEq/L) |
|
29.7 ± 15 |
24.2 ± 9.6 |
8/ 0/ 18 |
0.038* |
|
|
|
Chloride (mEq/L) |
|
93.0 ± 48 |
68.8 ± 34 |
8/ 1/ 17 |
0.035* |
|
|
% excretion of urinary electrolytes |
||||||
|
|
|
Sodium (%) |
|
2.18 ± 2.1 |
2.09 ± 2.3 |
13/ 0/ 13 |
0.88 |
|
|
|
Potassium (%) |
|
16.0 ± 9.8 |
13.5 ± 7.6 |
8/ 0/ 18 |
0.25 |
|
|
|
Chloride (%) |
|
2.9 ± 2.9 |
2.09 ± 2.3 |
8/ 0/ 18 |
0.28 |
|
|
Osmolality (mOsm/kg H2O) |
473 ± 184 |
452 ± 155 |
13/ 0/ 13 |
0.53 |
||
|
Neurohormonal test |
|||||||
|
|
Adrenaline (pg/mL) |
< 0.1 |
0.085 ± 0.08 |
0.048 ±0.05 |
5/ 1/ 20 |
0.005* |
|
|
|
Noradrenaline (pg/mL) |
0.1â??0.5 |
0.96 ± 0.6 |
0.52 ± 0.3 |
5/ 0/ 21 |
0.001* |
|
|
|
Renin activity (ng/mL/h) |
0.2â??2.3 |
1.64 ± 2.0 |
5.48 ± 6.1 |
22/ 0/ 4 |
0.002* |
|
|
|
Aldosterone (pg/mL) |
36â??240 |
117 ± 90 |
209 ± 257 |
19/ 0/ 7 |
0.039* |
|
|
|
AVP (pg/mL) |
< 2.8 |
3.54 ± 3.4 |
3.97 ± 6.1 |
13/ 1/ 12 |
0.59 |
|
*Statistically significant difference between before and after treatment (p < 0.05, paired t test). AVP: arginine vasopressin, BNP: b-type natriuretic peptide. As shown in Table 3, among a total of 26 study patients, changes in the serum logPRA and urinary Cl concentrations from worsen- ing HF to its recovery tended to be inversely correlated (R2=0.12, p=0.085; Figure 2A), and logPRA and serum Cl concentrations at recovery were inversely correlated (R2=0.23, p=0.01; Figure 2B).
Table 3: Pearson’s correlation of delt logPRA from worsening HF to its recovery or logPRA at recovery to multiple variables in stable HF status following decongestive therapy (Total N = 26)
|
|
Change in LogPRA (ng/mL/h) from worsening HF to its recovery |
LogPRA (ng/mL/h) at recovery from worsening HF |
|||
|
Variable |
R2 |
p value |
R2 |
p value |
|
|
LogBNP (pg/mL) |
0.05 |
0.26 |
0.09 |
0.64 |
|
|
Systolic BP (mmHg) |
0.0002 |
0.95 |
0.012 |
0.59 |
|
|
Diastolic BP (mmHg) |
0.1 |
0.11 |
0.18 |
0.029* |
|
|
Heart rate (beats/min) |
0.024 |
0.44 |
0.09 |
0.13 |
|
|
% change in plasma volume (%) |
0.018 |
0.52 |
0.014 |
0.56 |
|
|
Serum electrolytes |
|||||
|
|
Sodium (mEq/L) |
0.08 |
0.17 |
0.08 |
0.15 |
|
|
Potassium (mEq/L) |
0.02 |
0.47 |
0.1 |
0.12 |
|
|
Chloride (mEq/L) |
0.11 |
0.096 |
0.23 |
0.01* |
|
BUN (mg/dL) |
0.23 |
0.014* |
0.03 |
0.41 |
|
|
Creatinine (mg/dL) |
0.045 |
0.3 |
0.09 |
0.14 |
|
|
Urinary concentration |
|||||
|
|
Sodium (mEq/L) |
0.18 |
0.03* |
0.04 |
0.31 |
|
|
Potassium (mEq/L) |
0.02 |
0.49 |
0.12 |
0.09 |
|
|
Chloride (mEq/L) |
0.12 |
0.085 |
0.01 |
0.6 |
|
Osmolality (mOsm/kg H2O) |
0.02 |
0.48 |
0.04 |
0.36 |
|
|
Adrenaline (pg/mL) |
0.08 |
0.17 |
0.19 |
0.027* |
|
|
Noradrenaline (pg/mL) |
0.005 |
0.74 |
0.06 |
0.22 |
|
|
Aldosterone (pg/mL) |
0.24 |
0.01* |
0.24 |
0.01* |
|
|
AVP (pg/mL) |
0.08 |
0.16 |
0.06 |
0.22 |
|
AVP: arginine vasopressin, BNP: b-type natriuretic peptide, BP: blood pressure, BUN: blood urea nitrogen, HF: heart failure, PRA: plasma renin activity
Figure 2. Correlations between
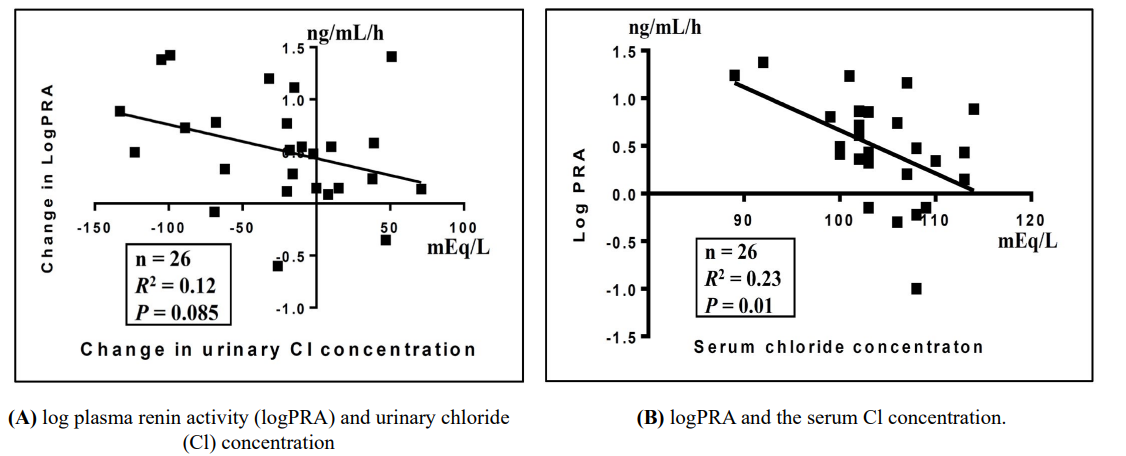
Table 4 shows low vs high groups of the 2 different categories of
(A) changes in PRA from worsening HF to its recovery and
(B) PRA at recovery from worsening HF stratified by splitting the same study population according to each median value.
Table 4: Comparison of blood chemistries and neurohormones between low and high groups stratified by (A) changes in PRAfrom worsening HF to its recovery or (B) PRA at recovery from worsening HF in 26 HF patients
|
|
(A) Change in PRA from worsening HF to its re- covery |
p value |
(B) PRA at recovery from worsening HF |
p value |
||||
|
Low (n=13) |
High (n=13) |
Low (n=13) |
High (n=13) |
|||||
|
Renin activity (ng/mL/h) |
||||||||
|
|
Worsening |
2.35 ± 2.4 |
0.92 ± 1.2 |
0.07 |
– |
– |
|
|
|
|
Recovery |
3.49 ± 3.9 |
7.45 ± 7.3 |
0.1 |
1.55 ± 0.94 |
9.40 ± 6.6 |
0.0003* |
|
|
|
Δworse to recovery |
1.13 ± 1.9 |
6.55 ± 6.8 |
0.01* |
|
|
|
|
|
|
p value |
0.05 |
0.005* |
|
|
|
|
|
|
Physical examination |
||||||||
|
|
Systolic pressure (mmHg) |
|||||||
|
|
|
Worsening |
141 ± 34 |
130 ± 35 |
0.46 |
– |
– |
|
|
|
|
Recovery |
120 ± 19 |
118 ± 16 |
0.87 |
121 ± 19 |
117 ± 16 |
0.49 |
|
|
|
Δworse to recovery |
-21 ± 25 |
-11.9 ± 25 |
0.36 |
|
|
|
|
|
|
p value |
0.01* |
0.11 |
|
|
|
|
|
|
Diastolic pressure (mmHg) |
|||||||
|
|
|
Worsening |
81.3 ± 26 |
71.4 ± 14 |
0.23 |
– |
– |
|
|
|
|
Recovery |
65.2 ± ±13 |
67.0 ± 11 |
0.71 |
62.5 ± 13 |
69.7 ±10 |
0.13 |
|
|
|
Δworse to recovery |
-16.1 ± 24 |
-4.4 ± 11 |
0.13 |
|
|
|
|
|
|
p value |
0.03* |
0.19 |
|
|
|
|
|
|
Heart rate (bpm) |
|||||||
|
|
|
Worsening |
85.2 ± 17 |
86.8 ± 25 |
0.89 |
– |
– |
|
|
|
|
Recovery |
72.2 ± 13 |
71.2 ± 15 |
0.84 |
67.9 ± 9.7 |
75.5 ± 16 |
0.16 |
|
|
|
Δworse to recovery |
-13.0 ± 17 |
-15.6 ± 25 |
0.76 |
|
|
|
|
|
|
p value |
0.02* |
0.04* |
|
|
|
|
|
LogBNP (pg/mL) |
||||||||
|
|
|
Worsening |
2.85 ± 0.35 |
2.78 ± 0.34 |
0.59 |
– |
– |
|
|
|
|
Recovery |
2.18 ± 0.26 |
2.32 ± 0.35 |
0.24 |
2.19 ± 0.31 |
2.31 ± 0.32 |
0.37 |
|
|
|
Δworse to recovery |
-0.67 ± 0.35 |
-0.45 ± 0.26 |
0.08 |
|
|
|
|
|
|
p value |
<0.0001* |
<0.0001* |
|
|
|
|
|
Peripheral blood test |
||||||||
|
|
%Changes in plasma volume |
|||||||
|
|
|
Mean±SD |
-0.13 ± 7.3 |
-0.26 ± 5.4 |
0.96 |
-0.09 ± 7.2 |
-0.3 ± 5.5 |
0.94 |
|
|
|
Range |
-9.9 ~ 16.3 |
-7.4 ~ 9.6 |
|
|
|
|
|
Sodium (mEq/L) |
||||||||
|
|
|
Worsening |
139 ± 4.8 |
139 ± 5.6 |
0.79 |
– |
– |
|
|
|
|
Recovery |
140 ± 3.2 |
138 ± 5.8 |
0.36 |
139±4.0 |
139±5.4 |
0.68 |
|
|
|
Δworse to recovery |
1.31 ± 3.1 |
-0.9 ± 5.1 |
0.19 |
|
|
|
|
|
|
p value |
0.16 |
0.53 |
|
|
|
|
|
|
Potassium (mEq/L) |
|||||||
|
|
|
Worsening |
4.42 ± 0.68 |
4.13 ± 0.68 |
0.3 |
– |
– |
|
|
|
|
Recovery |
4.24 ± 0.62 |
3.99 ± 0.36 |
0.23 |
4.36 ± 0.50 |
3.87 ± 0.4 |
0.01* |
|
|
|
Δworse to recovery |
-0.20 ± 0.71 |
-0.10 ± 0.78 |
0.9 |
|
|
|
|
|
|
p value |
0.39 |
0.53 |
|
|
|
|
|
|
Chloride (mEq/L) |
|||||||
|
|
|
Worsening |
105 ± 6.0 |
103 ± 5.6 |
0.32 |
– |
– |
|
|
|
|
Recovery |
107 ± 3.9 |
101 ± 6.2 |
0.01* |
107 ± 4.2 |
102 ± 6.5 |
0.04* |
|
|
|
Δworse to recovery |
2.23 ± 5.8 |
-1.15 ± 8.3 |
0.24 |
|
|
|
|
|
|
p value |
0.19 |
0.62 |
|
|
|
|
|
|
Blood urea nitrogen (mg/dL) |
|||||||
|
|
|
Worsening |
32.8 ± 9.9 |
20.2 ± 8.9 |
0.02* |
– |
– |
|
|
|
|
Recovery |
38.9 ± 15.5 |
38.6 ± 23.4 |
0.97 |
35.5 ± 13 |
42.0 ± 24 |
0.4 |
|
|
|
Δworse to recovery |
6.13 ± 10.5 |
18.3 ± 19.1 |
0.05 |
|
|
|
|
|
|
p value |
0.06 |
0.005* |
|
|
|
|
|
|
Serum creatinine (mg/dL) |
|||||||
|
|
|
Worsening |
1.52 ± 0.68 |
1.0 ± 0.25 |
0.02* |
– |
– |
|
|
|
|
Recovery |
1.62 ± 0.71 |
1.23 ± 0.40 |
0.1 |
1.56 ± 0.65 |
1.30 ± 0.54 |
0.28 |
|
|
|
Δworse to recovery |
0.10 ± 0.3 |
0.24 ± 0.23 |
0.22 |
|
|
|
|
|
|
p value |
0.26 |
0.003* |
|
|
|
|
|
Spot urinary examination |
||||||||
|
|
Sodium (mEq/L) |
|||||||
|
|
|
Worsening |
74.5 ± 43 |
109 ± 42 |
0.79 |
– |
– |
|
|
|
|
Recovery |
75.2 ± 28 |
82.2 ± 39 |
0.37 |
86.6 ± 30 |
70.7 ± 35 |
0.23 |
|
|
|
Δworse to recovery |
0.62 ± 41 |
-26.0 ± 42 |
0.19 |
|
|
|
|
|
|
P value |
0.96 |
0.04* |
|
|
|
|
|
|
Potassium (mEq/L) |
|||||||
|
|
|
Worsening |
31.2 ± 15 |
28.3 ± 15 |
0.3 |
– |
– |
|
|
|
|
Recovery |
22.6 ± 8.9 |
25.8 ± 10 |
0.23 |
21.3 ± 6.9 |
27.1 ± 11 |
0.13 |
|
|
|
Δworse to recovery |
-8.54 ± 13 |
-2.54 ± 13 |
0.9 |
|
|
|
|
|
|
p value |
0.03* |
0.49 |
|
|
|
|
|
|
Chloride (mEq/L) |
|||||||
|
|
|
Worsening |
75.5 ± 48 |
110 ± 44 |
0.07 |
– |
– |
|
|
|
|
Recovery |
64.8 ± 31 |
72.8 ± 38 |
0.57 |
73.8 ± 26 |
63.9 ± 42 |
0.47 |
|
|
|
Δworse to recovery |
-11.0 ± 52 |
-38.0 ± 57 |
0.22 |
|
|
|
|
|
|
p value |
0.47 |
0.03* |
|
|
|
|
|
Neurohormonal test |
||||||||
|
|
Adrenaline (pg/mL) |
|||||||
|
|
|
Worsening |
0.07 ±0.04 |
0.10 ± 0.10 |
0.22 |
– |
– |
|
|
|
|
Recovery |
0.046 ± 0.05 |
0.05 ± 0.04 |
0.85 |
0.028 ± 0.02 |
0.07 ± 0.006 |
0.03* |
|
|
|
Δworse to recovery |
-0.02 ± 0.05 |
-0.05 ± 0.07 |
0.15 |
|
|
|
|
|
|
p value |
0.13 |
0.01* |
|
|
|
|
|
|
Noradrenaline (pg/mL) |
|||||||
|
|
|
Worsening |
0.92 ± 0.63 |
0.99 ± 0.65 |
0.75 |
– |
– |
|
|
|
|
Recovery |
0.53 ± 0.41 |
0.51 ± 0.23 |
0.87 |
0.44 ± 0.29 |
0.61 ± 0.35 |
0.19 |
|
|
|
Δworse to recovery |
-0.38 ± 0.55 |
-0.48 ± 0.67 |
0.67 |
|
|
|
|
|
|
p value |
0.03* |
0.02* |
|
|
|
|
|
|
Aldosterone (pg/mL) |
|||||||
|
|
|
Worsening |
134 ± 94 |
97.9 ± 86 |
0.29 |
– |
– |
|
|
|
|
Recovery |
160 ± 116 |
258 ± 346 |
0.34 |
131 ± 102 |
287 ± 338 |
0.12 |
|
|
|
Δworse to recovery |
23.9 ± 92 |
160 ± 279 |
0.11 |
|
|
|
|
|
|
p value |
0.37 |
0.06 |
|
|
|
|
|
Cardiovascular medication |
||||||||
|
|
Loop diuretics |
12 |
11 |
1 |
11 |
12 |
1 |
|
|
|
Thiazide diuretics |
2 |
2 |
1 |
1 |
3 |
0.59 |
|
|
|
MRA |
9 |
13 |
0.1 |
10 |
12 |
0.59 |
|
|
|
Tolvaptan |
3 |
3 |
1 |
1 |
5 |
0.16 |
|
|
|
Acetazolamide |
9 |
8 |
1 |
9 |
8 |
1 |
|
|
|
ACE inhibitors/ARB |
6 |
4 |
1 |
7 |
3 |
0.23 |
|
|
|
Beta-blockers |
6 |
6 |
0.69 |
3 |
9 |
0.047* |
|
*Statistically significant difference between before and after treatment (p <0.05, paired t test). ACE: angiotensin-converting enzyme, ARB: angiotensin II receptor blocker, BNP: b-type natriuretic peptide, HF: heart failure, MRA: mineralocorticoid receptor antagonist, PRA: plasma renin activity.
Usage of cardiovascular medication was not different between the low and high groups in each of the 2 different categories, except for the more frequent use of beta-blockers in the high PRA group compared with the low PRA group in category (B) at recovery from worsening HF. When divided into 2 groups according to the changes in PRA from worsening HF to its recovery (A: Table 4), both groups showed similar changes from worsening to recovery in physical examina- tion, logBNP, plasma volume, serum sodium, potassium and Cl electrolytes, and neurohormonal levels. The high-change group showed significantly increased serum concentrations of blood urea nitrogen and creatinine, and significantly decreased urinary con- centrations of sodium (from 109±42 to 82.2±39 mEq/L, p=0.04) and Cl (from 110±44 to 72.8±38 mEq/L, p=0.03) after deconges- tive therapy.
When divided into 2 groups according to the median value of PRA at recovery (B: Table 4), the high-PRA group presented with lower serum potassium (3.87±0.4 vs 4.36±0.50 mEq/L, p=0.01) and Cl (102±6.5 vs 107±4.2, mEq/L, p=0.04) concentrations compared with the low-PRA group.
Discussion
The present study revealed that PRA was enhanced following de- congestive therapy, but individual activity widely distributed from low to high levels. The association between PRA and the serum/ urinary Cl concentration was blunted in stable HF after recovery from worsening HF, possibly due to the physiologic status under full cardiovascular medication compared with inadequate cardio- vascular medication in acutely worsening HF [5].
Plasma Renin Activity after Decongestive Treatment for Acute HF
The present study confirmed that PRA was increased after de- congestive treatment, consistent with previous studies [8,16-20]. The main mechanism for the renin activity under treatment with conventional diuretics is reported to be diuretic-induced plasma volume contraction [21,22], but other potential mechanisms of en- hanced renin activity due to a decreased supply of Cl in the mac- ula densa cells and consequent enhancement of renin secretion by ‘tubulo-glomerular feedback’ are as follows: 1) blockade of the entrance of Cl into the macula densa cells by loop diuretics [23], and/or 2) decreased Cl supply to macula densa cells due to hypo- chloremia, as predicted by the ‘chloride theory’ [6]. No apparent association of PRA with diuretic-induced plasma volume changes as evaluated by the Strauss method was detected in the present study.
As for electrolyte Cl, our recent study examining pre-treatment acute HF patients provided clinical evidence for normal function of urinary Cl involved in the ‘tubulo-glomerular feedback’ mech- anism by disclosing an inverse association between the urinary Cl concentration and PRA [5]. In the present study, PRA was weakly associated with the serum Cl concentration (R2=0.23, p=0.01; Fig- ure 2B). PRA tended to be associated with the urinary Cl concen- tration (R2=0.12, p=0.085; Figure 2A), but the trend did not reach statistical significance. The present study demonstrated that the ‘tubulo-glomerular feedback’ mechanism is blunted in stable HF, but the clinical significance of this finding is unclear, as discussed below.
Plasma Renin Activity and Cl in Stable HF with Respect to the ‘Tubulo-Glomerular Feedback’ Mechanism
As mentioned above, most clinical studies [8,16-20] report en- hanced PRA following decongestive therapy for acute HF, but clin- ical investigations of the association of PRA with the electrolyte Cl, by which the electrolyte renin-angiotensin-aldosterone mecha- nism is basically regulated, are scarce. Similar to the present study, Hanberg et al, demonstrated an independent association between PRA and the serum Cl concentration [24]. The study by Hanberg et al, included 162 chronic HF patients taking loop diuretics, of whom 111 had hypochloremia (serum chloride ≤96 mmol/L) and 51 had normochloremia (serum chloride >96 mmol/L) [24]. They observed that the total renin level was higher in patients with hy- pochloremia compared to those without hypochloremia. Plasma renin levels were negatively and independently correlated with serum Cl concentrations whereas the correlation with the serum sodium concentration was less pronounced.
Our recent study examining acute HF patients provided defini- tive proof of normal ‘tubulo-glomerular feedback’ function in the human body by demonstrating a significant association between the spot urinary Cl concentration and PRA [5]. Unfortunately, the present study could not find such an intimate association between the spot urinary Cl concentration and PRA, but instead demon- strated a significant and inverse relationship between PRA and se- rum Cl concentrations in stable HF (Figure 2), similar to the report by Hanberg et al, [24].
The inability to detect a significant association between the urinary Cl concentration and PRA in stable HF might be due to:
1) the lack of statistical power to detect an association because of the small sample size,
2) a blunted response of the macula densa to the urinary Cl concentration caused by adaptation of the ‘tubu- lo-glomerular feedback’ mechanism in chronic HF status [3],
3) the existence of many confounding factors influencing the elec- trolyte Kinetics, [25,26], and
4) the effects of treatment with neurohormonal blockers and diuret- ics for maintaining a stable HF condition [19,20]. With regard to the latter possibility, Pearson’s correlation between the serum and urinary Cl concentrations was nearly equal between data obtained in acute HF status (n=29, R2=0.13, p=0.06) and data obtained in stable HF status (n=26, R2=0.13, p=0.05).
Despite a similar relation between the serum and urinary Cl con- centrations, the lack of a significant association between the uri- nary Cl concentration and PRA under stable HF status might be related to a presumed modification of urinary contents induced by a strict medication regimen, with the progression of glomerularly filtered plasma running through the renal tubules into the bladder, compared with insufficient treatment in acute HF status [27,28]. Future studies are required to resolve this issue.
Clinical Proof of the ‘Chloride Theory’ for HF Patho- physiology
The ‘chloride theory’ for HF pathophysiology states that chang- es in the serum Cl concentration are the primary determinant of changes in the plasma volume and renin-angiotensin-aldosterone system [6]. Under decongestive therapy for worsening HF, this theory predicts that PRA would be enhanced under lowering of the serum Cl concentration by Cl-depleting diuretic therapy, such as the use of loop/thiazide diuretics. In contrast, renin activity would likely be depressed or suppressed when the serum Cl con- centration is enhanced by treatment with Cl-regaining diuretics or Cl supplementary treatment [6,8,29]. Observations of the present study support the ‘chloride theory’ for HF pathophysiology [6-8] by disclosing interactions between the serum Cl concentration and neurohormonal activities during resolution of acute HF, i.e., stable HF patients with low PRA had high serum Cl concentrations, and conversely, those with high PRA had low serum Cl concentrations (Table 4). Thus, the ‘chloride theory’ for HF pathophysiology [6- 8] could provide a primary care management system for diuretic treatment of HF patients, with attention to the serum Cl concentra- tion and changes central to this system [29].
Study Limitations
This study was a single-center observational study performed with a relatively small number of patients, and should thus be con- sidered as hypothesis-generating. In addition, the present results were derived from a population of mild-to-moderate HF patients. Enhanced PRA is frequently observed in patients with advanced HF and hypovolemia, but not in those with mild to moderate HF [19,21,22,30]. Furthermore, body fluid retention induced by a high sodium diet or diuretic withdrawal in patients with mild to mod- erate HF depressed the PRA [31-33]. As such, PRA may widely fluctuate in stable HF status. Therefore, extrapolation of the results of this study cannot be generalized to patients with more advanced HF. Further studies including a larger number of HF patients are needed to better assess the clinical implications of PRA measure- ments in HF pathophysiology.
Conclusions
Except for several clinical studies of HF pathophysiology, PRA has not been evaluated in association with the kinetics of Cl, although this electrolyte is key for regulating renin release in the macula densa [5,24]. The present findings suggest that ‘tubulo-glomeru- lar feedback’ functions normally in stable HF by showing a trend toward a significant and inverse association between PRA and the urinary Cl concentration, but its function is blunted in stable HF under-decongestive therapy, possibly due to the physiologic status under full cardiovascular medication compared with that in acute HF status.
References
-
- Lorenz JN, Weihprecht H, Schnermann J, Skøtt O, Briggs JP (1991) Renin release from isolated juxtaglomerular appara- tus depends on macula densa chloride transport. Am J Physiol 260: F486-F493.
- He X-R, Greenberg SG, Briggs JP, Schnermann J (1995) Ef- fects of furosemide and verapamil on the NaCl dependency of macula densa-mediated renin secretion. Hypertension 26: 137-142.
- Schnermann J (1998) Juxtaglomerular cell complex in the reg- ulation of renal salt excretion. Am J Physiol 274: R263-R279.
- Verbrugge FH, Dupont M, Steels P, Grieten L, Swennen Q, et al. (2014) The kidney in congestive heart failure: ‘Are natri- uresis, sodium, and diuretics really the good, the bad and the ugly?’ Eur J Heart Fail 16: 133-142.
- Kataoka H (2021) Clinical significance of spot urinary chlo- ride concentration measurements in patients with acute heart failure: Investigation on the basis of the ‘tubulo-glomerular feedback’ mechanism. Cardio Open 6: 123-131.
- Kataoka H (2017) The “chloride theory”, a unifying hypothe- sis for renal handling and body fluid distribution in heart fail- ure pathophysiology. Med Hypotheses 104: 170-173.
- Kataoka H (2019) Biochemical determinants of changes in plasma volume after decongestion therapy for worsening heart failure. J Card Fail 25: 213-217.
- Kataoka H (2019) Rational of the “chloride theory” as an ex- planation for neurohormonal activity in heart failure patho- physiology: Literature review. J Clin Exp Cardiolog 10: 634.
- Kataoka H (2015) Clinical significance of bilateral leg edema and added value of monitoring weight gain during follow-up of patients with established heart failure. ESC Heart Fail 2: 106-115.
- Kataoka H, Takada S (2000) The role of thoracic ultrasonog- raphy for evaluation of patients with decompensated chronic heart failure. J Am Coll Cardiol 35: 1638-1646.
- Kataoka H (2007) Utility of thoracic sonography for fol- low-up examination of chronic heart failure patients with pre- vious decompensation. Clin Cardiol 30: 336-341.
- Kataoka H (2009) A new monitoring method for the estima- tion of body fluid status by digital weight scale incorporating bioelectrical impedance analyzer in definite heart failure pa- tients. J Card Fail 15: 410-418
- Strauss MB, Davis RK, Rosenbaum JD, Rossmeisl EC (1951) “Water diuresis” produced during recumbency by the intra- venous infusion of isotonic saline solution. J Clin Invest 30: 862-868
- Kalra PR, Anagnostopoulos C, Bolger AP, Coats AJS, Anker SD (2002) The regulation and measurement of plasma volume in heart failure. J Am Coll Cardiol 39: 1901-1908
- Espinel CH (1976) The FENa test. Use in the differential diag- nosis of acute renal failure. JAMA 236: 579-581.
- Bayliss J, Norell M, Canepa-Anson R, Sutton G, Pool-Wilson P (1987) Untreated heart failure: Clinical and neuroendocrine effects of introducing diuretics. Br Heart J 57: 17-22
- Francis GS, Benedict C, Johnstone DE, Kirlin PC, Nicklas J, et al. (1990) Comparison of neuroendocrine activation in pa- tients with left ventricular dysfunction with and without con- gestive heart failure: A substudy of the studies of Left Ventric- ular Dysfunction (SOLVD). Circulation 82: 1724-1729
- Johnson W, Omland T, Hall C, Lucas C, Myking OL, et al. (2002) Neurohormonal activation rapidly decrease after intra- venous therapy with diuretics and vasodilators for class IV heart failure. J Am Coll Cardiol 39: 1623-1629
- Mentz RJ, Stevens SR, DeVore AD, Lala A, Vader JM, et al. (2015) Decongestive strategies and renin-angiotensin-aldo- sterone system activation in acute heart failure. JACC Heart Fail 3: 97-107.
- Nijst P, Verbrugge FH, Martens P, Bertrand PB, Dupont M, et al. (2017) Plasma renin activity in patients with heart failure and reduced ejection fraction on optimal medical therapy. J Renin Angiotensin Aldosterone Syst 18: 1-9.
- Packer M (1985) Is the renin-angiotensin system really un- necessary in patients with severe chronic heart failure: The price we pay for interfering with evolution. J Am Coll Cardiol 6: 171-173.
- Gupta S, Neyses L (2005) Diuretic usage in heart failure: A continuing conundrum in 2005. Eur Heart J 26: 644-649.
- Verbrugge FH, Tang WHW, Mullens W (2015) Renin-angio- tensin-aldosterone system activation during decongestion in acute heart failure: Friend or foe? JACC Heart Fail 3: 108- 111
- Hanberg JS, Rao V, Ter Maaten JM, Laur O, Brisco MA, et al. (2016) Hypochloremia and diuretic resistance in heart failure: Mechanistic insights. Circ Heart Fail 9: e003180.
- Grodin JL (2016) Pharmacologic approaches to electrolyte abnormalities in heart failure. Curr Heart Fail Rep 13: 181- 189.
- Martens P, Dupont M, Verbrugge FH, Damman K, Degryse N, et al. (2019) Urinary sodium profiling in chronic heart failure to detect development of acute decompensated heart failure. JACC Heart Fail 7: 404-414.
- Pao AC, Chertow GM (2014) Urine electrolyte composition and diuretic therapy in heart failure: Back to the future? Circ Heart Fail 7: 697-698.
- Kobayashi M, Stienen S, Ter Maaten JM, Dickstein K, Sa- mani NJ, et al. (2020) Clinical determinants and prognostic implications of renin and aldosterone in patients with symp- tomatic heart failure. ESC Heart Fail 7: 953-963.
- Kataoka H (2020) Proposal for new classification and prac- tical use of diuretics according to their effects on the serum chloride concentration: Rationale based on the “chloride the-ory”. Cardiol Ther 9: 227-244.
- Benedict CR, Johnstone DE, Weiner DH, Bourassa MG, Bit- tner V, et al. (1994) Relation of neurohumoral activation to clinical variables and degree of ventricular dysfunction: A re- port from the Registry of Studies of Left Ventricular Dysfunc- tion. J Am Coll Cardiol 23: 1410-1420.
- Volpe M, Magri P, Rao MA, Cangianiello S, DeNicola L, et al. (1997) Intrarenal determinants of sodium retention in mild heart failure: Effects of angiotensin-converting enzyme inhi-bition. Hypertension 30: 168-176.
- Damgaard M, Norsk P, Gustafsson F, Kanters JK, Christensen NJ, et al. (2006) Hemodynamic and neuroendocrine responses to changes in sodium intake in compensated heart failure. Am J Physiol Regul Integr Comp Physiol 290: R1294-R1301.
- Galve E, Mallol A, Catalan R, Palet J, Méndez S, et al. (2005) Clinical and neurohumoral consequences of diuretic with- drawal in patients with chronic, stabilized heart failure and systolic dysfunction. Eur J Heart Fail 7: 892-898.