
Toxicology and Applied Pharmacology Insights(TAPI)
ISSN: 2641-0451 | DOI: 10.33140/TAPI

Research Article - (2018) Volume 1, Issue 1
Pharmacokinetics and Biological Effects of Ferromagnetic Nanocomposite in Rats with Sensitive and Ddp-Resistant Guerins Carcinoma
2Chuiko Institute of Surface Chemistry, NAS of Ukraine, Kyiv, Ukraine
Received Date: Mar 04, 2018 / Accepted Date: Mar 12, 2018 / Published Date: Apr 24, 2018
Copyright: ©Copyright: ©2018 Hayrapetyan DB, et al. This is an open-access article distributed under the terms of the Creative Commons Attribution License, which permits unrestricted use, distribution, and reproduction in any medium, provided the original author and source are credited.
Abstract
Aim: To study nanocomposite-based conjugate of ferromagnet and cisplatin pharmacokinetic parameters and its therapeutic pathomorphosis in rats with sensitive and DDP-resistant Guerin’s carcinoma.
Material and Methods: The female Wistar rats with sensitive and DDP-resistant Guerin’s carcinoma received a nanocomposite-based conjugate of a ferromagnet and DDPonce at dose 3.5mg of DDP/kg intraperitoneally. All animals were anesthetized and samples of blood, tumour, liver and kidneys were collectedat 0.25, 0.5, 1, 3, 6 and 24h after the injection. Deposition of iron and platinum were measured using atomic absorption spectroscopy, AUC was calculated by trapezoidal method.
Results: In both sensitive and resistant strains of Guerin’scarcinonma, maximum concentriation of Pt in tumor tissue and blood serum was measured after at 1h after ingection of a nanocomposite-based conjugate of a ferromagnet and DDP. Pharmacokinetic studies found that agent accumulated 2.6 times more intensely in the DDP-resistanttumor tissue rather in sensitive. Introduction of studied agent in the therapeutic regimen leads to inhibiti on of the growth of DDP-resistant Guerin’scarcinoma, which is accompanied by the appearance of signs of medical pathomorphosis.
Conclusion: Pharmacokinetic studies have established that ferromagnetic nanocomposite accumulates more intensively in a resistant tumor and cause the most significant manifestations of therapeutic pathomorphosis compared to a sensitive tumor
Keywords
Resistance, Ferromagnetic Nanocomposite, Pharmacokinetics, CisplatinAbbreviations
DDP – cisplatin, S – sensitive Guerin–s carcinoma strain, R – DDP-resistant Guerin’s carcinoma strain, platinum – Pt, iron - Fe
Introduction
One of the main problems of modern oncopharmacology is low selective efficiency and high systemic toxicity of anticancer drugs. Side effects in the treatment of cancer patients are often a limiting factor in therapy and can cause complications, which lead to lethal consequences in more than 20% of cases [1-3]. An active search of approaches to increase the selectivity of cytostatics and reduce their toxicity to organs and tissues that are not affected by the tumor has resulted by a new generation of targeted drugs based on humanized monoclonal antibodies [4-6].
However, the optimization of cytostatic therapy by the use of modern biotechnology does not allow to reduce the toxicity of the most common drugs and to offer methods to overcome the key problem of modern clinical oncology - resistance of tumors to antitumor drugs [7,8]. The formation of resistance to different types of cytostatics involves complex and numerical mechanisms associated with thedecrease of drugs accumulation in malignant cells and with the enhancement of their removal from cells, the activation of complex detoxification systems, repair of damaged DNA, cell deviation from the inclusion of apoptotic program etc. [9-12]. These processes significantly affect the change in the cytostatics pharmacokinetics, in particular, their bioavailability, and, consequently, therapeutic efficacy. Our previous studies have shown that a change in the pharmacokinetics of cisplatin (DDP) can achieve a significant reduction in its toxicity and increase selectivity [13].
Recent studies have shown the significant role of metal-containing proteins and their receptors in the processes of pharmacodynamics and biotransformation of DDP and in the mechanisms of formation of cell resistance to this cytostatic [14-17]. It has been established that during the development of cancer cells resistance the level of merging the Fe2+ -containing compounds increases significantly due to a significant increase in the level of transferrin and its receptors, as well as heavy and light ferritin chains [15]. This allowed us to begin the search for exogenous factors of DDPpharmacocorrection, as one of the most common drug in cancer patients chemotherapy [18,19]. Attracting nanotechnologies has made it possible to create a nanocomposite - a new medicine based on a conjugate ferromagnet and cisplatin (Feroplat®) [20].
In in vivo experiments on ascitic models of Ehrlich and L1210 carcinomas and solid tumors of carcinosarcoma Walker-256 and Guerin’s carcinoma we have shown that the antitumor activity of Feroplat®exceeds the efficacy of DDP. At the same time, the toxicity of the nanocomposite to the target organ cells was much lower compared to the effect of DDP itself [21-23].
Taking into account the above, in order to find out the mechanisms underlying the increase of selectivity and decrease of toxic effects of DDP, we have conducted a study of the pharmacokinetics of Feroplat®in animals with sensitive (S) and DDP-resistant (R) Guerin’s carcinoma
Materials and Methods
Feroplat® synthesis
Synthesis of Feroplat® was carried out by a liquid-phase method, based on the co-precipitation of two- and trivalent iron salts by aqueous ammonia solution [24].
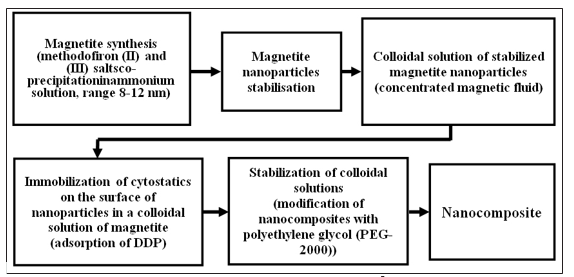
Figure 1: Scheme of ferromagnetic nanocomposite (Feroplat®) obtaining technology
The DDP adsorption onthe surface of the nanoparticles of the magnetic fluid was carried out for the Fe O /oleate Na (magneticfluid) system. In order to increase stability and reduce aggregation of particles, the resulting magnetic fluid with adsorbed cytostatics was additionally modified with polyethylene glycol (PEG-2000).
At each stage of synthesis, the physical, chemical and magnetic properties of the developed nanocomposite were monitored. The obtained nanoparticle size distributions made it possible to characterize the synthesized nanocomposite as a monodispersionwith the size of 30-40 nm. The concentration of Fe3O4 in the nanocompositewas determined using atomic emission spectrometry method and was3 mg/ml and the concentration of DDP – 0.4 mg/ml.
In vivo study
The study was performed on 60 female Wistar rats with body weight of 145 - 155 g according to the International Guidelines of Work with laboratory Animals approved by Bioethics Committee of R.E. Kavetsky IEPOR NASU (Kyiv, Ukraine). Guerin’scarcinomas(sensitive and DDP-resistant strains) were transplanted subcutaneously intotheinterscapular region by injection of 0.5 ml of tumor cell suspension (2x10⁶ cells per animal).All animals werekeptintemperature-controlled,sterilizedanimalquarte rsunder a 12 h light:12 h darkcycle.
Pharmacokineticsand bioavailability study design
To study the pharmacokinetics of Feroplat®, the animals weredivided into 2 groups: rats with sensitive and DDP-resistant Guerin’s carcinoma. The tumor was transplanted as described above. The intraperitoneal Feroplat® dose was 3.5 mg of DDP/kg body weight. At time points of 0.25 h, 0.5 h, 1 h, 3 h, 6 h and 24 h after injection, the animals were withdrawn from the experiment and samples of blood, tumor, liver, and kidneys were taken.
The bioavailability of Feroplat®, as well as the degree of accumulation of Pt and iron in the serum, tumor tissue, liver and kidneys of rats with sensitive and DDP-resistant variants of Guerin’s carcinoma after a single intraperitonealadministration of Feroplat®, were studied on an atomic absorption spectrometer C-115M1 (Selmi, Ukraine) with an electrothermal atomizer Graphite-2 at lamps with appropriate wavelengths (λPt = 265.7 nm, λFe = 248.3 nm). For this purpose, samples of the investigated biological tissues were transferred to a mineralized form by dry combustion [25].
The area under the pharmacological curve AUC was determined by the trapezoidal rule using the formula:
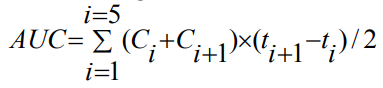
where ti –time of determination of the agent concentration in the animaltissue/blood serum, calculated from the time of drug administration;
Ci– agent concentrartion at time point ti
Therapevtic experiment design
Application of DDP (Cisplatin-Ebewe®) and Feroplat® started from the 9th day after tumor transplantation. In therapeutic experiments, animals were devided into 6 groups according to the agent type (Table 1).
Table 1: Study design and regime specification
|
Strain |
Number of animals |
Tested agent |
Code |
Regime |
|
Sensitive Guerin’s carcinoma |
10 |
Control |
1 |
0.5 ml of 199 medium (Sigma- Aldrich, USA) |
|
10 |
Cisplatin- Ebewe® |
2 |
i.v. 5 times (once in 2 days); 1.2 mg/ kg of weigh |
|
|
10 |
Feroplat® |
3 |
i.v.5times (once in 2 days); 1.2 mg/kg of weight of DDP; nanocomposite particlesize30 - 40 nm |
|
|
DDP-resistant Guerin’s carcinoma |
10 |
Control |
4 |
0.5 ml of 199 medium (Sigma- Aldrich, USA) |
|
10 |
Cisplatin- Ebewe® |
5 |
i.v.5times (once in 2 days); 1.2 mg/kg of weigh |
|
|
10 |
Feroplat® |
6 |
i.v. 5times (once in 2 days); 1.2 mg/kg of weight of DDP; nanocomposite particle size 30 - 40 nm |
2 days after the last injection of DDP or Feroplat® the euthanasia of anaesthetized experimental animals was performed. The tumor mass (in grams) was determinedon the electronic balance. Tumor volume was calculated by theformula:
V=a•b•c•π/6,
where:a, b, c – orthogonal parameters of tumor.
Percentage of tumor growth inhibition was determined by the
formula:
Inhibition % = (Control - Experiment)/ Control x 100%, Where Control and Experiment are indicators of tumor mass or volume in the control and therapeutic groups of animals.
Biochemical Analysis of Blood Serum
After animals’euthanasia, blood sample was put in Heparin tubes for biochemical analysis of blood serum. The levels of urea, creatinine, and total bilirubin, activities of alanine aminotransferase, aspartate aminotransferase, alkaline phosphatase, and gammaglutamyltranspeptidase were determined usingthe biochemical analyzer (Chem Well, Awarenes Technology, USA).
Morphological Studies
Small tissue samples from the organs and tumor were fixed in 8% neutral buffered formalin, embedded in paraffin, sectioned at 5-6 mkm thick and stained with haematoxylin-eosin using standard histopathological techniques. The sections were examined by light microscopy (Primo Star, Carl Zeiss, Germany).
Statistical Analysis
All values were expressed as mean ± SD. Results were tested for significance with one-way analysis of variance (STATISTICA, v.6). P-values < 0.05 were considered statistically significant. Differences were consideredreliable at P< 0.05.
Results and Discussion
Pharmacokinetic parameters (AUC24 and Cmax) of platinum (Pt) and iron (Fe) in serum, tumor tissue, and organs of experimental animals with sensitive (S) and DDP-resistant (R) Guerin’s carcinoma strains are presented in Table 2.
Table 2: Pharmacokinetic parameters of iron (Fe) and platinum (Pt) in blood serum, tumor and organs of experimental animals with sensitive (S) and DDP-resistant (R) Guerin’s carcinoma(n = 10)
|
|
Strain |
AUC24 (Pt), μg×h/ml(g) |
Cmax(Pt), μg/ml |
AUC24 (Fe), μg×h/ml(g) |
Cmax(Fe), μg/ ml |
|
Blood serum |
S |
54.1±14.9 |
7.3±2.4 |
189.0±32.9 |
9.7±1.9 |
|
R |
313.2±57.0* |
28.5±1.9* |
256.5±36.6 |
8.4±0.9 |
|
|
Tumor tissue |
S |
46.5±12.1 |
7.0±0.7 |
244.3±38.8 |
26.9±3.1 |
|
R |
193.9±31.3* |
18.6±1.7* |
388.8±14.3* |
30.5±2.4 |
|
|
Liver |
S |
152.7±15.0 |
10.2±0.9 |
494.8±66.4 |
30.1±4.1 |
|
R |
327.6±64.5* |
21.1±31* |
500.2±108.7 |
24.6±5.0 |
|
|
Kidney |
S |
78.4±20.8 |
6.95±0.7 |
171.2±39.2 |
17.2±2.1 |
|
R |
213.7±33.1* |
12.0±1.3* |
336.0±54.0* |
10.9±2.5 |
*P < 0.05 compared with the sensitiveGuerin’s carcinoma
Table 2 shows that AUC24 (Pt) in serum from rats with a resistant tumor was 5.8 times higher than in animals with sensitive strain. In the resistant tumors, this parameter was 4.2 times higher (P<0.05) compared with the sensitive strain. Similarly, in animals with resistant tumors, in comparison to sensitive tumor bearing rats, AUC24 (Pt) in the liver and kidneys were 2.1 and 2.7 times higher, respectively.
We found no reliable difference between AUC24 (Fe) in serum and liver from animals with sensitive and resistant tumors (Table 2). However, AUC24 (Fe) in the kidney and tumor increased in animals with resistant carcinoma: in 1.6 (tumor) and 2 (kidneys) times compared with animals with sensitive tumors (P<0.05).
A significant difference between the AUC24(Fe) in DDP-resistant Guerin’s carcinoma may indicate a higher bioavailability of Feroplat® for this tumor strain. At the same time, we observed the elevated level of AUC24 (Fe) in the liver and kidney of animals with resistant strains. An increase in the maximum concentration of Cmax (Pt) (Table 2) can be explained by the shifts in various sectionsof the iron exchange that occur in animals with a resistant tumor [26]. Moreover, it is known that with the development of drug resistance, malignant cells more actively absorb iron ions [27].
The dynamics of the Ptconcentrationchange in the blood serum of experimental animals after a single intraperitonealFeroplat®
introduction is depicted on Fig.2.

Figure 2: Dynamics of the blood serum Pt concentration changes
Fig. 2 shows that the Ptbioavailability is much higher for animals with resistant variant of Guerin’s carcinoma, which contributed to the higher accumulation of this element in the tumor, kidneys, and liver. The saturation curves for both the sensitive and the resistant strains of Guerin’s carcinoma reache a maximum 1 hour after the Feroplat® introduction. It is important to note the multidirectional dynamics of iron accumulation in rats with resistant variant of Guerin’s carcinoma (Fig. 3). The maximum concentration was observed 1 hour after the Feroplat® administration. At the same time, in blood serum of animals with sensitive Guerin’s carcinoma, the increase in iron concentration began only 3 hours after the Feroplat® introduction, which may indicate the significant differences in the needs of Fe ions, and the peculiarities of its depositing in animals with different DDP sensitivitytumors.
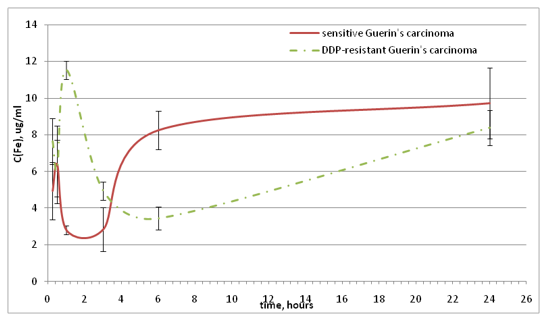
Figure 3: Dynamics of the blood serum iron concentration changes
Curves of tumor tissue Pt saturation reach maximum 1 hour after Feroplat® injectionin both sensitive and DDP-resistant Guerin’s carcinoma (Fig. 4).However, it is evident that the saturation rate for the resistant tumor strain is almost 4 times higher compared to the sensitive strain (Table 2). Over time, the Ptconcentration synchronously decreased,howeverin the resistant strain of Guerin’s carcinoma, it remained significantly higher throughout the study period.
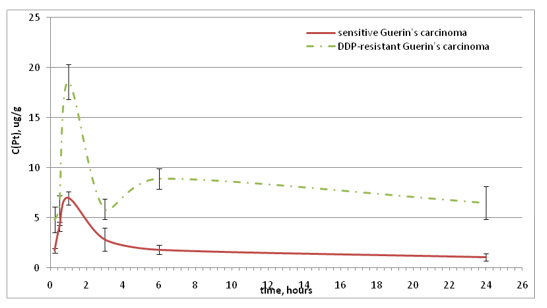
Figure 4: Dynamics of the tumor tissue Pt concentration changes
Concerning the accumulation of Fe ions in the tumor tissue, thisindex variedsimilarly to its kinetics in blood serum. In animals with DDP-resistant Guerin’s carcinoma, iron faster got into the tumor, the saturation curve reachedits maximum 30 minutes after the Feroplat® introduction (Fig. 5). While in the case of the sensitive strain, the maximum of the saturation curve was observed only 3 hours after the drug introduction.
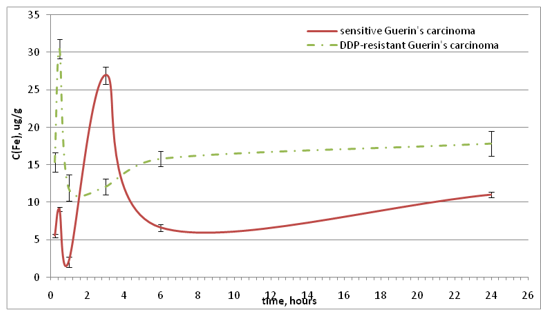
Figure 5: Dynamics of the tumor tissue iron concentration changes
Regarding the accumulation of Pt in the liver, in tumor-bearing animals of both strains of Guerin’s carcinoma, the same behavior of the saturation curve was observed, which reacheditsmaximum 1 hour after the Feroplat® introduction (Fig. 6), however, the elimination dynamics in animals with DDP-resistant Guerin’s carcinoma was significantly higher.
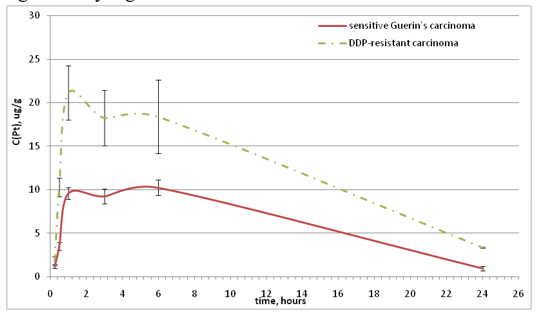
Figure 6: Dynamics of the liverPt concentration changes
In animals with both Guerin’s carcinoma strains the iron saturation curves in the liver were similar and were characterized by a slight increase 30 minutes after the Feroplat® introduction and reached maximal values 6 hours after injection (Fig. 7).
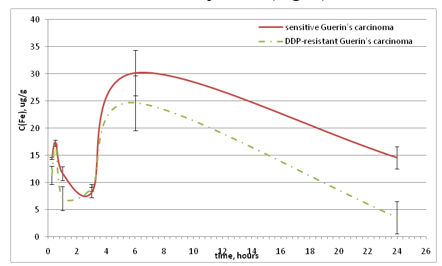
Figure 7: Dynamics of the liver iron concentration changes
It is known that the effectiveness of antitumor action of DDP is substantially limited to its nephrotoxicity, which directly correlates with both the maximum concentration of Pt in the kidneys and the amount of drug that passes through them. The analysis of Ptbiodistribution in tkidneys showed that the Ptaccumulationwas higher inrats with DDP-resistant Guerin’s carcinoma (Table 2). For animals with both strains of Guerin’scarcinomaitwaas typical the presence of Ptsaturation peak 30 and 180 minutes after the Feroplat® introduction(Fig. 8).
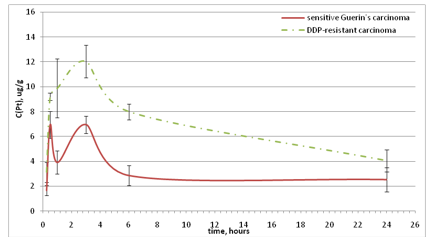
Figure 8: Dynamics of the kidneyPt concentration changes
In animals with sensitive Guerin’s carcinoma the maximum iron accumulation in the kidneys was observed 30 minutes after the Feroplat® introduction (Fig. 9), followed by its decrease. While in animals with DDP-resistant Guerin’s carcinoma, the maximum of the saturation curve in the kidneys was observed only 6 hours after the nanocompositeintroduction, which may contribute to optimizing even modern chemotherapeutic regimens aimed atnephrotoxicityreducing.
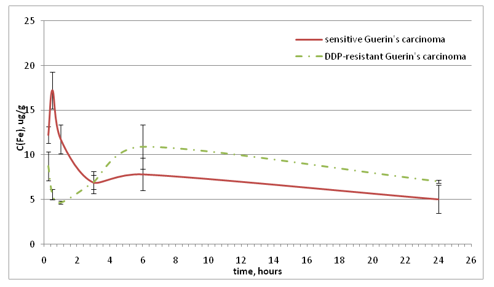
Figure 9: Dynamics of the kidney iron concentration changes
It is known that the targets for nanocomposites are biological macromolecules (DNA, RNA, Proteins), biological membranes, and oxidation-reduction systems, which damage can cause thedysfunction of several organs and systems[28].
As it was previously reported [21], the impact of DDP and Feroplat® leads to a significant increase in serum creatinine levels in experimental animals with sensitive Guerin’s carcinoma. Treatment of DDP-resistant Guerin’s carcinoma animals with Feroplat® and Cisplatin-Ebewe® a comparison drug) also resulted in the serum creatinineincrease (Table 3). However, no significant differences were found between the animals receiving DDP and Feroplat® in relation to this index. Regarding other studied biochemical parameters, none differences between the groups were noticed (Table 3).
Table 3: Blood serum biochemical indexesof rats with DDP-resistant Guerin’s carcinoma after Cisplatin-Ebewe® and Feroplat® introduction (n = 10)
|
|
Blood serum biochemical indexes |
||||||
|
|
Urea level,mmol/l |
Creatininelevel,Μmol/l |
Aspartate aminotransferase activity, unit/l aspartate |
Alanine aminotransferase activity, unit/l alanine |
Alkaline phosphatase activity,unit/l |
Gamma glutamyl transpeptidase activity, unit/l |
Total bilirubin level, μmol/l |
|
Control |
16.8 ± 3.0 |
40.2 ± 2.7 |
505.0 ± 50.0 |
60.6 ± 3.0 |
300.5 ± 40.5 |
8.3 ± 1.0 |
10.2 ± 0.9 |
|
Cisplatin-Ebewe® |
19.5 ± 3.2 |
70.0 ± 7.0 * |
512.0 ± 65.0 |
57.7 ± 4.0 |
285.0 ± 42.3 |
8.5 ± 0.9 |
11.0 ± 1.1 |
|
Feroplat® |
17.7 ± 3.0 |
63.1 ± 6.3 * |
490.0 ± 60.0 |
49.0 ± 3.7 |
295.5 ± 45.0 |
8.0 ± 1.0 |
10.6 ± 0.8 |
Note: * - the indicator is significantly different from that in the control(P< 0,05).
Thus, according to the blood biochemical indexes, Feroplat® exhibitedtheside effect similar to that of Cisplatin-Ebewe® .
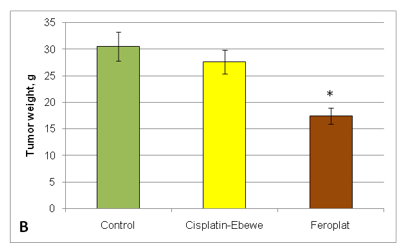
At the next stage of the study, it was explored how the pharmacokinetics of Feroplat® may affect its antitumor activity. The antitumor effect of Feroplat® on sensitive Guerin’s carcinoma is shown in Table 4. Cisplatin-Ebewe® and Feroplat® virtually almost equally inhibited the growth of sensitive tumors. However, in the therapeutic experiments with DDP-resistant Guerin’s carcinoma, Cisplatin- Ebewe® had virtually no effect on tumor growth, while Feroplat® led to the tumor growth inhibition by 41% of volume and by 43% of weight (Fig. 10).
Table 4: Antitumor activity of Feroplat®and DDP on sensitive Guerin’s carcinoma (n = 10)
|
Animal group |
Tumor volume |
Inhibition, % |
|
Control |
(sm3) |
- |
|
Cisplatin-Ebewe® |
18.5±1.4 |
88 |
|
Feroplat® |
2.2±0.5* |
90 |
|
|
1.9±0.3* |
|
Note:*P<0.05 compared with the control
Figure 10: Antitumor activity of Feroplat® and Cisplatin-Ebewe® (A - by volume: B - by weight) on DDP-resistant Guerin’s carcinoma (n = 10).

Studies of the morphological features of the DDP-resistant Guerin’s carcinoma architectonics in the rats from control group that were not exposed to Cisplatin-Ebewe® or Feroplat® showed that the major part of the tumors were thecells characterized by moderately pronounced polymorphism with a solid growth pattern. The cells had elongated or rounded form, the cytoplasm with signs of basophilia, large nuclei, some of which were located eccentrically (Fig. 11A). Often there were figures of mitotic division. There were small mosaic patterns of the non-fibrotic and necrotic cells death (Fig. 11B).
Thecharacteristic morphological distinction ofDDP-resistant Guerin’s carcinoma treated with Cisplatin-Ebewe® was that, on the background of the overall structure of the tumor, which did not differ from the control, certain cells with signs of treatment pathomorphism were detected (Fig. 11C). Along with this, there were the necrosis and necrobiosis fields of different sizes (Fig. 11 D). It should be noted that in all tumors exposed to Cisplatin-Ebewe® , a large number of mitoses, including pathological, were detected
Feroplat® caused more pronounced variety of the spectrum and the degree of manifestation of therapeutic pathomorphosis. Along with the formation of giant cells, the cytomorphological effects in the tumors of animals treated with Feroplat® were characterized by the fact that among the layers of compactly located cells that were almost identical to the cells obtained from control animals, individual patterns were determined, as well as significant sheets of the tumor cells with pronounced signs of hydropic degeneration of the cytoplasm and nuclei. With a large number of these cells, honeycomb look-alike structures were formed (Fig. 11E).
We found thesignificant decrease in the number of mitoses figures. Along with this, extensive fields of necrobiotic cell death, necrosis, theremnantsof dead apoptotic cells were determinedin the various sites of tumors. In some animals, thin-walled blood capillaries were found among dystrophic and non-fibrotically altered tumor cells, filled with blood, and we observed extensive hemorrhages (Fig. 11 F, 11 G). Thedistinctive feature of the tumors after Feroplat® introduction was that in some cells along with dead cells we found the phenomenon of the fibrous organization of the structurally altered tumor tissue which expressiveness had different degree(Fig. 11H, 11I).
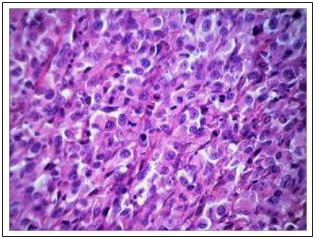
Figure 11A: Thesolid character of tumor growth and the tumor cells compact location of DDP- resistant Guerin’s carcinoma (control) (×200)
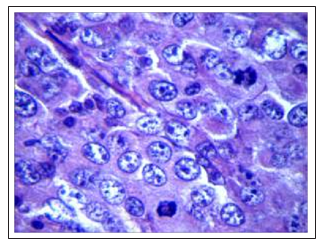
Figure 11B: Figures of mitoses, including atypical, in tumor cells of DDP-resistant Guerin’s carcinoma (control) (×1000)
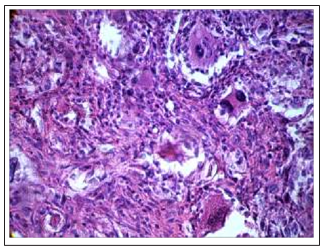
Figure 11C: Formation of "giants of medical pathomorphosis" in the DDP-resistant Guerin’scarcinomaunderthe Cisplatin-Ebewe® influence (×200)
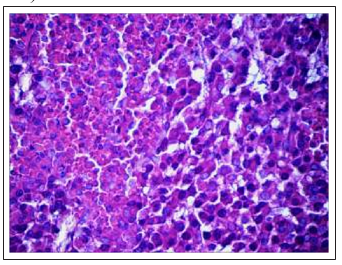
Figure 11D: Pattern of tumor cells with signs of necrobiosis (on the right) was bordered by a pattern of necrotic cells (on the left). Action of Cisplatin-Ebewe® (×200)
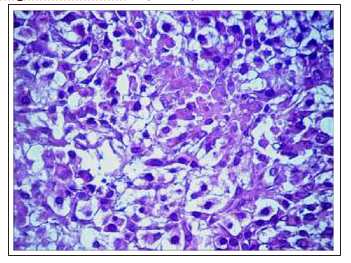
Figure 11E: Formation of honeycomb look-alike structures as a consequence of vacuolo-hydroponic dystrophy of DDP-resistant Guerin’scarcinoma cells under the Feroplat®influence (×200).
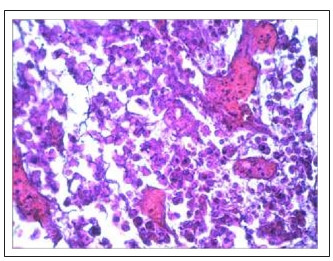
Figure 11F: Among the dystrophically altered cells of DDP-resistant Guernine carcinoma, there were a lot ofthin-walled blood capillaries filled with blood after the Feroplat® influence (×200)
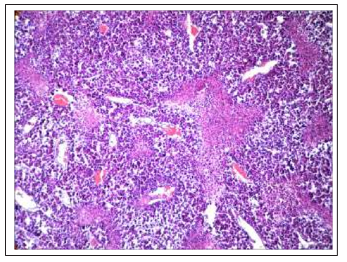
Figure 11G: Intervention of strains and patterns of tumor cells in the state of nebrobiosis and necrosis with a large number of delated capillaries filled with blood undertheFeroplat® influence (×100).
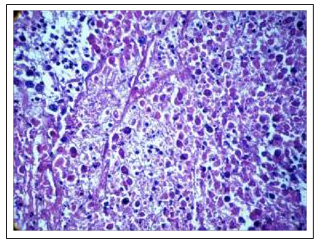
Figure 11H: Initial phenomena of fibrous organization of the center of dead cells, including apoptosis after the Feroplat® influence (×100).
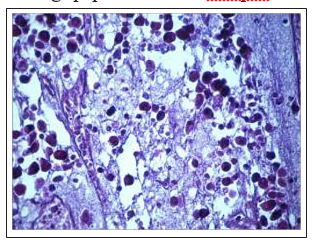
Figure 11I: Expressed signs of substituting necrobioticalo broken cells with soft-fibrous connective tissue after the influence of Feroplat® (×200)
Fig.11 Changes in the cytoarchitectonics of DDP-resistant Guerin’s carcinoma under the influence of Cisplatin-Ebewe and Feroplat® (coloring with hematoxylin and eosin).
Along with the pronounced signs of pathomorphosiscausedbyFeroplat® among the necrotic zones, there were recovery processes, namely, the elements of the fibrous organization inthetumorfocus.
Thus, the resulted of the conducted studies have shown that significant differences in the pharmacokinetics of Feroplat®contributed to the selectivity of its accumulation in the organs and tissues, thatallowedto achieve the significant antitumor effect in the case of DDP-resistant Guerin’s carcinoma.
Conclusion
1. Pharmacokinetic studies have shown that the ferromagnetic nanocomposite (Feroplat®) is more intensively accumulated in DDP-resistant tumors compared with the sensitive Guerin’s carcinoma. Its’ maximum concentration in the resistant tumor was 2.6 times higher than in the sensitive strain. This leads to the fact that Feroplat® exhibits a higher antitumor activity ontheresistant Guerin’s carcinoma.
2. Under the Feroplat® influence the most significant cytomorphological effects and manifestations of signs of treatmentpathomorphosis are observed in cells of theDDP- resistant Guerin’s carcinoma.
3. Thesignificant increase in the antitumor effect of Feroplat® in animals with DDP-resistant Guerin’s carcinoma may be associated not only with increased bioavailability but also with the involvement of its additional mechanisms associated with Fe ions as a source of oxidative stress in the tumor.
References
- Gibbs L, Bowen R, Makris A, Beresford M (2016) Preferences for Chemotherapy Side-effect Profiles in Breast Cancer–The View of Oncologists. Clinical Oncology 28: e3-e4.
- Tao JJ, Visvanathan K, Wolff AC (2015) Long term side effects of adjuvant chemotherapy in patients with early breast cancer. The Breast. 24: S149-S153.
- Anandavadivelan P, Brismar TB, Nilsson M, Johar AM, Martin L (2016) Sarcopenic obesity: a probable risk factor for dose limiting toxicity during neo-adjuvant chemotherapy in oesophageal cancer patients. Clinical Nutrition 35: 724-730.
- Yang Y (2015) Cancer immunotherapy: harnessing the immune system to battle cancer. The Journal of clinical investigation 125: 3335-3337.
- Mahoney KM, Rennert PD, Freeman GJ (2015) Combination cancer immunotherapy and new immunomodulatory targets. Nature reviews Drug discovery 14: 561.
- Carvalho S, Levi-Schaffer F, Sela M, Yarden Y (2016) Immunotherapy of cancer: from monoclonal to oligoclonal cocktails of anti-cancer antibodies: IUPHAR Review 18. British journal of pharmacology 173: 1407-1424.
- Brys AK, Gowda R, Loriaux DB, Robertson GP, Mosca P (2016) Nanotechnology-based strategies for combating toxicity and resistance in melanoma therapy. Biotechnology advances 34: 565-577.
- Bertrand N, Wu J, Xu X, Kamaly N, Farokhzad OC (2014) Cancer nanotechnology: the impact of passive and active targeting in the era of modern cancer biology. Advanced drug delivery reviews 66: 2-25.
- Ramos P, Bentires-Alj M (2015) Mechanism-based cancer therapy: resistance to therapy, therapy for resistance. Oncogene 34: 3617.
- Chekhun VF (2010). Drug resistance of tumors: from formation mechanisms to ways of overcoming, in: Chekhun VF (Eds.), Oncology. Selected lectures for students and doctors: edited by (inukrainian). Kyiv: Health of Ukraine, 569-582.
- Todor IN, Lukianova NY, Tymovska YA, Pivnyuk VM, Chekhun VF 2013.The effect of liposomal doxo rubic inform on drug resistant tumorpheno type. Onkolohiia (inukrainian) 15: 279-285.
- Chekhun VF, Lukyanova NYu, Kovalchuk OV, Tryndyak VP, Pogribny IP (2007) Epigenetic profiling of multidrug-resistant human MCF-7 breast adenocarcinoma cell reveals novel hyper- and hypomethylatedtargets. Mol. CancerTher 6: 1089-1098.
- Сhekhun VF, Pelkis PF, Serebryakova EA, Singin AC, Sokolova IS, et al. (1990) On certain mechanisms decreasing the toxic action of cis-platinum under its combined administration to mice the K-2- 9 preparation to mice with B-16 melanoma. Exp Oncology 12: 68-71.
- Chekhun VF, Spylevaya SI (2010) The role of endogenous iron in the formation of tumor sensitivity to anti cancer therapy. Oncology issues 569: 251-261.
- Chekhun VF, Lukyanova NYu, Burlaka AP, Bezdenezhnykh NA, Shpyleva SI, et al. (2013) Iron metabolism disturbances in the MCF-7 human breast cancer cells with acquired resistance to doxorubicin and cisplatin. Intern J Oncology 43: 1481-1486.
- Chekhun VF, Lozovska YuV, Burlaka AP, Lukyanova NYu, Todor IN, et al. (2014) Peculiarities of antioxidant system and iron metabolism in organism during development of tumor resistance to cisplatin. Exp. Oncology. 36: 196-201.
- Florea AM, Büsselberg D (2011) Cisplatin as an anti-tumor drug: cellular mechanisms of activity, drug resistance and induced side effects. Cancers 3: 1351-1371.
- Chekhun VF, Yurchenko OV, Naleskina LA, Demash DV, Lukianova NYu, et al. (2013) In vitro modification of cisplatin cytotoxicity with magnetic fluid. Exp. Oncology 35: 15-19.
- Chekhun V, Lukianova N, Demash D, Borikun T, Chekhun S, et al. (2013) Manifestation of key molecular genetic markers in pharmacocorrection of endogenous iron metabolism in MCF-7 and MCF-7/DDP human breast cancer cells. Cell Bio 3: 217-227.
- [FEROPLAT]. Certificate of Ukraine for Marks for Goods and Services No. 215992 UA. [Bull. PromyslovaVlasnist] (Industrial Property) (2016).
- Chekhun VF, Naleskina LA, Polishchuk LZ, Todor IM, Demash DV, et al. (2013) Evaluation of biological effects of nanosystems of directed transport in experiments in vivo and their application possibilities in anti-tumor therapy. ANP 2: 145-153.
- Lukianova N Yu (2015) Experimental basis for use of ferromagnetic nanocomposite in overcoming of tumor cells resistance to cisplatin. Thesis for the doctor of biological sciences degree in speciality 14.01.07 – Oncology. – R.E. Kavetsky Institute of Experimental Pathology, Oncology and Radiobiology, National Academy of Sciences of Ukraine, Kyiv.
- Patent of Ukraine on the utility model (80767), Ð?Ð?Ð?Ð61Ð? 33/00. Method for increasing antitumor activity of cisplatin/Сhekhun VF, Lukianova NY, Todor IM, Nalieskina LA, Demash DV, Lozovska Yu V, Horbyk PP, Petranovska AL; Kavetskyi institute of experimental pathology, oncology and radiobiology of NAS of Ukraine" (UA); O.Chuiko institute of chemistry of surface of NAS of Ukraine (UA ). u201214597;aplied. 20.12.2012; publ. 10.06.2013. – Bull. â??11.
- Gorbyk PP, Dubrovin IV, Petranovska AL, Abramov NV, Usov DG, et al. (2009) Chemical construction of polyfunctional nanocomposites and nanorobots for medico-biological applications // Nanomaterials and Supramolecular Structures. Netherlands: Springer 6: 63-78.
- Khavesov I, Tsalev D (1982) Atomic absorbtion analysis. Sophia, Chemistry 141.
- Wu J, Bao L, Zhang Z, Yi X (2017). Nrf2 induces cisplatin resistance via suppressing their on export related gene SLC40A1 in ovarian cancer cells. Oncotarget 8: 93502-93515.
- Kazan HH, Urfali-Mamatoglu C, Gunduz U (2017) Iron metabolism and drug resistance in cancer. BioMetals 30: 629-641.
- Fischer-Fodo E, Miklasova N, Berindan-Neagoe I, Saha B (2015) Iron, inflammation and invasion of cancer cells. Clujul medical 88: 272.