


Research Article - (2024) Volume 9, Issue 1
Perchlorate an Emerging Contaminant in Foodstuff and Environment
Received Date: Jan 09, 2024 / Accepted Date: Jan 29, 2024 / Published Date: Feb 15, 2024
Copyright: ©Â©2024 Iftekhar Ahmed Mohammed Rafi, et al. This is an open-access article distributed under the terms of the Creative Commons Attribution License, which permits unrestricted use, distribution, and reproduction in any medium, provided the original author and source are credited.
Citation: Rafi, I. A. M., Garimella, V., Saeed. F. (2024). Perchlorate an Emerging Contaminant in Foodstuff and Environment. Adv Nutr Food Sci, 9(1), 1-7.
Abstract
Perchlorate has been categorized as a potential contaminant and is a stable, hydrophilic, anionic, chlorine-oxidized sub- stance, which is ubiquitous pollutant in various types of foodstuffs, drinking water and environment. In the past, there has been an increase in anthropogenic activities which lead to perchlorates in the Environment. They have raised great con- cerns due to potential adverse effects on human thyroid functions which have been recently categorized as a hazardous substance. Dietary intake is considered as the predominant pathway for human exposure to perchlorate. Nevertheless, data on human exposure to these hazardous chemicals remain limited and their entry into the food chain has not been clearly identified, particularly for the most vulnerable populations such as infants. In this study, 103 samples were col- lected from the local market of Dubai which includes 39 fruit and vegetables, 21 dried spices, 19 cereals & infant formula and 23 dried herbs. The levels of perchlorate were measured in these samples by using Ultra-High Performance Liquid Chromatography-Mass spectrometry Mass spectrometry (UPLC-MSMS) after extraction with 1 % v/v acetic acid in water (for water, juices) & 1 % v/v acetic acid in water and acetonitrile (for milk, infant formula, low moisture foods and fruits & vegetables. Perchlorate was detected in 28% of total measured samples and about 2% of samples were found to be non-compliant. The average mean concentrations of perchlorate were 9.3 μg/kg in fruit and vegetables, 22 μg/kg in dried spices and 22.2 μg/kg in dried herbs respectively, while perchlorate was non-detected in cereals and infant formula. The findings suggest that perchlorate contamination in the samples tested may not be an immediate health issue, yet testing for perchlorate should continuously be conducted. To the best of our knowledge, this is the first such study done at DCL for investigating perchlorate exposure in the gulf region. Consumers are advised to maintain a healthy diet and eat a variety of foods across all food groups daily.
Keywords
Perchlorate, Dubai, Contamination, Ultra-High Performance Liquid Chromatography- Mass Spectrometry Mass Spectrometry (Uplc-Ms Ms), Dubai Central Laboratory (Dcl).
Introduction
Perchlorate ion is very stable, and its salts are highly soluble in water. Perchlorate occurs naturally in the environment, has been recently categorized as a hazardous substance.
It has been reported to develop naturally from caliche deposits, but it is artificially produced in forms of such as ammonium perchlorate, potassium perchlorate, or sodium perchlorate [1].
Perchlorate is added to fireworks powder as an oxidizing agent to produce diverse colors or roaring sounds and used as an oxygen carrier in rocket propellant. In addition, perchlorate is also used as an ingredient in paints, brighteners, laundry bleach, and the detergent in liquid crystal displays manufacturing.
Perchlorate can also be formed during the degradation of sodium hypochlorite used to disinfect water and can contaminate the water supply. Water, soil, and fertilizers are potential sources of perchlorate contamination in food. Consequently, the United States Environmental Protection Agency (US EPA) has previously listed the perchlorate anion as an emerging contaminant.
It is known that perchlorate intervenes of thyroid gland that absorbs iodine by competing with iodine ion inside human body, causing problems in growth and development of infants and toddlers because it participates in regulation of a thyroid gland metabolism function. For adults, in case of consistent ingestion of Perchlorate can induce an obstacle in bone marrow.
Furthermore, perchlorate exposure could lead to disabilities in nervous system mainly manifested as intellectual deficiencies and learning disabilities (Bellanger et al. 2015).
Many countries investigated the concentrations of perchlorate in food but mostly focused on dairy products [3]. The United States Food and Drug Administration (FDA) monitored perchlorate in 775 food samples from October 2003 to September 2004 and found high perchlorate levels in 27 types of foods from all 50 states.
Additionally, studies in Korea also reported the presence of perchlorate in milk sold at a market. However, this study analyzed perchlorate in white milk only with small number of samples; therefore, further investigation is needed [4]. There is a need for more data on the presence of perchlorate in food.
In this study, UPLC-MSMS instrument from Waters is used for measuring perchlorate in fruit and vegetables, dried spices, dairy products, and dried herbs samples using simple extraction technique of the sample mixture with reconstitution solution {1 % v/v acetic acid in water (for water, juices) & 1 % v/v acetic acid in water and acetonitrile. The method was validated and developed in Dubai central laboratory to monitor the perchlorate contamination in routine samples
Materials and Methods
Chemical and Reagents
Perchlorate standard, purity ≥ 99.0% from sigma Aldrich or equivalent. Methanol, acetonitrile, formic acid and ammonium format were high performance liquid chromatography (HPLC) grade and obtained from Fisher Scientific or equivalent. Water was produced by a Milli-Q system. Argon gas supply with high purity (99.999%). Symmetry Shield RP-18 Column, 100Å, 5µm, 4.6 mm X 150 mm or equivalent.
Sample Collection
A total of 103 samples were collected from the local market of Dubai during the year 2021 to evaluate the level of perchlorate. Figure 1 shows the samples that include 39 fruit and vegetables, 22 dried spices, 19 cereals & infant formula and 23 dried herbs. Approximately 1-2 kg of samples were bought from the market and sent to the laboratory and stored properly until the analysis started.

Figure 1: Number of samples and type of samples studied.
Determination of Perchlorate
The extraction technique used in this study is a simple extraction of the sample mixture with reconstitution solution containing 1 % v/v acetic acid in water (for water, juices) & 1 % v/v acetic acid in water and acetonitrile (for milk, infant formula, low moisture foods and fruits & vegetables) in a suitable centrifuge tube. The sample mixture is sonicated, vortexed to mix well and centrifuged. Filter the sample mixture using 0.45µm hydrophobic filter in to a 2mL auto sampler vial and inject in to UPLC-MSMS. Perchlorate is determined by MRM transition in negative ionization mode.
Weigh approximately 0.5 to 2.00 g of sample in a 50mL centrifuge tube; add 5.00 mL of acetonitrile and make up the volume to 25.0mL with extraction solution (1 % v/v acetic acid in water), mix well. Sonicate the sample mixture for 15 minutes using ultrasonicate followed by 30 minutes shaking using vibramax. Centrifuge the sample mixture for 10 minutes at 5000rpm. The first 1 mL of effluent was discarded, and the subsequent filtrate was collected and filtered through a 0.45 μm hydrophobic membrane filter and injected into UPLCMS/MS. A known amount of standard is added to the sample and analysis is performed on the sample and recovery is calculated from the un-spiked and spiked samples.
To avoid cross contamination, glassware used in this study was soaked, washed and oven dried before use. Each batch of samples was processed along with a blank sample to check for potential laboratory contamination. All blanks were below detectable concentrations (limit of qualification) of the target analytes. The limit of detection (LOD) is defined as three times of signal to noise (S/N = 3), and it is 5 μg/L for perchlorate. The limit of quantitation (LOQ) is defined as ten times of signal to noise (S/N = 10), and it is 10 μg/L for perchlorate. If required, Internal standards of perchlorate were added to each sample to correct the loss of target analytes during sample preparation.
LC-MS/MS Conditions and Setup
|
Parameters |
Optimized value |
|
Capillary (kV) |
0.50 |
|
Cone (V) |
65 |
|
Extractor (V) |
5.0 |
|
RF lens (V) |
0.5 |
|
Source temperature |
150° C |
|
Desolvation temperature |
500° C |
|
Desolvation gas flow (1/hr) |
600 |
|
Collision gas flow (mL/minute) |
0.10 |
|
LM1 Resolution |
6.0 |
|
HM1 Resolution |
6.0 |
|
Ion energy 1 |
3.0 |
|
Mode |
MS-MS |
|
Entrance |
1.0 |
|
Collision |
Tune setting |
|
Exit |
0.5 |
|
LM2 Resolution |
8.0 |
|
HM2 Resolution |
8.0 |
|
Ion energy 2 |
1.0 |
|
Gain |
1.0 |
Table 2: Optimized TQD Tune Parameters for the Method and Analyzer Settings
|
Sl. No |
Analyte Name |
Parent (Da) |
Daughter (Da) |
Dwell (S) |
Cone (V) |
Collision (eV) |
|
1 |
Perchlorate (Q) |
98.4 |
82.84 |
0.05 |
70 |
12 |
|
Perchlorate (q) |
100.4 |
84.84 |
0.05 |
70 |
15 |
Table 3: MRM transitions
Q – is the ion used for quantification and q – is the ion for confirmation.
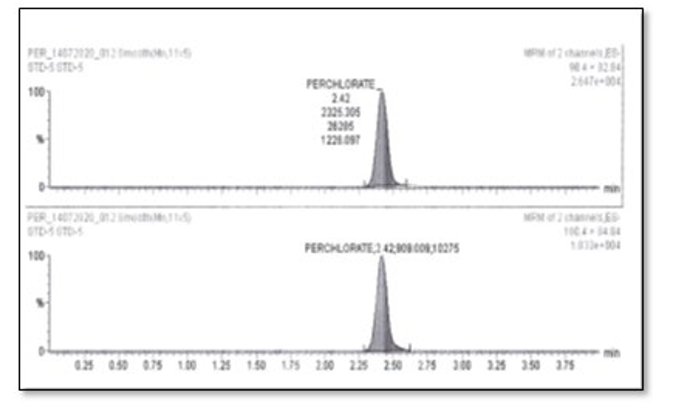
Figure 2: Chromatogram of perchlorate quantifier and qualifier
Table 3 and Figure 2 Shows the Mrm Transition of Perchlorate for Quantification and Confirmation Purpose
During instrumental analysis, 10% of the analyzed samples were determined in triplicate to check the stability of the instrument, and relative standard deviation (RSD) was less than 10.0%.
Figure 3 shows the calibration curves for quantifying perchlorate contents in samples ranging from 0.50 μg/L to 25 μg/L with correlation coefficients greater than 0.999. The accuracy of the analytical method was tested either by analysis of internationally certified reference material or participating in proficiency testing material with every batch of samples. Mean recoveries from spikes and recovery ranged from 70 to 130%.

Figure 3: Calibration Curve: Linearity Range 0.5 To 25 Ppb
Results and Discussion
Table 4 and figure 4 shows the average mean concentrations perchlorate in different food samples studied. Average mean concentrations of perchlorate were 9.3 μg/kg in fruit and vegetables,22 μg/kg in dried spices and 22.2 μg/kg in dried herbs respectively, while perchlorate was non-detected in cereals and infant formula.
|
S.NO |
Sample type |
Total samples Tested |
Number of samples detected |
% Samples detected |
Average conc of perchlorate(µg/kg) |
|
1 |
Fruits & vegetables |
39 |
8 |
21 |
9.3 |
|
2 |
Dry spices |
22 |
10 |
48 |
22 |
|
3 |
Cereals and infant formula |
19 |
0 |
0 |
0 |
|
4 |
Dried herbs |
20 |
10 |
50 |
22.2 |
Table 4: Average Concentration of Perchlorate in Different Samples
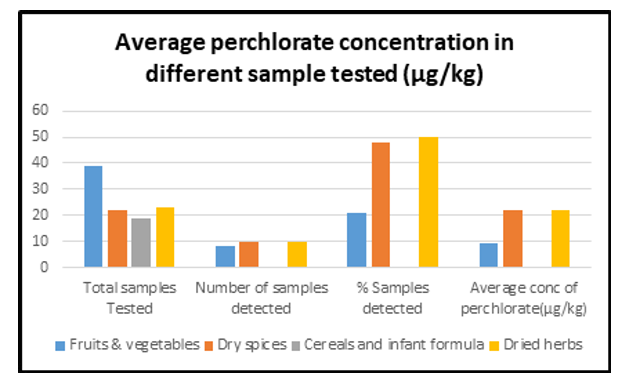
Figure 4: Graphical Representation of Average Concentration of Perchlorate in Different Samples Studied
Out of 103 food samples tested for perchlorate, it was found that perchlorate was detected in 28% of total measured samples and about 2% of samples were found to be unsatisfactory
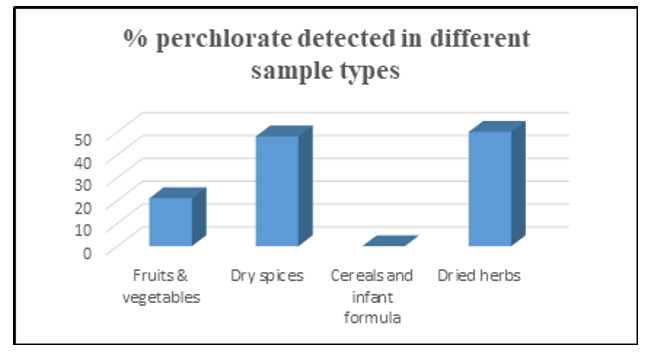
Figure 5: % Perchlorate detected in different samples studied.
Figure 5 shows the % perchlorate detected in different sample types and the highest frequency was in dried herb 50% (10 out of 20), dried spices 41% (10 out of 22) and fruit and vegetables 22% (8 out of 39). Out of 19 samples of cereals and infant formula none of them contains perchlorate.

Figure 6: Perchlorate concentration (μg/kg) in Fruits and Vegetables.
Figure 6 shows the perchlorate concentration among different fruits and vegetables, and it was found that the highest concentration of perchlorate was found in beet roots 223 (μg/kg) which is higher than the maximum limit of 50 μg/kg followed by fresh orange 66.3 (μg/kg) also higher than the maximum limit of 50 μg/kg and fresh carrots 11 (μg/kg).

Figure 7: Perchlorate concentration (μg/kg) in dry spices.
Figure 7 shows the perchlorate concentration among different dry spices, and it was found that the highest concentration of perchlorate was found in cumin powder and cumin seeds 135 and 113 (μg/kg) respectively but which is higher are within the maximum limit of 500 μg/kg followed by coriander whole 61.6 (μg/kg) and black pepper powder 52.5 (μg/kg). In some other spices perchlorate is not detected like chili powder and turmeric powder.
Among different types of dried herbs tested for perchlorate the highest content was found in dried mint 136.3 (μg/kg) followed by hibiscus natural tea 61.2 (μg/kg).
While perchlorate research has principally been associated with its health effects, risk assessment, existence, contamination source and effective remediation technologies, detection is the key and new techniques are always being developed. The limit of detection (LOD) down to a few ppb or sub-ppb is often required to meet the regulated maximum contaminant level. This is the first such study done at DCL for investigating perchlorate exposure in the gulf region in ppb level.
Conclusions
Perchlorate was detected in 28% of total measured samples and about 2% of samples were found to be unsatisfactory. The average mean concentrations of perchlorate were 9.3 μg/kg in fruit and vegetables, 22 μg/kg in dried spices and 22.2 μg/kg in dried herbs respectively, while perchlorate was non-detected in cereals and infant formula.
The current research findings suggest that the perchlorate contamination in the samples tested may not to be an immediate health issue, yet testing for perchlorate should continuously be conducted. Moreover, Infants and toddlers are particularly vulnerable to perchlorate; therefore, additional investigation of perchlorate exposure in young age group through baby foods is necessary.
To the best of our knowledge, this is the first such study done at DCL for investigating perchlorate exposure in the gulf region.
Consumers are advised to maintain a healthy diet and eat a variety of foods across all food groups daily.
In summary, there are several gaps that need to be filled through future research on perchlorates. These include the Portable device or sensor to enable testing on-site to get results quickly towards pre-screening and advances in characterization for fate, transportation, remediation, and risk assessment of perchlorate.
Acknowledgements
We would like to thank our Head of section Mr. Mohammed Karam and team leader Mrs. Fatma Saeed and other staff of Food chemical analysis group for their help to carry out this important study. Special thanks to Dr. Amal Salem Saeed Albedwawi Senior laboratories studies specialist who helped in review of the complete paper. Also, we are thankful to l Food control authority staff who collected samples from the local market in Dubai.
References
- Kim, H. B., Sim, W. J., Kim, M. Y., & Oh, J. E. (2008).Monitoring and evaluation of analytical methods of perchlorate with IC and LC/MS. Journal of Korean Society of Environmental Engineers, 30(1), 37-44.
- Chen L, Chen H, Shen M, Zhou Z, Ma A. Analysis of perchlorate in milk powder and milk by
- Kirk, A. B., Martinelango, P. K., Tian, K., Dutta, A., Smith, E. E., & Dasgupta, P. K. (2005). Perchlorate and iodide in dairy and breast milk. Environmental Science & Technology, 39(7), 2011-2017.
- Her, N., Kim, J., & Yoon, Y. (2010). Perchlorate in dairy milk and milk-based powdered infant formula in South Korea.Chemosphere, 81(6), 732-737.
- Alomirah, H. F., Al-Zenki, S. F., Alaswad, M. C., Alruwaih,N. A., Wu, Q., & Kannan, K. (2016). Widespread occurrence of perchlorate in water, foodstuffs and human urine collected from Kuwait and its contribution to human exposure. Food Additives & Contaminants: Part A, 33(6), 1016-1025.
- Bellanger, M., Demeneix, B., Grandjean, P., Zoeller, R. T., & Trasande, L. (2015). Response to the Letter by Middlebeek and Veuger. The Journal of Clinical Endocrinology & Metabolism, 100(6), L54-L55.
- hydrophilic interaction chromatography combined with tandem mass spectrometry. J Agric Food
- Chem. 2010;58(6):3736–3740.
- Dyke, J. V., Kirk, A. B., Martinelango, P. K., & Dasgupta, P.K. (2006). Sample processing method for the determination of perchlorate in milk. Analytica chimica acta, 567(1), 73-78.
- determination of perchlorate in milk. Anal Chim Acta.2006;567(1):73–78.
- Maffini, M. V., Trasande, L., & Neltner, T. G. (2016). Perchlorate and diet: human exposures, risks, and mitigation strategies. Current environmental health reports, 3, 107-117.
- Regulation (EU) No 609/2013 of the European Parliament and of the Council of 12 June 2013 on food intended for infants and young children, food for special medical purposes, and total diet replacement for weight control and repealing Council Directive 92/52/EEC, Commission Directives 96/8/ EC, 1999/21/EC, 2006/125/EC and 2006/141/EC, Directive 2009/39/EC of the European Parliament and of the Council and Commission Regulations (EC) No 41/2009 and (EC) No 953/2009 (OJ L 181, 29.6.2013, p. 35).
- Rapid determination of perchlorate anion in foods by ion chromatography-tandem mass spectrometry. FDA U.S. Food and Drug Administration. [cited 2005 April 12]. Available from: http://www.fda.gov/Food/FoodSafety/ FoodContaminantsAdulteration/ChemicalContaminants/ Perchlorate/ucm077793.htm.