
International Journal of Diabetes & Metabolic Disorders(IJDMD)
ISSN: 2475-5451 | DOI: 10.33140/IJDMD
Impact Factor: 1.23


Review Article - (2025) Volume 10, Issue 2
Nutritional Status of Diabetic Individuals Aged 60 Years and Older and Associated Factors in Conakry University Hospitals
2Laboratory of Microbiology and Microbial Biotechnology, Joseph KI-ZERBO University, Ouagadougou, Burkina Faso
3Ministry of Higher Education, Scientific Research, and Innovation of Guinea, Guinea
Received Date: Jul 02, 2025 / Accepted Date: Aug 08, 2025 / Published Date: Sep 01, 2025
Copyright: ©©2025 Ibrahima KABA, et al. This is an open-access article distributed under the terms of the Creative Commons Attribution License, which permits unrestricted use, distribution, and reproduction in any medium, provided the original author and source are credited.
Citation: Ibrahima, K., Fanta, T., Amadou, C. T. O., Aboubakar, S. O. (2025). Nutritional Status of Diabetic Individuals Aged 60 Years and Older and Associated Factors in Conakry University Hospitals, Int J Diabetes Metab Disord, 10(2), 01-10.
Abstract
Aging modifies the metabolic functions and nutritional status of elderly people; however, in the Republic of Guinea, few studies have been conducted on the nutritional status of elderly people, especially those suffering from diabetes. The objective of this work was to evaluate the nutritional status of individuals aged 60 and above with diabetes in the university hospitals of Conakry. Methodology: The study was descriptive cross-sectional, the variables analyzed were socio-economic, anthropometric on the assessment of the nutritional status of people aged 60 years and over through BMI, MNA-SF and MUAC. Results: A total of 149 people aged 60 years and over were surveyed in Donka and Ignace Deenn University Hospitals. The average age was 66.66±6.69 years; that of the nutritional status assessment tools BMI, MNA-SF and MUAC were respectively 26.56±5.96 kg/m2, 10.12±2.3, 28.77±5.27 cm. The overall mean blood glucose level was 201.43±98.03 mg/dl and that of women was 207.24±108.18 mg/dl, 120 (80.54%) elderly subjects were obese according to MUAC, 54 (36.24%) elderly people were overweight and 83 (55.70%) subjects were at risk of malnutrition. In the age group of 60 to 69 years, 45.5% were underweight, 76.8% were overweight, among the obese 82.9% were in this group, that of 80 years and over had 2.9% who suffered from obesity. Malnutrition affected 54.5% of men, compared to 74.3% of women who were obese, 69.6% of married people were overweight. However, 65.7% of this group suffered from obesity. Age, sex, marital status, household size, occupation, income possession and monthly income amount had no significant association with BMI. However, education level had a significant influence on BMI (p = 0.028). Age, household size were significantly related to nutritional status via the MNA-SF. 51.8% and 62.2% of women were respectively at risk of malnutrition and malnourished, 54.2% of those who were not in school were at risk of being underweight, while 8.9% of elderly subjects who had a higher education level suffered from thinness. 46.3% of elderly diabetics suffering from malnutrition had a monthly income between one and two million Guinean francs (62,500 to 12,500 CFA francs). Nutritional status assessment tools were not related to blood glucose levels; the OR for BMI was -0.821 with a 95% confidence interval of -4.160 to 2.517.
Conclusion: The elderly diabetics in this study largely presented an impaired nutritional status. Knowledge of nutritional profiles is essential for the management and the regular monitoring of elderly diabetics
Keywords
Nutritional Status, Elderly, Diabetes, University Hospital, Conakry.Introduction
The health of an elderly person often depends on the interactions between their genetic makeup, lifestyle habits (physical activity, diet, etc.), environment (socio-educational and professional), and the onset of chronic diseases [1]. Chronic diseases associated with aging are often linked to the onset of underdenutrition [2]. It affects 30 to 70% of hospitalized elderly people, 4 to 10% of elderly people living at home, and 15 to 38% of those in institutions [3,4]. Underweight in older adults increases morbidity and mortality, length of hospital stays, healthcare costs, and affects quality of life and independence [5]. In Africa, the prevalence of underdenutrition ranges from 13.1% to 36.1%, depending on the screening tool used and the population studied[6]. We are wit nessing a resurgence of non-communicable diseases (high blood pressure, diabetes, and coronary heart disease), which are often associated with life-threatening complications that have a significant social and economic impact on those affected [6]. Cardiovascular diseases cause approximately 18 million deaths each year, and the main risk factors are related to diabetes or high blood pressure [7]. Diabetes is one of the most widespread noncommunicable diseases in the world, with approximately 463 million people living with diabetes in 2019 [8]. The WHO notes that the prevalence of diabetes among people over 65 years of age is between 12% and 25%. Previous studies have shown that glycemic control is associated with a 12% reduction in morbidity and mortality [9]. Overweight and obesity are considered the greatest risk factors for diabetes [10]. Furthermore, aging associated with obesity is an increased risk factor for diabetes and could increase the prevalence of diabetes in older adults [11].
Guinea is not immune to nutritional problems, particularly among elderly diabetics in Conakry's university hospitals. The STEPS survey conducted in 2009 in Conakry and Lower Guinea noted that the prevalence of diabetes in the population aged 15 to 64 was 3.5%, and 5.7% with a 95% confidence interval in the 35 to 64 age group [12]. Given the scarcity of studies on the nutritional status of elderly diabetics in hospitals, we conducted this study at the Donka and Ignace Deen University Hospitals to assess the nutritional status of elderly diabetics who were seen in consultation or hospitalized in the Neurology and Cardiology departments at Donka and the Diabetology and Cardiology departments at Ignace Deen.
Methods
Type, study setting, and period
This was a descriptive cross-sectional study conducted at the Donka University Hospital (Diabetology and Cardiology Department) and Ignace Deenn University Hospital (Neurology and Cardiology Department) from September 5 to December 15, 2023, inclusive. Study population It consisted of people aged 60 and over.
Inclusion criteria:
• Individuals aged 60 and over with diabetes;
• Elderly subjects monitored by the Donka and Ignance Deen University Hospitals (Cardiology and Diabetology at Donka and Neurology and Cardiology at Ignance Deen);
• Individuals whose health status allowed for the collection of data (anthropometric, biological, and socioeconomic);
• Elderly individuals who agreed to participate in the study.
Sociodemographic parameters
The sociodemographic parameters included gender, age, level of education, occupation, source of income, monthly income, family history, marital status, and marital regime.
Biological parameter
This parameter focused on capillary blood glucose levels in older adults, which were measured using a humaSens2.0 blood glucose meter. Older adults with fasting blood glucose levels greater than or equal to 126 mg/dl [13] were considered diabetic.
Anthropometric parameters
Weight was determined using an Omcron bathroom scale with an accuracy of 0.1 kg. Elderly subjects were weighed without shoes. Height was measured using a height rod with an accuracy of 1 centimeter; elderly subjects stood on the height rod without shoes [14].
For subjects who had difficulty standing on the height rod, knee height was measured to estimate height based on gender using the formulas below.
Height for women (cm) = 84.88- 0.24 x age (years) + 1.83 x HG (cm); Height for men (cm) = 64.19- 0.04 x age (years) + 2.03 x HG (cm) [15].
To determine nutritional status, we used Body Mass Index (BMI), the Mini Nutritional Assessment Short Form (MNA-SF), and upper arm circumference (UAC).
To determine BMI, we used the following WHO standards:
• If BMI is less than 18.5: this is underdenutrition;
• If BMI is between 18.5 and 24.9: this is normal nutritional status;
• If BMI is between 25 and 29.9: overweight;
• If BMI is greater than or equal to 30: obesety [14].
- Mini Nutritional Assessment Short-Form (MNA-SF) For MNA-SF, the score standards were as follows:
• If the MNA-SF score is less than or equal to 7: this indicates underdenutrition;
• If the score is between 8 and 11: this indicates a risk of underdenutrition;
• If the score is greater than or equal to 12: this indicates a normal nutritional status [15].
The upper arm circumference (MUAC) was measured using a UNICEF-type tape measure on the dominant arm, at mid-distance between the olecranon and the acromion. If MUAC < 21 cm, there is malnutrition, and if MUAC > 24 cm, there is obesity [16].
We collected the data using a survey form containing the MNA-SF questionnaires designed using Sphinx software.
The data were entered into Sphinx software and analyzed using IBM SPSS version 27. Qualitative variables were expressed as percentages and counts, quantitative variables were expressed as means and standard deviations, and a linear regression was performed to determine the correlation between diabetes and the nutritional status of older adults using BMI, MNA-SF, and MUAC, as well as sociodemographic parameters.
Results
Our study looked at a sample of 149 people with diabetes aged 60 and over who were seen in consultation or hospitalized at the Donka and Ignace Deen University Hospitals. The average age was 66.66 ±6.69 years, with extreme values of 60 and 93 years. The means of the different variables are presented in Table 1.
|
Variable |
Total average |
Average |
|
|
Women |
Men |
||
|
Age |
66.66±6.69 years |
66.85±6.49 years |
66.43±6.97 years |
|
Fasting blood sugar |
201.43±98.03 mg/dl |
207.24±108.18 mg/dl |
194.77±85.59 mg/dl |
|
BMI |
26.56 ±5.96 kg/m2 |
27.67±6.53 kg/m2 |
25.21±4.90 kg/m2 |
|
MNA-FS |
10.12±2.3 |
10,16±2,42 |
10,07±2,16 |
|
MUAC |
28.77±5.27 cm |
29.94±5.27 cm |
27.34±4.94 cm |
Table 1: Average quantitative variables
In Table 1, the average age was 66.66±6.69 years, with women (66.85±6.49 years) being slightly older than men (66.43±6.97 years). The overall average fasting blood glucose level was 201.43±98.03 mg/dl, with the average blood glucose level for women (207.24±108.18 mg/dl) higher than that for men (194.77±85.59 mg/dl). The average values of the nutritional status assessment tools BMI, MNA-SF, and MUAC for women were 27.67±6.53 kg/m2, 10.16±2.42, and 29.94±5.27 cm, respectively, and higher than those observed in men (25.21±4.90 kg/m2, 10.07±2.16, and 27.34±4.94 cm).
The nutritional status of elderly people with diabetes according to the different anthropometric tools used is shown in the figure.

Figure 1: Nutritional status of elderly people with diabetes according to the nutritional status assessment tools used.
We can see from Figure 1 that 120 (80.54%) elderly people with diabetes were obese and 4.69% of people with diabetes were undernourished according to the MUAC. The same figure shows that the body mass index (BMI) of elderly people with diabetes indicates that 36.24% were overweight, 24.83% were obese, and 7.38% of people with diabetes were underweight. The risk of undernutrition affected 55.70% of diabetics and 30.87% were underweight according to MNA-SF (Figure 1).
The results of the test of the association between nutritional status and sociodemographic parameters are presented in Tables 2 and 3.
|
|
IBM |
||||||||
|
Undernutrition N = 11 (%) |
Normal N= 47 (%) |
Overweight N= 56 (%) |
Obesity N= 35 (%) |
P-value |
|||||
|
Age |
|||||||||
|
60 – 69 |
5 |
45.5% |
35 |
74.5% |
43 |
76.8% |
29 |
82.9% |
0.228 |
|
70 - 79 |
4 |
36.4% |
7 |
14.9% |
10 |
17.9% |
5 |
14.3% |
|
|
Over 80 |
2 |
18.2% |
5 |
10.6% |
3 |
5.4% |
1 |
2.9% |
|
|
Gender |
|||||||||
|
Men |
6 |
54.5% |
24 |
51.1% |
28 |
50.0% |
9 |
25.7% |
0.060 |
|
Women |
5 |
45.5% |
23 |
48.9% |
28 |
50.0% |
26 |
74.3% |
|
|
Marital status |
|||||||||
|
Single |
1 |
9.1% |
2 |
4.3% |
1 |
1.8% |
0 |
0.00% |
0.470 |
|
Married |
5 |
45.5% |
29 |
61.7% |
39 |
69.6% |
23 |
65.7% |
|
|
Widowed |
5 |
45.5% |
16 |
34.0% |
16 |
28.6% |
11 |
31.4% |
|
|
Divorced |
0 |
0.00% |
0 |
0.0% |
0 |
0.00% |
1 |
2.9% |
|
|
Level of education |
|||||||||
|
Not in school |
10 |
90.9% |
34 |
72.3% |
26 |
46.4% |
16 |
45.7% |
0.028 |
|
Elementary school |
1 |
9.1% |
5 |
10.6% |
5 |
8.9% |
5 |
14.3% |
|
|
Middle school |
0 |
0.0% |
4 |
8.5% |
18 |
32.1% |
8 |
22.9% |
|
|
High school |
0 |
0.0% |
4 |
8.5% |
7 |
12.5% |
6 |
17.1% |
|
|
Household size |
|||||||||
|
≤ 4 |
1 |
9.1% |
7 |
14.9% |
1 |
1.8% |
2 |
5.7% |
0.074 |
|
≥ 4 |
10 |
90.9% |
40 |
85.1% |
55 |
98.2% |
33 |
94.3% |
|
|
Profession |
|||||||||
|
Shopkeepers |
1 |
9.1% |
14 |
29.8% |
17 |
30.4% |
13 |
37.1% |
0.121 |
|
Retired people |
0 |
0.0% |
3 |
6.4% |
9 |
16.1% |
6 |
17.1% |
|
|
Farmers |
1 |
9.1% |
5 |
10.6% |
1 |
1.8% |
1 |
2.9% |
|
|
Livestock farmers |
0 |
0.0% |
2 |
4.3% |
1 |
1.8% |
0 |
0.0% |
|
|
Fishermen |
0 |
0.0% |
0 |
0.0% |
1 |
1.8% |
1 |
2.9% |
|
|
Manual workers |
2 |
18.2% |
4 |
8.5% |
9 |
16.1% |
3 |
8.6% |
|
|
Civil servants |
0 |
0.0% |
3 |
6.4% |
9 |
16.1% |
4 |
11.4% |
|
|
Not working |
7 |
63.6% |
16 |
34.0% |
9 |
16.1% |
7 |
20.0% |
|
|
Do you have any income |
|||||||||
|
Yes |
8 |
72.7% |
40 |
85.1% |
50 |
89.3% |
30 |
85.7% |
0.544 |
|
No |
3 |
27.3% |
7 |
14.9% |
6 |
10.7% |
5 |
14.3% |
|
|
What amount |
|||||||||
|
< One million FG |
6 |
75.0% |
17 |
42.5% |
19 |
38.0% |
10 |
33.3% |
0.275 |
|
Between one and two million |
2 |
25.0% |
11 |
27.5% |
21 |
42.0% |
13 |
43.3% |
|
|
> two million |
0 |
0.0% |
12 |
25.53%) |
10 |
20.0% |
7 |
23.3% |
|
Table 2: Nutritional status of elderly people with diabetes based on BMI across socioeconomic characteristics
We observe in Table 2 that the 60-69 age group was the most affected by malnutrition based on BMI. In fact, 45.5% of undernourished individuals in this study according to BMI across all age groups, 76.8% of overweight subjects, and 82.9% of obese subjects were in this age group, compared to 36.4% of undernourished individuals, 17.9% of overweight subjects, and 14.3% of obese subjects in the 70-79 age group. Furthermore, those aged 80 and over were even less affected by malnutrition. According to the same table, undernourishment was more prevalent among men with diabetes (54.5%) than among women (45.5%), and women were more affected by obesity than men (74.4% vs. 25.7%), but this difference was not statistically significant, although it tended to be (P=0.06). In terms of marital status, married people were the most affected by malnutrition. Almost all of those who were undernourished according to their BMI were married (45.5%) or divorced (45.5%), compared to 9.1% of single people and 0.00% of divorced people. In addition, married people accounted for 69.6% of overweight subjects and 65.7% of obese people. People with no schooling were more numerous in this study and were affected by undernutrition, overweight, and obesity at rates of 90.9%, 46.4%, and 45.7%, respectively (Table 2). Diabetics who lived in households with four or more people were more affected by undernutrition, overweight, and obesity, at 90.9%, 98.2%, and 94.3%, respectively. This high rate could be explained by the large number of diabetics with more than four individuals in the household. People who did not engage in any income-generating activity accounted for 63.6% of undernourished subjects. These people were followed by workers, who accounted for 18.2%, and no farmers, fishermen, or civil servants were underweight. On the other hand, traders accounted for 30.4% and 37.1% of overweight and obese subjects, respectively. Among manual workers, civil servants, and people without income-generating activities, the prevalence of overweight was identical at 16.1%. The rate of overweight was lower, but also identical for farmers, livestock farmers, and fishermen (1.8%). People without income-generating activities, civil servants, and manual workers accounted for 20%, 11.4%, and 8.6% of obese individuals, respectively. Farmers and fishermen accounted for only 2.9% of obese subjects, and no cases of obesity were observed among livestock farmers. Elderly diabetic subjects with an income were more affected by malnutrition (undernourishment and overweight), with elderly people with a monthly income of less than one million Guinean francs being the most affected, accounting for 75% of those suffering from undernutrition, unlike elderly subjects with a monthly income of more than two million Guinean francs, among whom there were no cases of undernutrition.
For subjects with an income between one and two million Guinean francs, overweight and obesity rates were 42.0% and 43.3%, respectively. The prevalence of overweight and obesity was lower among elderly diabetics with an income above two million Guinean francs, at 20.0% and 23.3%, respectively. Educational level was associated with the nutritional status of elderly diabetics (p=0.028). Age, gender, marital status, household size, occupation, income, and monthly earnings had no significant influence on nutritional status by BMI (P>5%) (Table 2).
|
Variables |
MNA – SF |
P-value |
|||||
|
Normal N= 21 (%) |
Risk undernutrition N= 83 (%) |
Undernutrition N= 45 (%) |
|||||
|
Age |
|||||||
|
60 – 69 |
10 |
47,6% |
64 |
77,1% |
38 |
84,4% |
0,013 |
|
70 - 79 |
8 |
38,1% |
15 |
18,1% |
3 |
6,7% |
|
|
Over 80 |
3 |
14,3% |
4 |
4,8% |
4 |
8,9% |
|
|
Gender |
|||||||
|
Men |
10 |
47,6% |
40 |
48,2% |
17 |
37,8% |
0,550 |
|
Women |
11 |
52,4% |
43 |
51,8% |
28 |
62,2% |
|
|
Marital status |
|||||||
|
Single |
1 |
4,8% |
1 |
1,2% |
2 |
4,4% |
0,209 |
|
Married |
10 |
47,6% |
60 |
72,3% |
26 |
57,8% |
|
|
Widowed |
10 |
47,6% |
22 |
26,5% |
16 |
35,6% |
|
|
Divorced |
0 |
0,0% |
0 |
0,0% |
1 |
2,2% |
|
|
Level of education |
|||||||
|
Not in school |
15 |
71,4% |
45 |
54,2% |
26 |
57,8% |
0,470 |
|
Elementary school |
3 |
14,3% |
7 |
8,4% |
6 |
13,3% |
|
|
Middle school |
1 |
4,8% |
20 |
24,1% |
9 |
20,0% |
|
|
High school |
2 |
9,5% |
11 |
13,3% |
4 |
8,9% |
|
|
Household size |
|||||||
|
≤ 4 |
3 |
14,3% |
1 |
1,2% |
7 |
15,6% |
0,000 |
|
≥ 4 |
18 |
85,7% |
82 |
98,8% |
38 |
84,4% |
|
|
Profession |
|||||||
|
Shopkeepers |
4 |
19.0% |
27 |
32.5% |
14 |
31.1% |
0.530 |
|
Retired people |
1 |
4.8% |
13 |
15.7% |
4 |
8.9% |
|
|
Farmers |
1 |
4.8% |
4 |
4.8% |
3 |
6.7% |
|
|
Livestock farmers |
0 |
0.0% |
3 |
3.6% |
0 |
0.0% |
|
|
Fishermen |
1 |
4.8% |
1 |
1.2% |
0 |
0.0% |
|
|
Manual workers |
2 |
9.5% |
9 |
10.8% |
7 |
15.6% |
|
|
Civil servants |
2 |
9.5% |
9 |
10.8% |
5 |
11.1% |
|
|
Not working |
10 |
47.6% |
17 |
20.5% |
12 |
26.7% |
|
|
Do you have any income |
|||||||
|
Yes |
15 |
71.4% |
72 |
86.7% |
41 |
91.1% |
0.081 |
|
No |
6 |
28.6% |
11 |
13.3% |
4 |
8.9% |
|
|
What amount |
|||||||
|
< One million FG |
8 |
53.3% |
27 |
37.5% |
17 |
41.5% |
0.195 |
|
Between one and two million |
3 |
20.0% |
25 |
34.7% |
19 |
46.3% |
|
|
> two million |
3 |
20.0% |
20 |
27.8% |
5 |
13.04% |
|
Table 3: Nutritional status of elderly people with diabetes according to socioeconomic characteristics (MNA-SF)
Table 3 shows that subjects aged 60 to 69 accounted for 84.4% of those who were underweight, and 77.1% of those at risk of undernutrition according to MNA-SF were in the 60 to 69 age group. In contrast, the 70-79 age group accounted for only 6.7% of undernourished subjects and 18.1% of participants at risk of undernutrition. Women were more affected by undernutrition (62.2%) and slightly more likely to be underweight (51.8%) than men. Married people and widows were more at risk of being underweight, at 72.3% and 26.5% respectively, whereas no divorced people were at risk of being underweight. 57.8% of people who were undernourished according to MNA-SF had no schooling, compared with only 8.9% of undernourished people who had a higher level of education. And 54.2% of subjects at risk of undernutrition had no schooling, compared to 13.3% of subjects with a higher level of education (Table 3). However, subjects with a primary school education were the least represented among those at risk of undernutrition (8.4%). Household size had a significant effect on nutritional status according to MNA-SF. In fact, 84.4% of underlnourished individuals and 98.8% of those at risk of undernutrition had a household size greater than or equal to 4, compared to 15.6% and 1.2% respectively for participants with a household size less than or equal to 4 (Table 3). By occupation, traders were the most affected by undernutrition and the risk of undernutrition (31.1% and 32.5%), compared with 0.00% undernutrition among livestock farmers and fishermen and only 6.7% undernutrition among farmers. Inactive elderly people with diabetes had a more stable nutritional status (47.6%) compared to other occupations. Elderly people with an income of between one and two million Guinean francs per month and those with an income of less than one million Guinean francs per month were underweight in 46.3% and 41.5% of cases, respectively. In contrast, 53.3% of subjects with an income of less than one million Guinean francs per month had a normal nutritional status. In this study, age and household size were significantly associated with the nutritional status of elderly people with diabetes using the Mini Nutritional Assessment Short Form tool.
The results on the association between diabetes, other pathologies, and nutritional status according to MNA-SF are presented in Figure 2. We can see in Figure 2

Figure 2: Conditions associated with diabetes and MNA-SF
We can see in Figure 2 that elderly subjects whose diabetes was associated with abdominal pain were at greater risk of undernutrition than those with other conditions. Undernutrition was almost identical among elderly diabetics with the following conditions: osteoarthritis, stroke, respiratory infection, and rheumatism (approximately 40%) according to MNA-SF.

Figure 3: diseases associated with diabetes and BMI
In Figure 3, which used BMI as a nutritional assessment tool, overweight was significant among diabetics with heart disease, abdominal pain, and malaria. Obesity was high among those with stroke and rheumatism, at around 30%.
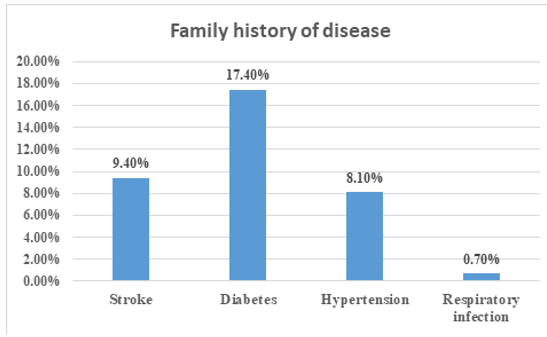
Figure 4: Family history of disease
Figure 4 shows that 17.4% of diabetics in this study reported that their parents had diabetes, 9.4% of parents had had a stroke, 8.1% of parents had hypertension, and only 0.70% of parents had suffered from acute respiratory infection.
|
Variables |
OR |
P-value |
95% confidence interval |
|
|
Lower |
Upper |
|||
|
IMC |
-2.595 |
0.627 |
-8.177 |
2.987 |
|
MNA-SF |
9.049 |
0.064 |
-0.532 |
18.630 |
|
PB |
2.677 |
0.433 |
-4.067 |
9.422 |
Table 4: Linear regression of fasting blood glucose and nutritional status
According to Table 4, diabetics in this study are more than nine (9) times more likely to have an impaired nutritional status according to the MNA-SF, while the risk of deterioration in nutritional status according to BMI was very low (OR = -2.595) with a confidence interval of (-8.177 to 2.987).
Discussion
This study recorded 149 people aged 60 and over who were treated or hospitalized in the diabetes and cardiology departments at Donka and the cardiology and neurology departments at Ignace Deen. In this study, we found a predominance of women, accounting for 55.03% of the sample, with a sex ratio of 1.22 in favor of women. Our results contrast with those reported by Konan et al. At the Treicheville University Hospital, where diabetic men predominated (60.77%) over women, with a sex ratio of 1.54 [17], but which corroborates the sex ratio of the study conducted at the Gerontology and Geriatrics Center in Dakar, which was 1.14 in favor of females [2]. The average age was 66.66±6.69 years, close to that found at the Marrakech University Hospital (69.2±4.3 years) [9] and that found in the study by Ntsama et al. In an internal medicine department in Cameroon [18]. The average BMI for all subjects was 26.56 ±5.96 kg/m2, which is almost similar to that reported by Koevi et al. In Bobo-Dioulasso (26.90 ± 5.80 kg/m2) [19], higher than the average BMI reported by Kézachian and Bonnet 25±3.25 kg/m2 [20], but lower than that observed in the study by Bouzid et al [21] and that found in the study by Khadija et al. (28.1±4.6 kg/m2) [9]. A study conducted in sub-Saharan Africa shows that the highest average BMIs in this region were observed in Senegal (28.2 kg/m²) and South Africa (31.4 kg/m²) [22]. The average MUAC in women and men was 29.94±5.27 cm and 27.34±4.94 cm, respectively. Our average MUAC in men was similar to that found in a study conducted in Nigeria (27.5±9.24 cm). However, the average MUAC for our women was higher than that found in the Nigerian study [23]. This difference could be due to the fact that the Nigerian study was conducted in the community with an inclusion age of 58 years and did not only include diabetic subjects. The average fasting blood glucose level was 2.01±0.98.03 g/l higher than that found in the study by Chami et al in Algeria (1.62±0.66 g/l) [24] and that of a study conducted in Senegal [25], but is close to that reported by Ory et al (1.944 g/l) [26].
The MNA-SF is a nutritional assessment tool that takes several parameters into account. The average MNA-SF score in this study was 10.12±2.3. The average score for women (10.16±2.42) was slightly higher than that for men (10.07±2.16). A study conducted in Algeria using the full version of the MNA reported that the overall average, that of women and men, was 17.7±4.2, 18.1±4.0, and 17.1±4.4, respectively [27]. In this Algerian study, the total MNA score was very high among women compared to that observed among men. The men's score was identical to the score found in our study for men using the short version, which was lower than that of women. This high score among women could be explained by the stability of their nutritional status according to the MNA, whether the full or short version. The study by Ulger et al. Assessed the nutritional status of elderly people in the community using the MNA-SF. The results showed that 32% of men and 68% of women were at risk of undernutrition. Statistically, this gender difference was not significant, although it tended to be (p=0.05). [28]. These results corroborate our own, which show that women were at greater risk of undernutrition (51.8%) than men (48.2%), and there was no correlation between gender and the MNA-SF (p=0.550). Furthermore, the study by Kézachian and Bonnet reports that MNA-SF was not related to gender (p=0.345) [20]. However, a study conducted among older adults shows that age, gender, and marital status were significantly associated with the nutritional status of subjects using the total MNA version [29].
Most diabetics in our study stated that they had an income, but the opposite was observed in a study conducted in Côte d'Ivoire, which highlighted that nearly half of diabetic subjects had no monthly income (45.71%) [30]. Nutritional status determined by BMI showed that diabetic men were more likely to be underweight (54.5%), while obesity affected more women (74.3%). The study by Mbaye et al. Reveals that obesity was more pronounced in diabetic women [25], which corroborates the results of our study. Gender had no significant influence on nutritional status according to BMI in our study. However, opposition to this idea was found in the study by Koevi et al. in Bobo-Dioulasso, which reported that the BMI of diabetics was significantly associated with gender with p=0.014 [19]. The study by Maxime et al. Also showed that gender was significantly correlated with nutritional status [31].
Regarding marital status, Pierre Jesus et al. Reported in their study that 38.4% of married people and 52.1% of widows suffered from undernutrition. Marital status had no significant influence on nutritional status in their study, but occupation was significantly associated (p=0.0001) [31]. The same findings were made in our study. Married people and widows were the most affected by underweight, but no significant relationship was observed with nutritional status according to BMI, marital status, and occupation. More than half of the diabetic subjects in our study were at risk of undernutrition. In the literature, the HAS in France reports that 14.8% of elderly people living at home were at risk of undernutrition [1]. This observed difference may be due to the study location, which was conducted in a hospital setting, as several studies report that hospitalized elderly subjects were exposed to undernutrition [32], which can reach 80% in people aged 65 and over [33]. The rate of diabetics with monthly income was higher than that of those without monthly income in the present study. This finding contrasts with the results observed at the Ouakam Geriatric Center in Senegal, which states that 90% of people did not have monthly income, compared to only 10% who did [34].
Diabetes-related pathologies were more prevalent among overweight and obese elderly subjects in this study. Didier et al. Assert that obese elderly subjects with diabetes have increased complications from cardiovascular disease, respiratory failure, sleep apnea, and cancer. Furthermore, they emphasize that these complications could be reduced by weight loss of between 5 and 10 kg [35]. The majority of researchers agree that there is a positive association between overweight and the risk of cardiovascular disease [36]. Undernutrition affected more than 10% of elderly subjects with respiratory infections. One study mentions that being underweight promotes infections in general through the alteration of the immune system, muscle wasting, and digestive malabsorption [37]. Chronic diseases are associated with a risk of undernutrition, which is accompanied by increased energy expenditure and causes the secretion of anorexigenic hormones [38].
In this study, 17.4% of subjects reported that their parents had diabetes, 9.4% had suffered a stroke, 8.1% had high blood pressure, and only 0.7% had suffered from acute respiratory infection. A prospective study mentions that 20 diabetic male subjects and 43 diabetic women had a family history of diabetes [39], a study conducted in Côte d'Ivoire reports that the history of family diabetes among diabetics was 26.74% [30] Yayehd et al., in a study conducted on the general elderly population, show that the family history of high blood pressure was 49% [40], these results being significantly higher than those observed in our study. The results of the present study show no significant association between nutritional status and diabetes. The literature from one study highlights that elderly subjects frequently have a deficiency in insulin secretion in response to glucose, while obese elderly subjects also suffer from insulin resistance. It reports that insulin resistance appears to be associated with nutritional status [41].
Conclusion
Aging is a process that is often associated with several physiological, psychological, and sociological changes that can impact the nutritional status of older adults. BMI is an index that must be viewed in context in older adults, as it increases with a reduction in height and does not fully reflect changes in body composition, whereas the MNA-SF takes into account several aspects of nutritional assessment in older adults. The elderly diabetic subjects in this study at the Conakry University Hospitals were largely in an altered nutritional state, and this state was associated with certain sociodemographic factors (age, household size, level of education) and pathological factors (binomial pain and diabetes; heart disease and diabetes). In-depth knowledge of the food and nutritional profiles of this population through complementary studies is necessary for the adequate management and regular monitoring of elderly people with diabetes.
Abbreviations
BMI: Body Mass Index, FG: Guinean Franc, FCFA: Franc of the French Colonies of Africa, MUAC: Mid-Upper Arm Circumference, MNA-SF: Mini Nutritional Assessment Short Form.
Acknowledgments: Ministry of Higher Education, Scientific Research, and Innovation of Guinea.
Conflict of interest: No conflict of interest.
References
- Haute Autorité de Santé, Diagnostic de la dénutrition chez la personne de 70 ans et plus. 2025.
- Diagne, S. L. M., Thiam, S., & Ka, O. (2010). Dénutritionet morbidité des patients âgés de 60 ans et plus du Centre de Gérontologie et de Gériatrie de Dakar (Sénégal). La Revue francophone de gériatrie et de gérontologie, 17(166).
- Yerly, N., Nguyen, S., Major, K., & Taroni, W. B. (2015). Approche ambulatoirede la dénutrition chez la personne âgée. Rev Med Suisse, 11, 2124-8.
- Schweizer, V. (2010). Troubles de la déglutition de la personneâgée. Revue médicale suisse, (265), 1859.
- Thibault, R., Jaccard, S., Navas, D., Dessomme, B., Paillé, C., Moret, L., & Darmaun, D. (2012). Évaluation des pratiques professionnelles en nutrition parentérale chez l’adulte au centre hospitalier universitaire de Nantes. Nutrition clinique et métabolisme, 26(2), 65-70.
- E. Acetabular and R. Arthroplasty, “Original Article Article original,” Analysis, vol. 43, no. August, pp. (2025).269–275.
- Gning, S. B., Thiam, M., Fall, F., Ba-Fall, K., Mbaye, P. S., & Fourcade, L. (2007). Le diabete sucre en Afrique subsaharienne. Aspects epidemiologiques, difficultes de prise en charge. Médecine tropicale, 67(6), 607-611.
- Akré, D. S. T., Obouayeba, A. P., Koffi, A. E., Kouakou, K.E., Konan, D., Kouassi, E. K., & Akoua-Koffi, C. (2021). Évaluation des facteurs de risques du diabète chez les patients diabétiques au centre hospitalier régional de Daloa, Côte d’Ivoire. Journal of Applied Biosciences, 168(1), 17436-17446.
- Diyane, K., El Ansari, N., El Mghari, G., Anzid, K., & Cherkaoui, M. (2013). Caractéristiques de l’association diabète type 2 et hypertension artérielle chez le sujet âgé de 65 ans et plus. Pan African Medical Journal, 14(1).
- OMS, “Rapport mondial sur le diabète,” 2025.
- Bonaldi, C., Romon, I., & Fagot-Campagna, A. (2006). Impacts du vieillissement de la population et de l’obésité sur l’évolution de la prévalence du diabète traité: situation de la France métropolitaine à l’horizon 2016. Diabète, 18, 16.
- Ministère de la Santé et l’Hygiène Publique de Guinée, “Plan strategique national multisectoriel de lutte contre les maladies non transmissibles (2021-2025),” 2021.
- du Diabète, F. I. (2005). Guide de prise en charge du diabete de type 2 pour l’afrique sub-saharienne. Zanzibar-Tanzanie: Féderation Internationale du Diabète-Région Afrique.
- Diendere, J. (2017). Évolution de l’état nutritionnel et des troubles de la déglutition au cours des accidents vasculaires cérébraux, en milieu hospitalier au Burkina Faso (Doctoral dissertation, Université de Limoges; Université Joseph Ki-Zerbo (Ouagadougou, Burkina Faso).
- Collège National des Enseignants de Gériatrie, Gériatrie–Réussir les ECNI, Elsevier M. 2025.
- de La Santé, O. M. (1995). Utilisation et interprétation de l'anthropométrie. In Utilisation et interprétation de l'anthropométrie (pp. 498-498).
- N.M. Konan, V. Acko, D. Bita, R. Ouattara, K. Djami, A.V.Kouassi, S. Kouamé, F.Abbe, G.S.Koffi, M. Koffi and Y.O.Binan “Déterminants de l’anémie chez les personnes âgées diabétiques du Centre Hospitalier Universitaire de Treichville de juin 2017 à décembre 2018,” RAFMI, vol. 9,pp, (2025).15,21.
- M.J.Ntsama Essomba, D.Zogo Noah, S.R.Simeni Njonnou and G.Ashuntantang “Facteurs Associés à la Sarcopénie chez des Patients Âgés de 55 Ans et plus dans un Service de Médecine Interne au Cameroun,” Heal. Sci. Dis., vol. 23, no. 10, pp. (2025),58,61.
- Koevi, K. K. A., Millogo, V., Ouedraogo, M., & Ouedraogo, G.(2014). Diagnostic des causes de complication du diabète et des méthodes de prévention à Bobo-Dioulasso, au Burkina Faso. International Journal of Biological and Chemical Sciences, 8(6), 2709-2720.
- Kézachian, L., & Bonnet, P. A. (2012). Simplifier le dépistage de la dénutrition du sujet âgé en médecine générale: test de concordance entre un outil simple, le «Malnutrition Universal Screening Tool»(«MUST») et le «Mini Nutritional Assessment-Short Form»(«MNA-SF»). Nutrition clinique et métabolisme, 26(3), 109-113.
- Hssine, M., Bouzid, C., Salem, L. B., Mansour, Z. B., Ali, N. B., & Slama, C. B. (2010). P129 Profil clinique et apport alimentaire spontané d’un groupe de personnes âgées diabétiques. Diabetes & Metabolism, 36, A69.
- Kimokoti, R. W., & Hamer, D. H. (2008). Nutrition, health, and aging in sub-Saharan Africa. Nutrition reviews, 66(11), 611-623.
- Afolabi, W. A. O., Olayiwola, I. O., Sanni, S. A., & Oyawoye,O. (2015). Nutrient intake and nutritional status of the aged in low income areas of southwest, Nigeria. J Ageing Res Clin Pract, 4(1), 66-72.
- Chami, M. A., Zemmour, L., Midoun, N., & Belhadj, M. (2015). Diabète sucré du sujet âgé: la première enquête algérienne. Médecine des maladies Métaboliques, 9(2), 210-215.
- Mbaye, M. N., Niang, K., Sarr, A. G. R. J., Mbaye, A.,Diedhiou, D., Ndao, M. D., ... & Kane, A. (2011). Aspects épidémiologiques du diabète au Sénégal: résultats d’une enquête sur les facteurs de risque cardiovasculaire dans la ville de Saint-Louis: Epidemiological aspects of diabetes in Senegal: Results of a survey on cardiovascular risk factors in Saint-Louis. Médecine des maladies Métaboliques, 5(6), 659-664.
- Ory, J. P., Didier, J. M., Barbat, S., Messica, O., & Faure, C. (2013). Qui sont et que deviennent les patients chez lesquels une hyperglycemie est fortuitement découverte?. Diabetes & Metabolism, 39, A107.
- Menadi, N., Meziani, S., Zairi, M., Boukhatmi, F., Tarfaoui, L., Sennous, K., ... & BELBRAOUET, S. (2021). Prévalence de la dénutrition dans une population de personnes âgées vivant à domicile à Sidi-Bel-Abbès (Ouest Algérien). Revue Gériatrie, 46(1), 17-23.
- Ülger, Z., Halil, M., Kalan, I., Yavuz, B. B., Cankurtaran, M., Güngör, E., & ArÃÂ?±oÃÂ??ul, S. (2010). Comprehensive assessment of malnutrition risk and related factors in a large group of community-dwelling older adults. Clinical nutrition, 29(4), 507-511.
- Torres, M. (2014). Statut nutritionnel de la personne âgée vivant à domicile: prévalence, facteurs associés et conséquences(Doctoral dissertation, Université de Bordeaux).
- Eugène, K. Y., Tetchi, E. O., Kokora, E. F., Gilbert, K. L., & Odile, T. A. (2023). Profil des diabetiques de 20 ans a 79 ans de l’enquete nationale sur la prevalence et caracteristiques du diabete en Côte d’Ivoire. Revue Africaine des Sciences Sociales et de la Santé Publique, 5(1), 311-321.
- Jésus, P., Guerchet, M., Pilleron, S., Fayemendy, P., Mouanga,M., Mbelesso, P., ... & Desport, J. C. (2017). Undernutrition and obesity among elderly people living in two cities of developing countries: prevalence and associated factors in the EDAC study. Clinical nutrition ESPEN, 21, 40-50.
- Trivalle, C., Gasquet, I., Hamon-Vilcot, B., Taillandier, J., Lemoine, A., & Falissard, B. (2007). Mise au point de deux échelles de dépistage de la dénutrition pour les personnes âgées hospitalisées en soins de suite ou en soins de longue durée. NPG Neurologie-Psychiatrie-Gériatrie, 7(37), 19-24.
- GENTON, P. L., & Graf, C. (2020). Dénutrition chez lapersonne âgée. Rev Med Suisse, 16, 189-90.
- Ka, O., Coume, M., Diop, C. T., Ngom, N. F., Faye, A., Leye,M. M. M., ... & Seck, I. (2017). Enquête médicosociale auprès des personnes âgées du centre de gérontologie et de gériatrie de Ouakam au Sénégal. NPG Neurologie-Psychiatrie-Gériatrie, 17(100), 223-229.
- D. Quilliot, P. Böhme, A. Malgras, and O. Ziegler, “Obesity in the elderly,” Nutr. Clin. Metab., vol. 27, no. 2, (2025) 95,101.
- M. Noale and stefania Limongi, Federica, Maggi, “Épid é miologie des maladies cardiovasculaires chez les personnes âgées,” Med. Biol, (2025) 29,43.
- Veyssier, P. (1997). Infections et personnes âgées. Médecine etmaladies infectieuses, 27(1), 48-52.
- Kouassi, K. C., & Lamboni, C. (2013). Statut nutritionnel protéinoénergétique des personnes âgées hospitalisées au CHU Campus de Lomé (Togo): étude pilote à propos de 33 cas versus 30 témoins colligés dans trois unités de soins. Med Santé Trop, 23, 39-48.
- Balkau, B., Lange, C., de Lauzon-Guillain, B., Czernichow, S., Cailleau, M., Cogneau, J., ... & Tichet, J. (2009). Un score prédictif du diabète de type 2 en France: l’étude prospective DESIR. Ménopause, 48(38), 0-1.
- Yayehd, K., Damorou, F., Akakpo, R., Tchérou, T., N’Da,N. W., Pessinaba, S., ... & Johnson, A. (2013, February). Prévalence de l’hypertension artérielle et description de ses facteurs de risque à Lomé (Togo): Résultats d’un dépistage réalisé dans la population générale en mai 2011. In Annales de Cardiologie et d'Angéiologie (Vol. 62, No. 1, pp. 43-50). Elsevier Masson.
- Ardigo, S., Perrenoud, L., & Philippe, J. (2013). Diabète de la personne âgée: une prise en charge sur mesure. Rev Med Suisse, 9(389), 1192-9.