

Advances in Bioengineering and Biomedical Science Research(ABBSR)
ISSN: 2640-4133 | DOI: 10.33140/ABBSR

Impact Factor: 1.7

Research Article - (2021) Volume 4, Issue 4
Multiple Datasets Revealed T Cell Pathway Related Genes Associated with Better Prognosis and Chemotherapy in Breast Cancer
2The First Clinical Medical College of Nanchang University, Nanchang, Jiangxi, China
3Department of General Surgery, The First Affiliated Hospital of Nanchang University, Nanchang, Jiang, China
4The Second Clinical Medical College of Nanchang University, Nanchang, Jiangxi, China
5Medical Department of Nanchang University, Nanchang, Jiangxi, China
6The Third Hospital of Nanchang, Nanchang, Jiangxi, China
Received Date: Dec 15, 2021 / Accepted Date: Dec 20, 2021 / Published Date: Dec 31, 2021
Copyright: ©Copyright: ©2021 Shixin Yang, et al. This is an open-access article distributed under the terms of the Creative Commons Attribution License, which permits unrestricted use, distribution, and reproduction in any medium, provided the original author and source are credited.
Citation: Ping Chen, Shuhui Lai, Junping Deng, Sixuan Guo, Yangjuan Huang, Jian Li, Xiaowen Fang, Yaping Xie, Yao Zhou (2021) Research Progress on the Application of Atosiban in IVF-ET. Adv Bioeng Biomed Sci Res 4(4): 137-144.
Abstract
Breast cancer (BC) is the most frequent cancer diagnosed in women, and the second foremost source of cancer-related death. Despite conventional treatment, patients experience metastasis and poor survival. This study aimed to systematically validate the data of previous studies on BC to fill the gaps in large-scale meta-analyses and evaluate pivotal genes. We conducted meta-analysis on target genes chosen from the Gene Expression Omnibus (GEO) database to classify the differently expressed genes (DEGs). Then pathway enrichment study of the Kyoto Encyclopedia of Genes and Genomics (KEGG) and proteinproteins interaction (PPI) were performed to investigate the biological pathway leading to DEGs. Survival analysis and logistic regression of the receiver operating characteristics (ROC) were used to evaluate the ability of core gene expression to predict treatment efficacy. The KEGG pathway study revealed that 222 DEGs were enriched in the pathways associated with the cell cycle and T-cell. Kaplan-Meier analysis of total survival showed that hub genes (CD247, ZAP70, LCK, PRKCQ) were associated with better prognosis in BC patients. Pharmacodynamics data, ROC curve, and logistic regression analysis showed that PRKCQ is associated with T-cell pathways and its expression could predict treatment efficacy. It can therefore be used as a biomarker of BC prognosis.
Keywords
Breast Cancer, Meta-Analysis, T Cell, Differentially Expressed Genes
List Of Abbreviations
Breast cancer (BC)
Gene Expression Omnibus (GEO) The Cancer Genome Atlas
(TCGA) differentially expressed genes (DEGs)
Kyoto Encyclopedia of Genes and Genomes (KEGG) pro-tein-protein interaction (PPI)
Gene Expression Profiling Interactive Analysis (GEPIA) receiver operating characteristic (ROC)
area under the curve (AUC)
Search Tool for the Retrieval of Interacting Genes (STRING)
Molecular Complex Detection (MCODE) CD247
zeta chain of T cell receptor associated protein kinase 70 (ZAP70)
LCK proto-oncogene, Src family tyrosine kinase (LCK)
protein kinase C theta (PRKCQ).
Background
Over the past 50 years, cancer incidence has dramatically in-creased worldwide. Breast cancer, a type of allogenic hor-mone-dependent cancer, accounts for 22.9% of all cancers in women and is the second utmost common form of cancer amongst women in developing countries [1]. Therefore, breast cancer is the leading malignancy which poses a significant risk to the health of women. The age-standardized incidence rate (ASIR) of breast cancer in 175 countries showed a growing pat¬tern from 1990 to 2017, with ASIRs rising by more than 50 % in 65 countries [2]. Despite improve- ments in screening, treat¬ment and care, almost 12% of individuals diagnosed with breast cancer ultimately develop metastatic disease, indicating breast cancer that has spread from the breast to other body parts [3]. In addition, despite substantial efforts in traditional therapies involving sur- gery, chemotherapy, radiation therapy, the breast cancer survival scenario, hormone therapy, and immunotherapy, particularly metastatic cancer, remains bleak [4]. From a patho-physiological and molecular viewpoint, breast cancer metastasis entails dramatic changes in the levels of micro-envi- ronmental genes, cells and tumors, contributing to deterioration of the or¬gans and death [5]. There- fore, the identification of new treat¬ment targets and the search for effective chemotherapeutic drugs are of vital importance for conquering drug resistance in breast cancer.
With continued development of high-throughput technolo¬gies, a number of genetic changes related to breast cancer have been gradually discovered, such as in high-penetrance genes (BRCA1, BRCA2, PTEN, and TP53), genes involved in DNA repair (CHEK2, ATM, BRIP1 (FANCJ), PALB2 (FANCN), and susceptibility genes (RAD51C (FANCO)) [6]. Receptors, protein tyrosine kinases, phosphatases, proteases, PI3K/Akt signaling pathway, microRNAs (miRs), and long noncoding RNAs (lncRNAs) are potential therapeutic targets. Recent re¬search reports that lncRNAs HOTAIR, SPRY4-IT1, GAS5, and PANDAR, which are new players in tumor develop- ment and prognosis, may have theranostic applications in breast cancer [7]. The combination of nu- cleic acid sequencing research with mass spectrophotometry-based peptide sequencing, post-trans-lational modification, and rational drug proposal will offer an additional inclusive indulgent of the pathophysiology of breast cancer and contribute to the development of treatment strategies. This research directed to systematically validate the data of pre¬vious studies on breast cancer to fill the gaps in large-scale me-ta-analyses and evaluate pivotal genes that can be used as new biomarkers to promote early diagnosis and treatment.
Due to the high incidence and poor prognosis of breast cancer, as well as the limitations of the varying results obtained through different experimental procedures and microarray platforms, we integrated a large number of DNA microarray data sets for meta-analysis. This analysis was con- ducted with an aim to improve the statistical ability to detect differentially expressed genes, assess heterogeneity, and possibly yield stronger, more reproducible, and more accurate predictions.
Material and methods
Acquisition of Datasets
We performed an automated search of the National Center for Biotechnology Information (NCBI) Gene Expression Synthesis (GEO) database (NCBI, http:/www.cn.ncbi.com), as per the 2009 recommended Reporting Items for Systematic Reviews and Me-ta-Analysis Guidelines, and used the keyword “breast cancer” in our search. We used the following inclusion criteria for the data¬sets: (1) the study must have been conducted on humans (Homo sapiens), (2) the platform for sequencing must come from either the Affymetrix platform or the Illumina platform, (3) the study should contain datasets of non-cell line breast cancer patients and corresponding normal tissue samples, (4) the datasets must not have literature traceability, (5) the datasets must come from DNA methylation-based studies, (6) and the datasets must come from miRNA-based studies. Our data were chosen by two sepa¬rate analysts. A discussion with a third analyst resolved any con¬flict between the two analysts. We have checked and preserved data from The Cancer Genome Atlas (TCGA) database on the expression and clinical data of breast cancer patients.
Meta-Analysis of Microarray Datasets
We downloaded the microarray dataset files (.CEL) from the GEO database that met our inclusion criteria. By use of R statisti¬cal 3.6.3 software (https:/www.r-project.org/) a meta-analysis of the gene expression profiles was performed using the combined T-values and Z-scores. It used the packages MAMA, mataMA, affyPLM, CLL, and RankProd. When two meta-analyses were performed, the combined T-value approach (threshold being ab¬solute value >7) and the Z-score meta-analysis (threshold being absolute value >3) were used as combination cutoff criteria, and the differentially expressed genes (DEGs) were authenticated.
Pathway Enrichment Analysis
Built on the outcomes of the meta-analysis, the most significant¬ly differentially expressed genes were evaluated by using enrich¬ment analyses. Set of genetic analysis tools based on network (http://www.webgestalt.org/option.php), through to the false discovery rate significantly threshold (FDR) <0.1 gene and ge¬nome Kyoto encyclopedia (KEGG pathway enrichment analysis to identify the most significant differences between genes. To test the purpose of immune cells in breast cancer, we provided a text-based gene matrix transposed file wherein each line defined LM22 with their markers [25]. Gene Set Enrichment Analysis (GSEA) was performed genes hierarchical by T-values in the meta-analysis. Subsequently, the LM22 process study was con-ducted using the following terms: B cell memory, B cells naive, Plasma cells, T cells CD8, T cells CD4 naive, T cells CD4 mem¬ory activated, T cells CD4 memory resting, T cells controlling (Tregs), T cells follicular aid, T cells gamma delta, NK cells rest¬ing, NK cells activated, Macrophages M2, Monocytes, Macro¬phages M1, Dendritic cell resting, Macrophages M1.
Protein-Protein Interaction Network Construction
The Search Tool for the Retrieval of Interacting Genes (STRING) database (http:/string- db.org) provides information on protein-protein interactions (PPIs) [26]. We used STRING to model a PPI network of DEGs with a confidence score of > 0.7 as the result truncation criterion was used to gain insight into and forecast the cellular structure and biological activity of the defined DEGs. Using cytoscape software, the PPI network was visualized.
Selection of Pivotal Modules
CentiScaPe 2.1 was used to assess a PPI network’s degree, tight¬ness, and intermediacy. The degree of a node is the total number of incident edges (interactions) on a node [27]. We authenticated the central gene, based on the degree of a node. The Molecular Complex Detection (MCODE) program was later used to pick the most important aggregate module in Cytoscape’s PPI net¬work, where the cutoff degree = 2, node score cutoff = 0.2, depth = 100, and K-core = 2 was the highest. In addition, the WEB-based GEne SeT AnaLysis Toolkit was used to perform DEG ‘s study of KEGG pathway enrichment in each module with a large FDR threshold < 0.1.
Survival Analysis using Module Genes
The Gene Expression Profiling Interactive Analysis (GEPIA) database (http:/gepia.cancer- pku.cn/detail.php) had been used to illustrate the connection in breast cancer patients between the module genes and survival. GEPIA’s RNA-Seq dataset was based on the Xena project of the University of California Santa Cruz (http:/xena.ucsc.edu), that is measured using a convention¬al pipeline [28]. The 95% confidence interval and p-value hazard ratio were determined and the map was visualized.
Receiver Operating Characteristic Curve and Logistic Regression Analysis
Using the receiver Operating Characteristic (ROC) curve study, the sensitivity (true positive rate) and specificity (true negative rate) of module genes in the efficacy of breast cancer chemo¬therapy were evaluated, and the area under the curve (AUC) was explored using MedCalc statistical software.
To further evaluate how well the genes predict breast cancer che¬motherapy efficacy, we constructed a logistic regression mod¬el using R statistical software for five cross-validation [29]. A training set was constructed using 70% of the original dataset selected at random, whereas the remaining 30% was used as a test set to verify the model. Moreover, precision, recall rate, accuracy, and F1 scores were introduced to better evaluate the performance of the subclassification models. The accuracy of the classifier was set as the amount of the overall figure of cor¬rect judgments, and high accuracy was defined as high accuracy of breast cancer chemotherapy efficacy prediction. The rate of recall measured the proportion of all objects that were retrieved (TP) against all “objects to be retrieved” (TP+FN). Precision measured the percentage of all objects retrieved (TP+FP), “to be retrieved.” Accuracy and recall affect each other, and ideally, their values are unlikely to be both large; hence, we considered calculating F1 scores as comprehensive evaluation indicators. F-measure has been described as the weighted harmonic mean of recall and precision, and is a comprehensive index of evalua¬tion. The aforementioned methods are summarized in Figure 5.
Results
Identification of Differentially Expressed Genes Through Meta-Analysis
Based on the inclusion norm, eight GEO datasets from the NCBI were obtained, listed as fol- lows: GSE93601, GSE10780, GSE39004 GPL6244, GSE39004 GPL13534, GSE65212, GSE45827, GSE87049, GSE29044 (Figure SI). Meta-analysis contained a total of 1,247 samples of breast cancer and 801 normal tissue samples. The GEO platform files were collected from the datasets using the Affymetrix gene chips and Illumina gene chips (Table 1).

Figure Sâ? : Selection procession of microarray datasets for me-ta-analysis. We reported 9,595 common genes across all databases, and used two methods to conduct a meta-analysis of multiple gene ex¬pression profiles based on combined T-values and Z-scores. A total of 222 DEGs were identified (Figure 1), as well as 161 upregulated and 61 downregulated genes.
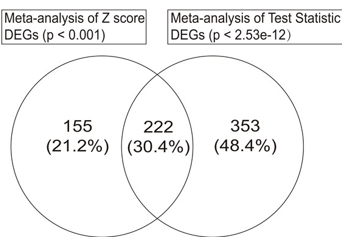
Figure 1: The schematic workflow of the present study.
Pathway Enrichment Analyses
For additional discover the roles of the DEGs, we grouped the 222 DEGs into different func- tional KEGG groups and then car-ried out study of pathway enrichment with a meaning threshold of < 0.05. The top ten words enhanced in the group KEGG were formulated based on their p-val- ues (p< 0.05) (Figure 2A-B). The highest concentrated KEGG pathway terminology for the DEGs were Cell cycle (hsa04110), Tight junction (hsa04530), Th1 and Th2 cell differentiation (hsa04658), NF-κB signaling pathway (hsa04064), and T cell receptor signaling pathway (hsa04660), Th17 cell differentiation(hsa04659), Primary im-munodeficiency(hsa05340), Oocyte meiosis(hsa04114), Ubiq-uitin mediated proteolysis(hsa04120), Hippo signaling path-way(hsa04390). In addition, we also performed KEGG pathway analysis based on the Z-score of common genes, and the results showed that the cell cycle, DNA replication, pyrimidine metabo- lism, and primary immunodeficiency were significantly enriched (Figure 2C-F).
To investigate the immune-related characteristics that might be involved in immunoreactive breast tumors, GSEA enrichment analysis based on the LM22 pathway was performed to predict the tumor microenvironment. Newman et al. constructed a leu¬kocyte signature matrix that ena- bled further applications on immune infiltration using cell-type identification by approxi¬mating relative subsets of RNA transcripts, a new method that allows a large-scale analysis of RNA mix- tures [8]. Based on the LM22 gene sets, GSEA results showed that T cells gamma delta was signifi- cantly activated (Figure 2G). Compared to the normal group, genes associated with T cells were significantly activated in breast cancer tissues.
Figure 2: Venn diagram of DEGs.The 222 overlapping DEGs based on |z Score|>3 and |Test Statistic|>7.
Hub Gene and Module Screening from the Protein-Protein Interaction Network and Survival Analysis
The STRING database was used to expose the central PPI net-work to further analyze the DEGs and their potentially protein levels. Second, we set the PPI network as having 222 nodes and 271. Using the MCODE program (Figure 3A-B) the top 2 im-portant modules were acquired from the DEGs PPI network. Then, the findings of the KEGG pathway review showed that the genes in module 1 were predominantly associated with the cycle of the cells, and four genes in module 2 were strongly correlat-ed with the pathways associated with T. These include CD247 (CD247), zeta chain of T cell receptor associated protein kinase 70 (ZAP70), LCK proto-oncogene, Src family tyrosine kinase (LCK), and protein kinase C theta (PRKCQ)
To investigate the relationship between patient prognosis and these four genes, survival analy- sis of hub genes was per-formed. The results demonstrated that the expression of CD247 (P = 0.0058, HR=0.63), LCK (P = 0.041, HR=0.71), and PRK-CQ (P = 0.019, HR=0.68), ZAP70 (P = 0.027, HR=0.69) (Figure 3C-F). Suggesting that these genes are protective factors.
Figure 3: Pathway enrichment analyses of 222 DEGs. (A)The functional enrichment bubble map of pathways by KEGG pathway analysis, bubble size represents the number of gene in the pathways. (B) Genes included in the first ten pathways of KEGG pathway analysis. (C) The top 10 pathways and bottom 10 pathways of the KEGG pathway analysis based on the Z-score of common genes. (D-F) GSEA indicated significant enrichment of immune-related phenotype in the high-risk group patients. FDR false discovery rate; NES normalized enrichment score. (G) GSEA results based on the LM22 gene sets.
Identifying Key Genes for Predicting Breast Cancer Che motherapy Efficacy Chemotherapy efficacy
Chemotherapy efficacy data of 219 patients were obtained and categorized into complete re- sponse, partial response, clinical progressive disease, and stable disease. We classified complete response and partial response into the category of good efficacy, whereas clinical progressive dis- ease and stable disease were classified into the category of poor efficacy.
ROC curve analysis was performed using data from the TCGA database, and AUC values were compared to assess the sensi-tivity and specificity of the four overlapping genes above-men-tioned in the efficacy of chemotherapy for breast cancer. The genes were listed according to their AUC values (Figure 4A). ROC curves of PRKCQ in the TCGA database were displayed, showing sensitivity and specificity with an AUC of 0.660 (Fig¬ure 4B). Logistic regression was modeled af- terwards to further appraise the effectiveness of PRKCQ in predicting therapeutic efficacy. In the ROC curve of PRKCQ, the mean AUC (0.690 ± 0.033) (Figure 4C) was obtained after the con- struction of the confusion matrix. The average values of accuracy, precision, recall, and F1-score were 0.907, 1.000, 0.951, and 0.690, respectively (Figure 4D). These results indicated that PRKCQ showed a positive performance in differentiating drug-sensitive patients from the non- sensitive ones.
Figure 4: Identification and analysis of key genes. (A,B) 2 modules obtained from PPI network of DEGs using the MCODE software. (C-F) Four genes in module 2 (CD247, ZAP70, LCK, PRKCQ) significantly correlates with better OS of breast cancer.

Figure 5: Identification of key genes for diagnosis of BC.(A) ROC curve analysis of the four DEGs involved in T-cell-associated pathways and in module 2 in TCGA database. Genes with an AUC value are shown. (B) ROC curve to assess sensitivity and specificity of PRKCQ expression as a diagnostic biomarker for BC in TCGA database. (C) ROC curve of PRKCQ in the five-fold cross-validation. (D) Evaluation metrics of each fold. All data are represented by mean ± SD.
Discussion
There has been a change toward more effective genetic screen-ing, in recent years, to identify specific gene mutations associat¬ed with breast tumors, which could lead to “personalized medi-cine” and improved patient outcomes. Although a great deal of data has been obtained through mi- croarray research, most of these reports show different results from various experimental programs and microarray platforms. Even for the same gene, the results of differential expression can be re- versed in different data sets. Therefore, these data are limited, to some extent, and may affect DEG identification. A meta-analysis of several mi¬croarray datasets, nevertheless, extends the sample
size, thereby making DEGs recognition more accurate. In the contemporary research, we achieved a meta-analysis to regulate the DEGs between breast tumor tissues and standard breast tissues. By combining the T-value and Z-scores, we iden-ti- fied 222 DEGs in breast tumor tissues. We categorized these DEGs into functional groups accord- ing to their KEGG path-ways. We used MCODE analysis to obtain the two most import-ant modules from the DEG PPI networks. Genes in component 1 were primarily associated with the cell cycle, whereas genes in module 2 were primarily enriched in T cell related pathways (T cell receptor sig- naling pathway, Th1 and Th2 cell differ-entiation, Th17 cell differentiation, and primary immuno- defi-ciency). We then used the expression of these four genes and the chemotherapy results of breast cancer patients for ROC curve analysis. Logistic regression analysis was used to confirm our results, which showed that PRKCQ had good predictive ability for therapeutic efficacy. Immune disorders lead to tumor growth and T cells have been long identified to perform a major function in manipulating endogenous antitumor immunity [9,10]. Earlier research has shown that ZAP70, LCK, and CD247 play a vital role in gen-erating the T cell receptor indicating path [11]. With the latest growing understanding of the immune micro-environment in tis¬sues of breast cancer, immune escape has become a significant predictor of the development of breast cancer [12-15]. After the occurrence of a tumor, tumor cells associate continuously with the immune mi- croenvironment and eventually acquire the im¬mune escape ability [16].
PRKCQ is a part of the new protein kinase C (PKC) family and features a special protein do- main system comprising of diacylglycerol functional groups; nevertheless, it lacks the cal-cium binding sites typical of classical PKCs [17]. PRKCQ is typically recognized in the hematopoietic system, mainly in T cells, mast cells, natural killer (NK) cells and platelets and in the skeletal mus- cles, liver, thymus and nervous system. [18-21]. Past researchers have determined the essential role of PRKCQ in controlling multiple developmental concepts in T cell biology, such as the inte- gration of TCR and CD28 signals triggers the activation of signaling pathways (NF-ÿB and AP-1); these are necessary for efficient T cell activation, proliferation and differ¬entiation, the effector function of Th subsets (especially Th2 and Th17 cells), [22, 23]. Genetic and biochemical ap- proaches re¬vealed that mutation of the PRKCQ gene contributes to impaired receptor-induced stimulation of the signaling pathways AP-1, NF-ÿB, and NFAT, resulting in defective T-cell activa- tion and aberrant expression of apoptosis-related proteins, eventually causing deprived T-cell sur- vival [24]. Sadly, we cannot plan cell research to further analyze the effects of T cells and the role of the cell cycle.
Overall, the present study assessed DEGs by means of combined bioinformatics investigation to identify possible biomarkers and to forecast breast cancer growth and prognosis. Our research found that breast cancer development is associated with low ex¬pression of genes in the T cell pro- cess, offering strong evidence for potential genomic-based individualized care. Our study find¬ings show that PRKCQ is associated with T cell pathways and its expression is a good predictor of drug efficacy. PRKCQ could therefore be a biomarker for evaluating breast cancer prognosis. What is novel about this study is that it is the first time to find the relationship between T-cell related path- way genes and che¬motherapy and prognosis. Moreover, our large amount of data is the result of the integration analysis of multiple data sets, which is representative.
Conclusion
In our study, we find that PRKCQ is associated with T cell path-ways and its expression is a good predictor of drug efficacy. It can therefore be used as a biomarker of breast cancer progno¬sis. Our findings also provide strong evidence for future ge-nome-based individualized treatment of breast cancer.
References
- Ferlay J, Shin HR, Bray F, Forman D, Mathers C, et al. (2010) Estimates of worldwide burden of cancer in 2008: GLOBOCAN 2008. Int J Cancer 127: 2893-2917.
- Lin L, Yan L, Liu Y, Yuan F, Li H, et al. (2019) Incidence and death in 29 cancer groups in 2017 and trend analysis from 1990 to 2017 from the Global Burden of Disease Study. J Hematol Oncol 12: 96.
- Peart O (2017) Metastatic Breast Cancer. Radiol Technol 88: 519M-539M.
- Siegel R, DeSantis C, Virgo K, Kevin Stein, Angela Mariot-to, et al. (2012) Cancer treatment and survivorship statistics, 2012. CA: A Cancer Journal for Clinicians 4: 220-241
- Chiang AC, Massagué J (2008) Molecular Basis of Metastasis. The New England journal of medicine 26: 2814-2823.
- Filippini SE, Vega A (2013) Breast cancer genes: beyond BRCA1 and BRCA2. Front Biosci (Landmark Ed 18: 1358-1372.
- Nagini S (2017) Breast Cancer: Current Molecular Therapeutic Targets and New Players. Anticancer Agents Med Chem 17: 152-163.
- Chen B, Khodadoust MS, Liu CL, Newman AM, Alizadeh AA (2018) Profiling Tumor Infiltrating Immune Cells with CIBERSORT. Methods Mol Biol 1711: 243-259.
- Kennedy R, Celis E (2008) Multiple roles for CD4+ T cells in anti-tumor immune responses. Immunol Rev 222: 129-144.
- Reiche EM, Nunes SO, Morimoto HK (2004) Stress, depression, the immune system, and cancer. Lancet Oncol 5: 617-625.
- Acuto O, Di Bartolo V, Michel F (2008) Tailoring T-cell receptor signals by proximal negative feedback mechanisms. Nat Rev Immunol 8: 699-712.
- O’Meara T, Safonov A, Casadevall D, Qing T, Silber A, et al. (2019) Immune microenvironment of triple-negative breast cancer in African-American and Caucasian women.Breast Cancer Res Treat 175: 247-259.
- Takada K, Kashiwagi S, Goto W, Asano Y, Takahashi K, et al. (2018) Significance of re-biopsy for recurrent breast cancer in the immune tumour microenvironment. Br J Cancer 119: 572-579.
- Romaniuk A, Lyndin M (2015) Immune microenvironment as a factor of breast cancer progression. Diagn Pathol 10: 79.
- Xiao Y, Ma D, Zhao S, Suo C, Shi J, et al. (2019) AME Breast Cancer Collaborative Group. Multi-Omics Profiling Reveals Distinct Microenvironment Characterization and Suggests Immune Escape Mechanisms of Triple- Negative Breast Cancer. Clin Cancer Res 25: 5002-5014.
- Burugu S, Asleh Aburaya K, Nielsen TO (2017) Immune infiltrates in the breast cancer microenvironment: detection, characterization and clinical implication. Breast Cancer 24: 3.
- Zhang EY, Kong KF, Altman A (2013) The yin and yang of protein kinase C-theta (PKC theta): a novel drug target for selective immunosuppression. Adv Pharmacol 66: 267-312.
- Baier G, Telford D, Giampa L, Coggeshall KM, Baier Bit-terlich G, et al. (1993) A. Molecular cloning and characterization of PKC theta, a novel member of the protein kinase C (PKC) gene family expressed predominantly in hematopoietic cells. J Biol Chem 268: 4997-5004.
- Meller N, Altman A, Isakov N (1998) New perspectives on PKC theta, a member of the novel subfamily of protein kinase C. Stem Cells 16: 178-192.
- Meller N, Elitzur Y, Isakov N (1999) Protein kinase C-theta (PKC theta) distribution analysis in hematopoietic cells: proliferating T cells exhibit high proportions of PKC theta in the particulate fraction. Cell Immunol 193: 185-93.
- Vyas YM, Mehta KM, Morgan M, Maniar H, Butros L, et al. (2001) Spatial organization of signal transduction molecules in the NK cell immune synapses during MHC class I-regulated noncytolytic and cytolytic interactions. J Immunol 167: 4358-4367.
- Berg Brown NN, Gronski MA, Jones RG, Alisha R Elford, Elissa K Deenick, et al. (2004) PKCθ signals activation versus tolerance in vivo. J Exp Med 199: 743-752.
- Marsland BJ, Soos TJ, Spath G, et al. (2004) Protein kinase C θ Is critical for the development of in vivo T helper Th2 cell but not Th1 cell responses. J Exp Med 200: 181-189.
- Hayashi K, Altman A (2007) Protein kinase C theta (PKCtheta): a key player in T cell life and death. Pharmacol Res 55: 537-544.
- Wu Ting, Dai Yun (2017) Tumor microenvironment and therapeutic response [J]. Cancer Lett 387: 61-68.
- Szklarczyk D, Franceschini A, Wyder S, Forslund K, Heller D, et al. (2015) STRING v10: protein-protein interaction networks, integrated over the tree of life. Nucleic Acids Res 43: D447–52.
- Scardoni G, Tosadori G, Faizan M, Fausto Spoto, Franco Fabbri, et al. (2015) Biological network analysis with Cen-tiScaPe: centralities and experimental dataset integration. F1000Res 139: 1-9.
- Chenwei Li, Boxi Kang, Ge Gao, Cheng Li, Tang Z, et al. (2017) GEPIA: a web server for cancer and normal gene expression profiling and interactive analyses. Nucleic Acids Res.
- Hosmer DW, Lemeshow S, Sturdivant RX (2013) Applied logistic regression. 3rd ed Hobo-ken, New Jersey: Wiley.