
Toxicology and Applied Pharmacology Insights(TAPI)
ISSN: 2641-0451 | DOI: 10.33140/TAPI

Research Article - (2023) Volume 6, Issue 1
Morphometric indices and Oxidative Stress Biomarkers of African Catfish Clarias gariepinus juveniles Exposed to Agricultural Fungicide Mancozeb
2National Biotechnology Development Agency, Arochukwu, Abia State, Nigeria
3Department of Zoology and Environmental Biology, University of Nigeria, Nigeria
Received Date: Sep 05, 2023 / Accepted Date: Sep 24, 2023 / Published Date: Oct 10, 2023
Copyright: ©Â©2023 Francis Chijioke and Ursula Odo, et al. This is an open-access article distributed under the terms of the Creative Commons Attribution License, which permits unrestricted use, distribution, and reproduction in any medium, provided the original author and source are credited.
Citation: Odo, U., Ebuka, I., Chijioke, F., Odo, G, E., (2023). Morphometric indices and Oxidative Stress Biomarkers of African Catfish Clarias gariepinus juveniles Exposed to Agricultural Fungicide Mancozeb. Toxi App Pharma Insights, 6(1), 54-64.
Abstract
The present study investigated the morphometric indices and oxidative stress biomarkers of African Catfish Clarias gariepinus juveniles exposed to agricultural fungicide mancozeb. A total of 150 Clarias gariepinus with standard length and weight that ranged from 9.8 cm to 17.5 cm and 11 g to 55 g respectively were used for the experiment. The 96hours LC50 value of Mancozeb on Claria s gariepinus juveniles was estimated to be 410.90mg/L. The sub-lethal four treatments were exposed to 0.00. 20.55, 41.09 and 82.18 mg/L (A-D) Mancozeb fungicide. Each group were replicated three times consisting of 10 fish per replica summing up to 30 fish. The physico-chemical parameters of water observed for five weeks showed changes and fluctuations on temperature range from 28°C to 32°C, pH levels ranged from 7.3 to12.3, Alkalinity range 0.88 to 4.10mg/L, CO2 values ranged from 3-12.5mg/L. While dissolved oxygen from 6.6 to 7.8mg/L. Behavioral changes observed after 24-96hours of fish exposure to different concentrations of Mancozeb revealed loss of equilibrium status and respiratory difficulties. Morphometric indices such as condition factor and hepatosomatic indices were not significantly different when compared to the control group. The oxidative stress parameters were studied in the kidney, liver and gill tissues and sampling was done on days 1, 7, 14, 21 and 28 (after 7days recovery). The result of the present study on antioxidant parameters revealed that changes on oxidative stress parameters of LPO, CAT, SOD, GPx, GR and MDA were all concentration and duration dependent. Oxidative stress revealed that Lipid peroxidation significantly increased (P�? 0.05) on day 21 and 28 compared to control, CAT was not significantly different when compared to control group. SOD significantly decreased on day 7, 14, 21 compared to control, GPx significantly decreased on day 1 and 21 compared to control, GR significantly increased on day 7 and 21 compared to control, MDA significantly increased on day 1, 28 and 7 compared to control. Mancozeb is moderately to highly toxic to C. gariepinus juveniles. There was no significant difference in the morphometric indices compared to control groups.
Keywords
Mancozeb, Clarias Gariepinus, Morphometric Indices, Oxidative Stress Biomarkers
Introduction
The repeated and indiscriminate use of pesticides due to anthro- pogenic activities have resulted in a large build-up and subsequent discharge of surface water run-off, with damaging consequences to aquatic ecosystem [1]. Schulz reported that, 10% of pesticides re- leased to the soil reach non-target areas more especially in the farms and fields [2]. Sources of agricultural pollutants worldwide, 40% of pesticide is confined to herbicides, 10% to fungicides and the rest of pesticides fall into other classes of pesticides which are accumulated by fish from water, food sediments, and residues [3, 4].
Mancozeb is a synthetic ethylene bisdithiocarbamates belonging to a subclass dithiocarbamates of carbamates pesticides containing manganese Mn2+and Zinc2+ atoms [5]. Mancozeb is classified as a contact or broad spectrum fungicide having a preventive activity characteristic and one of the most used agrochemical on a global scale [6, 7]. Mancozeb has low acute toxicity to aquatic organisms and there are several concerns with degradation by products [8]. Morphometric indices such as condition factor and hepatosomatic indices can be used in environmental toxicological investigations to find out fish health status following exposure to toxicants [9, 10].
Oxidative stress has been identified as a major mechanism by which mancozebcause harmful effects to fish [11]. In fish species oxidative stress is mainly studied in environmental contamination by pollutions [12]. Specifically, oxidative stress induced bymanco- zeb in fish has been linked with manganese- derived reactive oxy- gen species (ROS) formation mechanism [13, 14]. Considering the effects of exposure of fish to different dosages of mancozeb (0.9, 1.5 and 3mg). Atamaniuk et al. evaluated the levels of oxidative stress markers and in the system of antioxidants of kidney, liver and brain of Goldfish Carasiusauratus [15]. The result showed collectively that exposure of this species to fungicides led to the development of mild oxidative stress and activation of antioxidant defense system in the tissues [15]. The present study investigat- ed the morphometric indices and oxidative stress biomarkers of African Catfish Clariasgariepinusjuveniles exposed to agricultural fungicide mancozeb
Method
Procurement of experimental fish
A total of 150 Clariasgariepinusjuveniles with standard length and weight that ranged from 9.8 cm to 17.5 cm and 11 g to 55 g were procured from Freedom Fisheries Limited, University market Road, Nsukka, Enugu, Nigeria and was transported to Fisheries Wet Laboratory, Department of Zoology and Environmental Biol- ogy, University of Nigeria, Nsukka. The Fishes were disinfected with 0.05% potassium permanganate (KMnO4) for 2minutes to avoid any dermal infections, were allowed to acclimatize in the laboratory conditions for 2weeks in plastic tanks of 300Litre (L) Capacity. Fishes were fed daily with food (Aqua-feed commercial feed size 3mm) contaminating 40% crude protein twice daily at 2-3% body weight. Food, faecal matter and other wastes will be siphoned off and water were changed weekly to reduce ammonia content in water. Dead fishes were removed with forceps to avoid possible deterioration of the water quality. During acclimatiza- tion, the water was changed weekly with well aerated tap water. The commercial formulation of Mancozeb 80% WP(Z-FORCE®) weighing 50g with batch number 01062018 marked by Jubaili Agrotec Limited Abuja, Nigeria were procured from Ogige Local Market Nsukka, Enugu State, Nigeria and stored at room tempera- ture.
Experimental design for sublethal exposure
The experimental design for sub-lethal exposure consist of 150 fish for four groups of 0.0, 20.55mg/L, 41.09mg/L and 82.18mg/L (A- D), each with three replicates. Each tank contained 10 litre dechlo- rinated tape water served as the control while the three other treat- ments were exposed to water containing 20.55mg/L, 41.09mg/L and 82.18mg/L of Mancozeb corresponding to1/20, 1/10 and 1/5 of the 96hrs LC50 value that were derived after acute toxicity ex- periment. The experimental duration lasted 28days during which the fish was fed with small quantity of feed approximately 1% of their total body weight about an hour before the test solution were renewed daily. The feeding was to avoid mortality and cannibal- ism.
On each sampling day (1, 7, 14, 21 and 28) three to five fishes from each of the treatment groups including the control were sacri- ficed after anesthesizing with Tricainemethanesulfonate (MS222) to minimize stress. The sacrificed fishes were weighed and blood was collected through caudal puncture while the organs such as Kidney, Liver, gill and Spleen were quickly rinsed in cold 0.9% Sodium chloride solution. Tissues of the Clariasgariepinusfrom each triplicate were homogenized immediately in pre-chilled Po- tassium phosphate buffer (1:10 w/v, 0.1 M, pH 7.0). One part of the homogenate was used for the estimation of lipid peroxidation while the other part was centrifuged for 20 minutes at 10,500 rpm under 4°C to obtain the supernatant which were stored at 4°C for further enzyme assay. After, the end of the sub-lethal exposure, the remaining fish in each of the concentrations were withdrawn from the exposure of chemical and were placed in chemical free water in which further observation were made after 7days of the withdrawal.
Determination of morphometric Indices
The body weight of each fish from the control and each treatment (Triplicate) group were sampled on day 1, 7, 14, 21 and 28days (7days recovery) of the experiment and recorded based on hep- atosomatic index and condition factor. Dissecting kits were used to dissect the liver of the fish. The liver of fish was weighed. The hepatosomatic index and condition factor were calculated based on White and Fletcher method as follows [16]: HSI= liver weight (g)/ body weight (g) x 100/1 CF = Body weight (g)/ standard length (cm)3 x 100/1
Assay on oxidative stress and antioxidant parameters
Tissue lipid peroxidation was measured by estimating the quantity of TBARS according to the method of Sharma and Krishna-Murti and was expressed as nanomoles of TBARS formed/mg protein [17]. Briefly, 1.0 mL of homogenate prepared in KCl solution was incubated at 37°C for 30 min. Proteins were precipitated by adding 1 mL of 10% trichloroacetic acid and then centrifuged at 2,000 × g for 15 min. One mL of supernatant was taken as an aliquot in a separate tube to which 1 mL of thiobarbituric acid reacting sub- stances solution was added. The tubes were kept in a boiling-water bath for 10 min. After the tubes were cooled, the optical density was read at 535 nm.
Tissue catalase was spectrophotometrically determined by mea- suring the rate of H2O2 breakdown based on the decrease in ab- sorbance at 240 nm; the activity was expressed as U/mg protein [18]. Superoxide dismutase (SOD) activity was assayed by the method of Misra and Fridovich (1972), the specific activity being expressed as U/mg protein in the liver and gill tissues [19]. The ac- tivity of glutathione peroxidase (GPx) was measured by the meth- od of Lawrence and Buck (1976), with the specific activity being determined using the extinction coefficient of 6.22 mM/cm [20]. The activity of glutathione reductase (GR) was assayed by mea- suring NADPH oxidation at 340 nM, the activity being expressed as U/mg protein [21]. The total protein contents were determined by the method of Lowry et al.
Statistical Analysis
Data was analysed with Statistical Packages for Social Scienc- es (SPSS) version 20.0 (IBM Corp, Armork, USA) and Statplus v5.9.8 (Analyst soft Inc., Walnut, Canada), probit regression anal- ysis using Finney method (lognormal distribution) for (LC) was recorded. Two-way analysis of variance (ANOVA) was used to compare concentration of Mancozeb and duration of exposure de- pendent effects. The mean was partitioned using DMRT (Duncan Multiple Range Test). Level of significance was set at p<0.05 re- spectively
Results
Physico- Chemical Parameters of the Testwater
The physico-chemical parameters of the test water used for sub-le- thal concentration for 5weeks were shown in table 1. The tempera- ture ranged from 29.4to29.8°C,pH ranged from 9.23 to9.43, Alka- linity ranged from 1.95 to 2.43, CO2ranged from 6.5 to 8.88mg/L, DO2 ranged from 7.0 to 7.15mg/L.
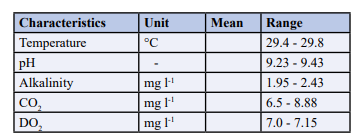
Table 1: Physico-chemical parameters of the water used for the experimentonClariasgariepinus lethal concentration
Behavioral changes and physiological abnormalities of Clarias gariepinus exposed to Mancozeb at different concentration lev- els for both acute and sub-lethal toxicity (Table 2). In the control duration of exposure, normal behavioral responses and no mor- tality were observed. Treatment groups with Mancozeb exhibited physiological and behavioral abnormalities based on increase in duration and concentration. The tanks with higher concentration of the test chemical fish displayed faster opercular movement, jerky movement, erratic swimming, skin coloration, convulsion, hyper- activity, gulping of air, hemorrhage and loss of equilibrium status were also observed. Clarias gariepinus lost equilibrium balance, became exhausted owing to respiratory complications and finally settled down at the bottom and mortality occurred.
|
Duration |
Concen- tration (mg/l) |
Jumping |
Equilibri- um status |
Opercula Move- ment |
Fin movement |
Air Gulping |
Erratic swimming |
Convulsion |
Skin Colouration |
Haemorrhage |
|
24h |
A- Control |
- |
+++ |
+++ |
+++ |
- |
- |
- |
- |
- |
|
|
B- 150 |
- |
+++ |
+++ |
+++ |
+ |
+ |
- |
- |
- |
|
|
C- 300 |
- |
+++ |
+++ |
+++ |
+ |
- |
- |
+ |
- |
|
|
D- 450 |
+ |
+++ |
++ |
++ |
- |
- |
- |
- |
- |
|
|
E- 600 |
++ |
++ |
++ |
++ |
+ |
- |
- |
+ |
- |
|
|
F- 750 |
+++ |
+ |
+ |
+ |
- |
- |
+ |
+ |
- |
|
48h |
A-Control B-150 |
- - |
+++ +++ |
+++ ++ |
+++ +++ |
- + |
- + |
- - |
- + |
- - |
|
|
C-300 |
- |
++ |
++ |
++ |
+ |
- |
- |
- |
- |
|
|
D-450 |
++ |
++ |
++ |
++ |
+ |
+ |
+ |
+ |
- |
|
|
E-600 |
+++ |
++ |
+ |
+ |
++ |
+ |
++ |
++ |
- |
|
|
F- 750 |
+++ |
+ |
+ |
+ |
++ |
- |
++ |
++ |
- |
|
72h |
A-Control B-150 |
- - |
+++ ++ |
+++ ++ |
+++ ++ |
- ++ |
- ++ |
- - |
- ++ |
- + |
|
|
C-300 |
- |
+ |
++ |
++ |
+ |
+ |
++ |
++ |
+ |
|
|
D-450 |
++ |
+ |
+ |
+ |
++ |
+ |
++ |
++ |
+ |
|
|
E-600 |
+++ |
- |
+ |
+ |
++ |
+ |
++ |
++ |
+ |
|
|
F-750 |
+++ |
- |
+ |
+ |
++ |
+ |
+++ |
++ |
+ |
|
96h |
A-Control |
- |
+++ |
+++ |
+++ |
- |
- |
- |
- |
- |
|
|
B-150 |
- |
+ |
++ |
+ |
+ |
+ |
- |
+ |
+ |
|
|
C-300 |
- |
+ |
+ |
+ |
+ |
+ |
++ |
+ |
+ |
|
|
D-450 |
++ |
+ |
+ |
+ |
++ |
+ |
++ |
+ |
+ |
|
|
E-600 |
++ |
- |
+ |
- |
+++ |
++ |
+++ |
+++ |
++ |
|
|
F-750 |
++ |
- |
+ |
- |
+++ |
+++ |
+++ |
+++ |
+++ |
Notes: None=-, Mild=+, Moderate=++, Strong=+++.
Table 2: Effect of Mancozeb on behavioural characteristics of Clariasgariepinus at different concentration levels
|
Mancozeb |
Assay |
Fish specie |
Result |
Reference |
|
|
96h LC50 |
Punctiusticto |
12,95 mg/L |
Sharma et al (2018) |
|
Cyprrinus carpio |
8.03mg/L |
Simakani et al.(2018) |
||
|
Oreochromis niloticus |
11.68mg/L |
Saha et al. (2016) |
||
|
Onchohynchus mykiss |
0.092mg/L |
Atamanalp and Yanik(2003) |
||
|
Clarias batracus Adult |
14.36 mg/L |
Srivastava and Singh(2013) |
||
|
Clarias batricus fingerlings |
14.04 mg/L |
Srivastava and Singh(2013) |
||
|
Clarias gariepinus Juveniles |
410.90 mg/L |
THIS STUDY |
Table 3: Results of various toxicity investigations of mancozeb on some Fish species
Percentage mortality of Clarias gariepinus Juveniles exposed to graded concentration of Mancozeb at 96h increase in toxicant concentration (Table 4). Fishes exposed to 150mg/L, 300mg/L, 450mg/L, 600mg/L and 700mg/L had 5%, 20%, 55%, 70% and 85% which recorded the highest mortality compared to other con- centrations. While no mortality was recorded at the control group. Throughout the exposure duration no absolute (100%) mortality occurred (Table 4)
|
. Groups |
Concentration (mg/l) |
Sample size (n-20) |
Mortality (%age mortality) |
|||
|
24h |
48h |
72h |
96h Survival |
|||
|
Control |
0 |
20 |
0 (0) |
0 (0) |
0 (0) |
0 (0) 100 |
|
A |
150 |
20 |
0 (0) |
1 (5) |
0 (0) |
1 (5) 95 |
|
B |
300 |
20 |
0 (0) |
0 (0) |
1 (5) |
4 (20) 80 |
|
C |
450 |
20 |
3 (15) |
1 (5) |
2 (10) |
11 (55) 45 |
|
D |
600 |
20 |
5 (25) |
4 (20) |
3 (15) |
14 (70) 30 |
|
E |
750 |
20 |
6 (30) |
4 (20) |
6 (30) |
17 (85) 15 |
Table 4: Mortality of Clarias gariepinus exposed to different concentration of Mancozeb
In sub- lethal concentration no mortality was observed and fish displayed abnormal behavioral changes throughout the experi- mental period. Result findings on different investigations of Man- cozeb on some fish species showed variations in LC50based on the pesticide type, duration of exposure and stage of maturity (Table 5). The toxicant concentration in all the groups exposed to Manco- zeb decreased as time progressed. LC50values of Mancozeb with 95% confidence limit of various concentration in Clarias gariepi- nus for the duration of 24, 48, 72 and 96h were 1740.58mg/L(95% cl, 14148.68 – 21088.18), 23044.02mg/L (95% cl,1833.49 – 2842.20), 6211.00mg/L (95% cl, 5129.85 – 7419.65) in Table 5.
|
Percentile |
Concentration (CI = 95%) |
|||
|
24h |
48h |
72h |
96h |
|
|
5 |
803.31 (370 - 1225.09) |
790.56 (334.84 - 1247.46) |
359.58 (176.48 - 533.98) |
50.10 (30.75 - 68.88) |
|
10 |
1845.00 (1432.16 - 2288.01) |
1958.92 (1480.91 - 2477.65) |
779.03 (616.94 - 951.47) |
90.48 (76.52 - 104.91) |
|
20 |
3649.59 (2495.38 - 4609.45) |
4148.07 (2725.40 - 5731.63) |
4163.01 (1030.96 - 1927.60) |
142.79 (111.22 - 175.45) |
|
25 |
5860.12 (5171.78 - 6593.88) |
6964.68 (6068.94 - 7925.13) |
226986 (2022.66 - 2532.12) |
197.52 (181.72 - 214.02) |
|
30 |
7729.28 (6946.22 - 8554.17) |
9439.06 (8391.53 - 10548.21) |
2932.20 (2656.99 - 3221.17) |
238.05 (221.66 - 255.03) |
|
40 |
11080.56 (8856.24 - 13666.09) |
14029.29 (10958.10 - 17647.73) |
4089.51 (3326.22 - 4967.84) |
303.01 (261.07 - 349.67) |
|
50 |
17409.58 (14148.68 - 21088.18) |
23044.02 (18333.49 - 28421.20) |
6211.00 (5129.85 - 7419.65) |
410.90 (357.94 - 468.34) |
|
60 |
27093.76 (22215.10 - 32541.24) |
37458.67 (30093.79 - 45771.59) |
9349.57 ( 7785.55 - 11081.52) |
553.52 (485.05 - 627.28) |
|
70 |
42672.61 (34280.05 - 51987.69) |
61706 (48465 - 76578.34) |
14229.27 (11628.01 - 17090.42) |
751.44 (649.67 - 860.04) |
|
75 |
60939.49 (54765.61 - 67443.09) |
91207.05 (81084.98 - 101924.20) |
19791.39 (17933.23 - 21741.14) |
956.62 (890.73 - 1024.85) |
|
80 |
81047.39 (72290.40 - 90582.85) |
124765.82 (109999.50 - 140931.03) |
25761.92 (23182.31 - 28559.40) |
1159.05 (1073.9 - 1250.13 |
|
90 |
137965.60 (97093.27 - 194366.29) |
224343.28 (152096.49 - 326020.38) |
224343.28 (152096.49 - 326020.38) |
1650.58 (1309.96 - 2090.76) |
|
95 |
281553.07 (215692.84 - 363002.46) |
490702.94 (365522.32 - 647527.59) |
81413.07 (63706.12 - 103095.67) |
2673.79 (2242.65 - 3184.53) |
|
99 |
732795.95 (439342.60 - 1201930.70) |
1412203 (798578.99 - 2412405.62) |
196378.52 (122997.27 - 311944.01) |
5028.27 (3621.46 - 7133.45) |
CI= confidence interval
Table 5: Lethal concentration of Mancozeb on Clarias gariepinus
The estimated safe level of Mancozeb values in Clarias gariepinus varied from 41.09 to 4.109 x 10⁻³mg/L respectively (Table 6).
|
Pesticide |
96hrLC50(mg/l) |
Method |
Application factor |
Safe level(mg/L) |
|
Mancozeb |
410.90 |
Hart et al(1948)* |
- |
1211.21 |
|
Sprague(1971) |
0.1 |
41.09 |
||
|
CWQC(1972) |
0.01 |
4.109 |
||
|
NAS/NAE |
0.1 - 0.00001 |
41.09 - 4.109 × 10⁻³ |
||
|
CCREM(1991) |
0.05 |
20.595 |
||
|
IJC (1977) |
5% LC50 |
20.595 |
* C= 48h LC50 × 0.03S2 Where C is the presumed harmless concentration and S=24h LC50
Table 6: Estimation of safe level for Clarias gariepinus after 96h Exposure
Morphometric indices (Hepatosomatic indices and Condi- tion factor)
In this work the result on condition factor and hepatosomatic in- dices revealed that no significant effect was observed between the control groups and fish treated with Mancozeb which also indi- cated that Mancozeb does not have any serious effect on the liver weight in comparism to the fish body weight. In our study, there was no significant effect of Mancozeb on hepatosomatic indices in Clariasgariepinus (Table 1).
Condition factor
The result on condition factor in this work revealed that no signifi- cant change was observed for the condition factor between control group and fish treated with Mancozeb. This indicated that condi- tion factor of the fish was not altered throughout the duration of the exposure (Table 7).
|
Parameters |
Concentration (mg/L) |
Duration Day 1 |
Day 7 |
Day 14 |
Day 21 |
7days recovery |
|
HSI |
Control |
4.69 ± 1.65a1 |
3.35 ± 0.53a1 |
3.61 ± 0.13a1 |
3.54 ± 0.42a1 |
4.71 ± 0.35a1 |
|
20.55 |
3.42 ± 1.94a1 |
3.77 ± 1.21a1 |
2.53 ± 0.49a1 |
3.68 ± 0.30a1 |
4.07 ± 0.64a1 |
|
|
41.09 |
2.89 ± 0.96a1 |
2.85 ± 0.67a1 |
2.39 ± 0.27a1 |
1.97 ± 0.38a1 |
2.47 ± 0.17a1 |
|
|
82.18 |
2.66 ± 0.70a1 |
3.04 ± 0.48a,1 |
2.24 ± 0.34a1 |
2.69 ± 0.66a1 |
3.83 ± 0.72a1 |
|
|
CF |
Control |
179.29 ± 57.79a1 |
147.09 ± 21.37a1 |
150.66 ± 9.48a1 |
138.83 ± 17.29a1 |
123.22 ± 9.41a1 |
|
20.55 |
215.22 ± 58.35a1 |
149.94 ± 26.96a1 |
166.35 ± 10.40a1 |
151.49 ± 6.43a1 |
153.41 ± 5.82a1 |
|
|
41.09 |
198.29 ± 32.78a1 |
169.90 ± 6.36a1 |
187.95 ± 13.15a1 |
178.07 ± 12.21a1 |
165.97 ± 5.48a1 |
|
|
82.18 |
176.09 ± 12.62a1 |
141.12 ± 11.36a1 |
192.65 ± 3.85a1 |
201.24 ± 24.70a1 |
147.37 ± 10.73a1 |
Table 7: Effect of Exposure to various Sub-Lethal levels of Mancozeb on Hepatosomatic Indices and Condition factor of Clar- iasgariepinus Hepatosomatic indices
Data were presented with mean ± standard deviation. Means with different alphabet superscripts along each column represents sig- nificant differences for the concentrations while Means with dif- ferent number superscripts along each row represent significant differences for the exposure duration.
Effects of different concentration of mancozeb on oxidative stress biomarkers
Oxidative stress biomarkers parameters such as LPO, SOD, GPx, GR and MDA had significant difference in different tissues (Kid- ney, liver and Gill) except CAT across treatment groups and ex- posure durations compared to their controls for 28days (Table 8). Our results showed duration and concentration dependant increase in LPO reflecting increased oxidative stress in Clariasgariepinus exposed to Mancozeb on day 21 was higher in the gills group C than Liver compared to day 28 (7days recovery) which had low LPO level in the kidney Control. CAT indicated that there was no significant difference on the Catfish tissue (Kidney, liver and gill) exposed to Mancozeb across different treatment groups and peri- ods for 28days. The pesticide had higher effect on day 7 Kidney control compared to day 1 for kidney group C. Our result on SOD showed significant increase and fluctuating trends on the catfish tissues (Kidney, liver and gills) exposed to Mancozeb across dif- ferent treatment groups and periods for 28days. The pesticide had higher effect on day 7 gills group C compared to day 21 for liver group A. SOD significantly decreased on 7, 14, and 21 compared to controls, but was as higher in tissues controls.
Our result on GPx showed significant reduction and fluctuation trends on the catfish tissues (Kidney, liver and gill) exposed to Mancozeb across different treatment groups and period for 28days compared to control. The pesticide had higher effect on day 1 gill group A compared to day 21day liver group C to control.
Our result with GR showed significant increase and fluctuation trend on the Catfish tissues (kidney, liver and gill) exposed to Man- cozeb across different treatment and periods for 28 days. The pes- ticide had higher effect on day 21 gills group C compared to day 1 kidney control. Our result on MDA showed significant increase and fluctuation trend on the Catfish tissues (Kidney, liver and gill) exposed to Mancozeb across different treatment groups and peri- ods for 28 days. The pesticide had higher effect on day 1 gill group C compared to day 28 kidney control.
|
Parameters |
Tissue |
Concentra- tions (mg/L) |
1Day |
7Day |
14Day |
21Day |
7Days recov- ery |
|
LPO |
Kidney |
Control |
4.36 ± 0.15bc,1 |
4.13 ± 0.31ef,1 |
3.09 ± 0.34e,1 |
3.08 ± 0.29g,1 |
2.64 ± 0.17e,1 |
|
|
|
20.55 |
4.86 ± 0.39abc,23 |
5.80 ± 0.27def,12 |
6.20 ± 0.04cd,12 |
7.23 ± 0.44ef,1 |
3.40 ± 0.39de,3 |
|
|
|
41.09 |
4.53 ± 0.10bc,23 |
5.59 ± 0.08def,2 |
6.53 ± 0.37bcd,12 |
8.48 ± 0.18def,1 |
3.35 ± 0.16de,3 |
|
|
|
82.18 |
4.48 ± 0.14bc,23 |
6.03 ± 0.43cde,2 |
6.15 ± 0.01cd,2 |
8.88 ± 0.38de,1 |
3.91 ± 0.53cde,3 |
|
|
Liver |
Control |
4.20 ± 0.28c,1 |
3.89 ± 0.27f,1 |
3.50 ± 0.73e,1 |
3.61 ± 0.20g,1 |
3.87 ± 0.45cde,1 |
|
|
|
20.55 |
4.34 ± 0.16bc,2 |
5.92 ± 0.25def,2 |
8.05 ± 0.23abc,1 |
9.61 ± 0.11cd,1 |
5.90 ± 0.26abc,2 |
|
|
|
41.09 |
4.48 ± 0.18bc,2 |
6.09 ± 0.43cde,2 |
8.30 ± 0.34ab,1 |
10.31 ± 0.16bcd,1 |
4.90 ± 0.26bcd,2 |
|
|
|
82.18 |
4.46 ± 0.17bc,4 |
7.73 ± 0.17bc,23 |
8.75 ± 0.32a,2 |
10.94 ± 0.35bc,1 |
5.75 ± 0.10abc,34 |
|
|
Gill |
Control |
6.71 ± 0.36a,1 |
6.75 ± 0.17cd,1 |
5.97 ± 0.18d,1 |
6.73 ± 0.19f,1 |
7.59 ± 0.08a,1 |
|
|
|
20.55 |
6.17 ± 0.05abc,3 |
8.03 ± 0.21abc,23 |
8.74 ± 0.10a,2 |
11.26 ± 0.26abc,1 |
7.59 ± 0.08a,23 |
|
|
|
41.09 |
6.33 ± 0.15ab,3 |
9.51 ± 0.13ab,2 |
9.33 ± 0.15a,2 |
11.98 ± 0.21ab,1 |
6.20 ± 0.05ab,3 |
|
|
|
82.18 |
6.55 ± 0.34a,3 |
9.98 ± 0.18a,2 |
9.63 ± 0.49a,2 |
13.01 ± 0.23a,1 |
6.33 ± 0.27ab,3 |
|
CAT |
Kidney |
Control |
0.65 ± 0.07a,1 |
0.72 ± 0.02a,1 |
0.64 ± 0.08a,1 |
0.59 ± 0.09a,1 |
0.58 ± 0.08a,1 |
|
|
|
20.55 |
0.40 ± 0.05a,1 |
0.41 ± 0.02a,1 |
0.39 ± 0.03a,1 |
0.41 ± 0.04a,1 |
0.39 ± 0.06a,1 |
|
|
|
41.09 |
0.40 ± 0.10a,1 |
0.41 ± 0.05a,1 |
0.44 ± 0.05a,1 |
0.47 ± 0.02a,1 |
0.47 ± 0.11a,1 |
|
|
|
82.18 |
0.30 ± 0.01a,1 |
0.35 ± 0.03a,1 |
0.36 ± 0.02a,1 |
0.38 ± 0.07a,1 |
0.38 ± 0.03a,1 |
|
|
Liver |
Control |
0.56 ± 0.04a,1 |
0.60 ± 0.04a,1 |
0.62 ± 0.06a,1 |
0.63 ± 0.03a,1 |
0.60 ± 0.06a,1 |
|
|
|
20.55 |
0.67 ± 0.04a,1 |
0.70 ± 0.03a,1 |
0.66 ± 0.03a,1 |
0.64 ± 0.06a,1 |
0.58 ± 0.11a,1 |
|
|
|
41.09 |
0.40 ± 0.07a,1 |
0.48 ± 0.10a,1 |
0.44 ± 0.14a,1 |
0.34 ± 0.03a,1 |
0.40 ± 0.03a,1 |
|
|
|
82.18 |
0.38 ± 0.07a,1 |
0.44 ± 0.09a,1 |
0.49 ± 0.09a,1 |
0.54 ± 0.09a,1 |
0.58 ± 0.09a,1 |
|
|
Gill |
Control |
0.52 ± 0.06a,1 |
0.58 ± 0.05a,1 |
0.57 ± 0.08a,1 |
0.56 ± 0.09a,1 |
0.59 ± 0.09a,1 |
|
|
|
20.55 |
0.58 ± 0.05a,1 |
0.60 ± 0.03a,1 |
0.64 ± 0.05a,1 |
0.68 ± 0.04a,1 |
0.71 ± 0.03a,1 |
|
|
|
41.09 |
0.37 ± 0.06a,1 |
0.40 ± 0.08a,1 |
0.43 ± 0.07a,1 |
0.47 ± 0.07a,1 |
0.51 ± 0.06a,1 |
|
|
|
82.18 |
0.38 ± 0.01a,1 |
0.41 ± 0.01a,1 |
0.45 ± 0.02a,1 |
0.47 ± 0.01a,1 |
0.52 ± 0.01a,1 |
|
SOD |
Kidney |
Control |
7.80 ± 0.18f,5 |
8.43 ± 0.13g,2 |
8.08 ± 0.40c,3 |
8.64 ± 0.18b,1 |
7.94 ± 0.51f,4 |
|
|
|
20.55 |
7.71 ± 0.46g,1 |
7.17 ± 0.38i,2 |
6.02 ± 0.19f,4 |
5.07 ± 0.31e,5 |
7.04 ± 0.23h,3 |
|
|
|
41.09 |
7.75 ± 0.45f,2 |
6.16 ± 0.03j,3 |
5.56 ± 0.24h,4 |
4.46 ± 0.17f,5 |
7.79 ± 0.42g,1 |
|
|
|
82.18 |
7.23 ± 0.38g,2 |
5.91 ± 0.25k,3 |
5.83 ± 0.18g,3 |
3.67 ± 0.29h,4 |
8.14 ± 0.50e,1 |
|
|
Liver |
Control |
8.41 ± 0.14d,1 |
8.09 ± 0.39h,3 |
7.31 ± 0.13e,4 |
8.31 ± 0.34c,2 |
8.38 ± 0.13d,12 |
|
|
|
20.55 |
7.93 ± 0.51e,2 |
9.64 ± 0.12f,1 |
5.62 ± 0.21h,4 |
2.79 ± 0.44k,5 |
6.20 ± 0.04j,3 |
|
|
|
41.09 |
8.37 ± 0.12d,2 |
10.22 ± 0.50e,1 |
5.64 ± 0.27h,4 |
2.99 ± 0.18i,5 |
7.04 ± 0.35h,3 |
|
|
|
82.18 |
8.66 ± 0.02c,2 |
10.26 ± 0.39e,1 |
4.82 ± 0.43i,4 |
2.87 ± 0.10j,5 |
6.34 ± 0.05i,3 |
|
|
Gill |
Control |
10.38 ± 0.15a,3 |
10.42 ± 0.12d,3 |
11.08 ± 0.29a,2 |
11.56 ± 0.07a,1 |
11.48 ± 0.13a,1 |
|
|
|
20.55 |
10.02 ± 0.44b,3 |
11.57 ± 0.71c,1 |
8.75 ± 0.10b,4 |
6.18 ± 0.04d,5 |
11.11 ± 0.39b,2 |
|
|
|
41.09 |
10.32 ± 0.01a,3 |
12.12 ± 0.40b,1 |
7.66 ± 0.25d,4 |
5.00 ± 0.23e,5 |
11.13 ± 0.43b,2 |
|
|
|
82.18 |
10.30 ± 0.05a,3 |
13.31 ± 0.39a,1 |
7.23 ± 0.24e,4 |
3.95 ± 0.40g,5 |
10.65 ± 0.19c,2 |
|
GPX |
Kidney |
Control |
4.12 ± 0.29f,3 |
4.97 ± 0.33c,2 |
4.52 ± 0.10c,3 |
5.23 ± 0.28b,1 |
4.29 ± 0.07e,3 |
|
|
|
20.55 |
4.79 ± 0.44d,1 |
3.81 ± 0.42e,2 |
3.31 ± 0.33e,3 |
2.71 ± 0.08d,4 |
4.30 ± 0.34e,1 |
|
|
|
41.09 |
4.36 ± 0.19ef,1 |
3.47 ± 0.15ef,2 |
3.20 ± 0.01e,2 |
2.24 ± 0.19ef,3 |
3.42 ± 0.25f,2 |
|
|
|
82.18 |
4.56 ± 0.08de,1 |
3.17 ± 0.11g,2 |
3.25 ± 0.40e,2 |
2.08 ± 0.29fg,3 |
4.13 ± 0.28e,1 |
|
|
Liver |
Control |
5.47 ± 0.15c,3 |
5.41 ± 0.41b,3 |
5.99 ± 0.23b,2 |
6.58 ± 0.42a,1 |
5.90 ± 0.27ab,2 |
|
|
|
20.55 |
5.49 ± 0.16c,2 |
4.84 ± 0.42c,3 |
3.14 ± 0.28e,4 |
2.13 ± 0.29efg,5 |
6.16 ± 0.11a,1 |
|
|
|
41.09 |
5.65 ± 0.02c,2 |
3.83 ± 0.18e,3 |
2.65 ± 0.49f,4 |
2.39 ± 0.13def,4 |
6.24 ± 0.05a,1 |
|
|
|
82.18 |
5.30 ± 0.45c,2 |
3.26 ± 0.10f,3 |
2.49 ± 0.14f,4 |
1.85 ± 0.18g,5 |
6.22 ± 0.05a,1 |
|
|
Gill |
Control |
6.24 ± 0.04b,1 |
6.42 ± 0.27a,1 |
6.47 ± 0.24a,1 |
5.50 ± 0.17b,2 |
5.95 ± 0.16ab,2 |
|
|
|
20.55 |
6.73 ± 0.33a,1 |
3.62 ± 0.29ef,34 |
3.81 ± 0.33d,3 |
3.26 ± 0.08c,4 |
5.72 ± 0.33bc,2 |
|
|
|
41.09 |
6.37 ± 0.24ab,1 |
3.48 ± 0.15ef,3 |
3.68 ± 0.34d,3 |
2.06 ± 0.28f,4 |
5.06 ± 0.22d,2 |
|
|
|
82.18 |
6.57 ± 0.32ab,2 |
4.23 ± 0.21d,3 |
3.65 ± 0.16d,4 |
2.54 ± 0.13de,5 |
5.51 ± 0.16c,2 |
|
GR |
Kidney |
Control |
4.12 ± 0.29f,3 |
13.53 ± 0.54e,1 |
12.56 ± 0.07g,2 |
12.83 ± 0.18h,2 |
13.66 ± 0.16g,1 |
|
|
|
20.55 |
4.79 ± 0.44e,4 |
15.83 ± 0.19c,2 |
15.99 ± 0.29e,2 |
17.48 ± 0.64g,1 |
14.00 ± 0.19f,3 |
|
|
|
41.09 |
4.36 ± 0.19ef,5 |
15.49 ± 0.65d,3 |
16.58 ± 0.42c,2 |
19.57 ± 0.07a,1 |
13.54 ± 0.31g,4 |
|
|
|
82.18 |
4.56 ± 0.08e,5 |
15.89 ± 0.53c,3 |
18.65 ± 0.21a,2 |
19.54 ± 0.13a,1 |
14.48 ± 0.07e,4 |
|
|
Liver |
Control |
15.00 ± 0.43b,5 |
15.49 ± 0.15d,4 |
15.96 ± 0.49e,3 |
16.08 ± 0.25e,2 |
16.45 ± 0.16ab,1 |
|
|
|
20.55 |
15.66 ± 0.26a,5 |
16.14 ± 0.36b,4 |
17.62 ± 0.42b,2 |
18.21 ± 0.03c,1 |
16.61 ± 0.41a,3 |
|
|
|
41.09 |
15.68 ± 0.29a,5 |
17.19 ± 0.53a,3 |
18.51 ± 0.10a,2 |
19.12 ± 0.43b,1 |
16.03 ± 0.42c,4 |
|
|
|
82.18 |
15.93 ± 0.31a,5 |
17.29 ± 0.15a,3 |
18.85 ± 0.11a,2 |
19.48 ± 0.11a,1 |
16.26 ± 0.11bc,4 |
|
|
Gill |
Control |
14.46 ± 1.04e,2 |
15.27 ± 0.83h,1 |
12.98 ± 3.29h,4 |
13.90 ± 4.17k,3 |
9.69 ± 0.61j,5 |
|
|
|
20.55 |
14.57 ± 1.17e,4 |
17.39 ± 0.80g,3 |
18.60 ± 0.13g,2 |
10.21 ± 1.17i,5 |
10.21 ± 1.17i,5 |
|
|
|
41.09 |
14.57 ± 1.17e,4 |
17.42 ± 0.79g,3 |
19.58 ± 1.11f,2 |
25.43 ± 0.54h,1 |
10.05 ± 0.47i,5 |
|
|
|
82.18 |
13.44 ± 0.43fg,3 |
18.10 ± 1.29f,2 |
18.45 ± 0.03g,2 |
26.65 ± 1.13g,1 |
11.72 ± 1.58h,4 |
|
MDA |
Kidney |
Control |
13.80 ± 0.39f,1 |
13.40 ± 1.32i,1 |
11.47 ± 1.99i,4 |
12.05 ± 1.39l,3 |
12.68 ± 0.95g,2 |
|
|
|
20.55 |
13.06 ± 0.44g,4 |
17.77 ± 0.75g,3 |
24.15 ± 0.70e,2 |
28.83 ± 0.32f,1 |
17.71 ± 0.78d,4 |
|
|
|
41.09 |
13.43 ± 0.53fg,5 |
18.26 ± 1.29f,3 |
24.90 ± 1.02d,2 |
30.94 ± 0.47e,1 |
14.71 ± 0.77f,4 |
|
|
|
82.18 |
13.40 ± 0.52g,5 |
23.08 ± 0.45d,3 |
26.26 ± 0.95c,2 |
32.83 ± 1.05d,1 |
17.24 ± 0.30e,4 |
|
|
Liver |
Control |
22.26 ± 1.97a,2 |
21.55 ± 1.54e,3 |
19.96 ± 2.31f,4 |
22.30 ± 1.54i,2 |
25.09 ± 2.82a,1 |
|
|
|
20.55 |
18.52 ± 0.16d,2 |
24.09 ± 0.64c,3 |
26.23 ± 0.30c,3 |
33.77 ± 0.78c,2 |
18.69 ± 0.17c1,1 |
|
|
|
41.09 |
13.43 ± 0.53fg,5 |
18.26 ± 1.29f,3 |
24.90 ± 1.02d,2 |
30.94 ± 0.47e,1 |
14.71 ± 0.77f,4 |
|
|
|
82.18 |
13.40 ± 0.52g,5 |
23.08 ± 0.45d,3 |
26.26 ± 0.95c,2 |
32.83 ± 1.05d,1 |
17.24 ± 0.30e,4 |
|
|
Gill |
Control |
22.26 ± 1.97a,2 |
21.55 ± 1.54e,3 |
19.96 ± 2.31f,4 |
22.30 ± 1.54i,2 |
25.09 ± 2.82a,1 |
|
|
|
20.55 |
18.52 ± 0.16d,2 |
24.09 ± 0.64c,3 |
26.23 ± 0.30c,3 |
33.77 ± 0.78c,2 |
18.69 ± 0.17c,1 |
|
|
|
41.09 |
19.00 ± 0.45c,4 |
28.54 ± 0.40b,2 |
27.99 ± 0.46b,3 |
35.95 ± 0.62b,1 |
18.59 ± 0.14c,5 |
|
|
|
82.18 |
19.65 ± 1.02b,4 |
29.94 ± 0.53a,2 |
28.90 ± 1.48a,3 |
39.03 ± 0.69a,1 |
19.00 ± 0.80b,5 |
Table 8: Oxidative Stress biomarkers of Mancozeb
Data were presented with mean ± standard deviation. Means with different alphabet superscripts along each column represent signif- icant differences for the concentrations while Means with different number superscripts along each row represent significant differ- ences for the exposure duration.
LPO Lipid peroxidation; CAT Catalase; SOD Superoxide dis- mutase; GPx Glutathione peroxidase; GR Glutathione reductase; MDA Malondialdehyde.
Discussion
In this study, the effect of different treatments of Mancozeb on the morphometric changes in Clariasgariepinusjuviniles were studied. Hepatosomatic indices are indicators used to inspect endocrine disturbance and energy reserve by the fish liver [22]. Fish liver declines in a contaminated aquatic environment and it is a distinc- tive bioindicator of low energy reserve [22]. Condition factor is applied in the investigation of the overall fish health status of being good, excellent or poor condition [23].
In this work the result on condition factor and hepatosomatic in- dices revealed that no significant effect was observed between the control groups and fish treated with Mancozeb which also indi- cated that Mancozeb does not have any serious effect on the liver weight in comparism to the fish body weight. This was in line with Nwani et al. which revealed that there was no significant effect on Condition factor and hepatosomatic indices of Clariasgariepinus exposed to Paraziquantel [24]. Odo et al. obtained similar results when Clariasgariepinuswas exposed to Ivermectin [25]. In another investigation, Alkahemal-Balawi et al. results revealed that Clar- iasgariepinus exposed to Lead acetate showed no significant dif- ference in hepatosomatic indices after 6weeks of exposure which means that Catfish is a hardy fish, as observe in this work [26]. Ox- idative stress has the capacity to produce DNA demage, enzymatic inactivation and perioxidation of cell constitution [27].
Our results showed duration and concentration dependent increase in LPO reflecting increased oxidative stress in Clariasgariepinus exposed to Mancozeb on day 21 was higher in the gills group C than Liver compared to day 28 (7days recovery) which had low LPO level in the kidney Control. The evident increase of Mancoz- eb to the Catfish gills than liver could be as a result of the produc- tion of free radicals that leads to stress. Enhanced level of LPO has been observed in kidney, liver and gills of the fish exposed to both sub-lethal concentrations of Mancozeb at all the exposure periods [28, 29, 30]. Ferreira et al. reported that it could be ascribed to generation of a high level of free radicals which resulted to degen- eration of cell membrane, thereby destroying the organ [31].
Our result on CAT indicated that there was no significant differ- ence on the Catfish tissue (Kidney, liver and gill) exposed to Man- cozeb across different treatment groups and periods for 28 days. The pesticide had higher effect on day 7 Kidney control compared to day 1 for kidney group C.This indicate the higher glycolysis rate under pesticide stress and also the Catalase activity in the liver to sub-lethal exposure to Catlacatla.
Our result on SOD showed significant increase and fluctuating trends on the catfish tissues (Kidney, liver and gills) exposed to Mancozeb across different treatment groups and periods for 28days. The pesticide had higher effect on day 7 gills group C compared to day 21 for liver group A. SOD significantly decreased on 7, 14, 21 compared to controls, but was as higher in tissues con- trols. A fluctuating trend was observed in SOD activity in gill, liver and kidney of Fish exposed to Mancozeb. Decrease of SOD means the inhibition of SOD radical formation [32]. Decrease in SOD activity occurred at higher concentration of Mancozeb exposure during the present study.
Our result on GPx showed significant reduction and fluctuation trends on the catfish tissues (Kidney, liver and gill) exposed to Mancozeb across different treatment groups and period for 28days compared to control. The pesticide had higher effect on day 1 gill group A compared to day 21day liver group C to control. It could be concluded that GPx depletion seems to enhance the risks of ox- idative stress due to a reduced cell production ability since a pos- sible increasedperoxidative overload could be induced by a high SOD activity and it is possible to restore susceptibility and to adapt to oxidative stress by increasing SOD and GPx activities.
Our result with GR showed significant increase and fluctuation trend on the Catfish tissues (kidney, liver and gill) exposed to Man- cozeb across different treatment and periods for 28days. The pes- ticide had higher effect on day 21 gills group C compared to day 1 kidney control. The GR activity in the tissues showed fluctuating trend throughout the exposure period and treatment concentration. They described that replenishment of GR in extra-hepatic tissue could be more problematic, so gills function as an essential bio- marker of pollution. Gill is an essential respiratory organ of fish due to its wide surface area with surrounding water. As a result, the gill is primarily the organ to be affected by environmental con- taminants [33].
Our result on MDA showed significant increase and fluctuation trend on the Catfish tissues (Kidney, liver and gill) exposed to Man- cozeb across different treatment groups and periods for28days. The pesticide had higher effect on day 1 gill group C compared to day 28 kidney control. The induction of MDA in the kidney, liver and gill tissues of C. gariepinusexposed to Mancozeb fungicide in the present investigation were undergoing oxidative stress. Conclu- sively, Odo et al. reported about C. gariepinus exposed to Alimin- ium phosphate resulted to fluctuations or variations in oxidative stress such as CAT, LPO, GPx, MDA, SOD and GR indicated en- hanced transmission which is a sensitive indicator of stress in liver and gills [25]. Increased tranminations during pesticide challenge have been attributed to the need of higher energy demand by fish [25]. While Kaur and Jindal reported about Ctenopharngadonidel- lusexposed to Chlorpyrifos resulted in Fluctuation in LPO, CAT, SOD, GR, GPx respectively in Fish tissues kidney, liver and gill studies revealed that the enhanced productions of reactive oxygen species (ROS) lead to the oxidative damage of lipids, protein and antioxidant defense system of fish. Results showed that Mancozeb affected multiple tissues of fish (gill, liver and kidney), even at low concentrations.
Conclusion
The present study revealed that Clariasgariepinus juviniles exposed to Mancozeb had harmful effects to antioxidant activities except Catalase and Morphometric indices such as condition factor and hepatosomatic indices at different toxicant concentration and du- ration even at low concentrations. Government and Non-govern- mental organization should regulate or implement an ecological biodiversity protection policy to ensure that aquatic breeding sites or habitats are protected from fungicides runoffs. This indicate that mancozeb is moderately to highly toxic to Fish.
References
- Nwani, C. D., Omah, M. C., Ivoke, N., Nwamba, H. O., Ani, C., et al. (2015). Biochemical, haematological and morpho- logical variations in juvenile Clarias gariepinus exposed to Carbendazim® fungicide. African Journal of Aquatic Science, 40(1), 63-71.
- Schulz, R. (2004). Field studies on exposure, effects, and risk mitigation of aquatic nonpointâ?source insecticide pollution: A review. Journal of environmental quality, 33(2), 419-448.
- Alavanja, M. C. (2009). Introduction: Pesticides use and exposure, extensive worldwide. Reviews on environmental health, 24(4), 303-310.
- De, A., Bose, R., Kumar, A., & Mozumdar, S. (2014). Tar- geted delivery of pesticides using biodegradable polymeric nanoparticles (Vol. 10, pp. 978-81). New Delhi: Springer In- dia.
- Pallavi, S., & Ajay, S. (2014). Potential effects of agricultur- al fungicide (Mancozeb) on fish Clarias batrachus. Research Journal of Biological Sciences, 9(4), 129-134.
- Fitsanakis, V. A., Amarnath, V., Moore, J. T., Montine, K. S., Zhang, J., & Montine, T. J. (2002). Catalysis of catechol oxidation by metal-dithiocarbamate complexes in pesticides. Free Radical Biology and Medicine, 33(12), 1714-1723.
- Goldoni, A., & Silva, L. B. D. (2012). Potencial mutagênico do fungicida mancozebe em Astyanax jacuhiensis (Teleostei: Characidae). Bioscience Journal, Uberlândia, 28, 297-301.
- US EPA (US Environmental Protection Agency). (2005). Supplemental Guidance for Assessing Susceptibility from Early-Life Exposure to Carcinogens. EPA/630/R-03/003F. Washington, DC: US EPA.
- Kleinkauf, A., Macfarlane, C., Yeates, S., Simpson, M. G., & Leah, R. T. (2004). A biomarker approach to endocrine dis- ruption in flounder—estrogen receptors, hepatocyte prolifer- ation, and sperm motility. Ecotoxicology and Environmental Safety, 58(3), 324-334.
- Ensibi, C., Pérez-López, M., Rodríguez, F. S., Míguez-Santi- yán, M. P., Yahya, M. D., et al. (2013). Effects of deltamethrin on biometric parameters and liver biomarkers in common carp (Cyprinus carpio L.). Environmental toxicology and pharma- cology, 36(2), 384-391.
- Kubrak, O. I., Atamaniuk, T. M., Husak, V. V., Drohomyrets- ka, I. Z., Storey, J. M.,et al. (2012). Oxidative stress responses in blood and gills of Carassius auratus exposed to the mancoz- eb-containing carbamate fungicide Tattoo. Ecotoxicology and environmental safety, 85, 37-43.
- Yang, C., Lim, W., & Song, G. (2020). Mediation of oxidative stress toxicity induced by pyrethroid pesticides in fish. Com- parative Biochemistry and Physiology Part C: Toxicology & Pharmacology, 234, 108758.
- Gabriel, D., Riffel, A. P. K., Finamor, I. A., Saccol, E. M., Ourique, G. M., et al. (2013). Effects of subchronic manga- nese chloride exposure on tambaqui (Colossoma macropo- mum) tissues: oxidative stress and antioxidant defenses. Ar- chives of environmental contamination and toxicology, 64, 659-667.
- Dolci, G. S., Vey, L. T., Schuster, A. J., Roversi, K., Roversi, K., et al. (2014). Hypoxia acclimation protects against oxi- dative damage and changes in prolactin and somatolactin ex- pression in silver catfish (Rhamdia quelen) exposed to manga- nese. Aquatic toxicology, 157, 175-185.
- Atamaniuk, T. M., Kubrak, O. I., Husak, V. V., Storey, K. B., & Lushchak, V. I. (2014). The mancozebâ?containing carba- mate fungicide tattoo induces mild oxidative stress in goldfish brain, liver, and kidney. Environmental toxicology, 29(11), 1227-1235.
- White, A., & Fletcher, T. C. (1985). Seasonal changes in se- rum glucose and condition of the plaice, Pleuronectes platessaL. Journal of Fish Biology, 26(6), 755-764.
- Sharma, S. K., & Murti, C. K. (1968). Production of lipid per- oxides by brain. Journal of Neurochemistry, 15(2), 147-149.
- Aebi, H. (1984). [13] Catalase in vitro. In Methods in enzy- mology (Vol. 105, pp. 121-126). Academic press.
- Misra, H. P., & Fridovich, I. (1972). The role of superoxide anion in the autoxidation of epinephrine and a simple assay for superoxide dismutase. Journal of Biological chemistry, 247(10), 3170-3175.
- Lawrence, R. A., & Burk, R. F. (1976). Glutathione peroxi- dase activity in selenium-deficient rat liver. Biochemical and biophysical research communications, 71(4), 952-958.
- Tayarani, I., Cloëz, I., Clément, M., & Bourre, J. M. (1989). Antioxidant enzymes and related trace elements in aging brain capillaries and choroid plexus. Journal of neurochemistry, 53(3), 817-824.
- Moslemi-aqdam, M., Namin, J. I., Sattari, M., Abdolmalaki, S., & Bani, A. (2014). Sex ratio, gonadosomatic and hepato- somatic indices of pike (Esox Lucius Linnaeus, 1798) in An- zali Lagoon (Southwest of the Caspian Sea). In Aquaculture America-meeting.
- Kumolu-Johnson, C. A., & Ndimele, P. E. (2010). Length- weight relationships and condition factors of twenty-one fish species in Ologe Lagoon, Lagos, Nigeria. Asian Journal of Agricultural Sciences, 2(4), 174-179.
- Nwani, C. D., Nnaji, M. C., Oluah, S. N., Echi, P. C., Nwamba,H. O., et al. (2014). Mutagenic and physiological responses in the juveniles of African catfish, Clarias gariepinus (Burchell 1822) following short term exposure to praziquantel. Tissue and Cell, 46(4), 264-273.
- Odo, U. U., Christian Ezeoyili, I., Aguzie, I. O., Oluah, S. N., Madu, J., et al. (2020). Effect of ivermectin® on biometric characteristics and organ biomarkers of African catfish Clar- ias gariepinus. Marine and Freshwater Behaviour and Physi- ology, 53(1), 17-33.
- Alkahemal-Balawi, H. F., Ahmad, Z., Al-Akel, A. S., Al- Misned, F., Suliman, E. A. M., et al. (2011). Toxicity bio- assay of lead acetate and effects of its sub-lethal exposure on growth, haematological parameters and reproduction in Clarias gariepinus. African journal of biotechnology, 10(53), 11039.
- Nwani, C. D., Nagpure, N. S., Kumar, R., Kushwaha, B., & Lakra, W. S. (2013). DNA damage and oxidative stress modu- latory effects of glyphosate-based herbicide in freshwater fish,Channa punctatus. Environmental toxicology and pharmacol-ogy, 36(2), 539-547.
- Oruç, E. Ö., & Usta, D. (2007). Evaluation of oxidative stress responses and neurotoxicity potential of diazinon in different tissues of Cyprinus carpio. Environmental toxicology and pharmacology, 23(1), 48-55.
- Li, Z. H., Velisek, J., Zlabek, V., Grabic, R., Machova, J., et al. (2010). Hepatic antioxidant status and hematological param- eters in rainbow trout, Oncorhynchus mykiss, after chronic exposure to carbamazepine. Chemico-biological interactions, 183(1), 98-104.
- Amin, K. A., & Hashem, K. S. (2012). Deltamethrin-induced oxidative stress and biochemical changes in tissues and blood of catfish (Clarias gariepinus): antioxidant defense and role of alpha-tocopherol. BMC veterinary research, 8, 1-8.
- Ferreira, D., Da Motta, A. C., Kreutz, L. C., Toni, C., Loro, V. L., et al. (2010). Assessment of oxidative stress in Rhamdia quelen exposed to agrichemicals. Chemosphere, 79(9), 914- 921.
- Ural, M. Å?. (2013). Chlorpyrifos-induced changes in oxidant/ antioxidant status and haematological parameters of Cyprinus carpio carpio: ameliorative effect of lycopene. Chemosphere, 90(7), 2059-2064.
- Khoshnood, Z., Khodabandeh, S., Shahryari Moghaddam, M., & Mosafer Khoorjestan, S. (2011). Histopathological and pathomorphological effects of mercuric chloride on the gills of Persian Sturgeon, Acipenser persicus, fry. ECOPERSIA, (1), 23-32.