
Advances in Machine Learning & Artificial Intelligence(AMLAI)
ISSN: 2769-545X | DOI: 10.33140/AMLAI
Impact Factor: 1.755

Research Article - (2025) Volume 6, Issue 2
Mobile App Development for Monitoring Goat Activities
Received Date: Mar 17, 2025 / Accepted Date: Apr 15, 2025 / Published Date: Apr 23, 2025
Copyright: ©2025 Samy M.S. Elmasri, et al. This is an open-access article distributed under the terms of the Creative Commons Attribution License, which permits unrestricted use, distribution, and reproduction in any medium, provided the original author and source are credited.
Citation: Elmasri, S. M. S., Tahir, N. I. M., & Al-Talib, A. A. M. (2025). Mobile App Development For Monitoring Goat Activities. Adv Mach Lear Art Inte, 6(2), 01-07.
Abstract
"Mobile App Development for Monitoring Goat Activities" aims to create an automated and efficient system for managing goat feeding and water consumption. The primary objectives are to build a prototype using a camera and sensors for data collection, analyze a data logging system to record feeding habits and water consumption, and develop a mobile application to allow farmers to monitor the feeding system in real-time. The prototype, constructed using a Raspberry Pi 4 equipped with a camera module and ultrasonic sensors, collects real-time data on the status of feeding troughs, detecting whether they are empty, partially empty, or full. A YOLOv8n deep learning model was trained on a comprehensive dataset of images to classify these statuses accurately. The data logging system records and analyzes feeding habits and water consumption patterns, providing valuable insights into the goats' behavior and ensuring they have consistent access to food and water. The mobile application developed for this project, integrated with the Blynk app, provides farmers with real-time notifications and detailed reports on the feeding system's status. This allows for timely interventions, better resource management, and improved animal welfare. The project successfully combines hardware and software solutions to enhance the efficiency of goat farming, reducing manual labor and setting a foundation for future innovations in automated livestock management. By demonstrating the potential of integrating AI and IoT technologies in agriculture, this project highlights the benefits of continuous monitoring and timely alerts in maintaining a well-managed and sustainable farming operation.
Keywords
Automated Goat Feeding System, Machine Learning, Sustainable Farming, Yolov8, Ai in AgricultureIntroduction
Precision Livestock Farming (PLF) revolutionizes goat feeding management by integrating advanced technology for enhanced efficiency and sustainability. Utilizing computer vision and stra- tegically placed cameras, our system accurately captures and logs goat feeding behavior, eliminating errors from manual observa- tions. Smart sensors monitor water consumption, feed disappear- ance, and environmental factors, providing comprehensive data. This empowers farmers with actionable insights to improve animal welfare and productivity. By combining cutting-edge technology with an intuitive mobile app, this project aims to create a sustain- able, data-driven approach to goat farming, transforming tradi- tional practices into precise and informed management strategies [1,2]. To dynamics analysis with moving bodies, the selection of the numerical integration method is crucial for the realization of the actual dynamics occurring in the real world. It cannot be solved by a simple way to chip the time step of the integration in the ex- plicit numerical method. In the implicit numerical integration, it will help to refine the time step adaptively [3].
Humans first domesticated sheep and goats, with goats being domesticated between 6000 and 7000 BC and sheep even earlier, between 11000 and 9000 BC [4]. Both species are crucial to livestock, providing food such as they play significant roles in agriculture and biomedical research, with a global population of 2.2 billion. The global consumption of sheep meat is around 2.5 kg per person annually, out of a total meat consumption of 41.6 kg per person [5]. According to the Food and Agriculture Organization (FAO) statistics (2018), the population of sheep and goats is increasing, as illustrated in Figure 1 and Figure 2 [6].

Figure 1: The population of goats in the world was from 1961 to 2018. [Adapted from FAOSTAT]
 |
Figure 2: The population of sheep in the world was from 1961 to 2018. [Adapted from FAOSTAT]
Methodology and Experimental Setup
Started by Engineer AbdiRizak, this project was designed to automatically feed animals. Currently, the project has been improved to work better. Using Raspberry Pi 4 Model B to run several motors and sensors as shown in Table 1. The new design will smooth out feeding by image processing.
|
Components |
Quantity |
|
Raspberry Pi 4 Model B |
1 |
|
Raspberry Pi 4 Heatsink |
1 |
|
RPi Micro-HDMI to Standard HDMI |
1 |
|
USB2.0 Camera Module OV3660 |
1 |
|
HC-SR04 Ultrasonic Sensor |
2 |
|
USB Type C to Type C |
1 |
|
Bracket for Ultrasonic HC-SR04 |
1 |
|
A4988 Stepper Motor Driver Module |
2 |
|
3.7V 2000mAh Li-Ion Battery |
5 |
|
3.7V 3350mAh 18650 Li-Ion Battery |
1 |
Table 1: The planning and control components.
The system will start with an ultrasonic sensor that detects the status of the Feeder Box if it is full or empty. When the Feeder Box is empty, then the system will send a message through the Blynk app to the farmer that you have to fill the Feeder Box up. This notification will help to keep the Feeder Box full. If the farmer fills the Feeder Box, then the system proceeds with the rest of the process.
Water level monitoring is Another important part of the system to make sure goats always have enough water. An ultrasonic sensor will check the trough water level. The relay will turn on the water pump to fill the trough when the water level is low. The relay will turn off the pump to save water when the level required is reached.
Collecting the dataset was the first step in the project. the researcher Handling this work, by setting up a good environment for data collection and creating the troughs using a 3D printer. To get a large enough number of images as shown in Table 2, pictures of the troughs were shot empty, partially empty, and full.
|
Classes |
Number of Images |
|
Empty |
195 |
|
Partially Empty |
112 |
|
Full |
206 |
|
Total |
513 |
Table 2: Number of Images for Each Class.
The images of the object were captured with different orientations and angles. This can enhance the generalization of the model to understand the structure and appearance of the object so that it can identify the object with a different viewpoint and orientation in the real world. Table 3 shows the example images of the three classes for this research.
|
|
Sample images with different angels |
|
|
Empty |
|
|
|
Partially Empty |
|
|
|
Full |
|
|


Table 3: T Sample Images of the troughs after annotation.
Once the images are gathered, the images are imported into Roboflow for data annotations, data pre-processing, and data augmentation. The dataset first undergoes the data annotation process whereby the object in the image is labelled. Then, data pre- processing methods were used to reduce the size of the image to 640 × 640 and auto orient the annotation when there were changes to the image. The size of the dataset is 550 images only. Increasing the size of the training dataset can increase the performance of a deep-learning model. However, a large dataset requires time to capture images, label images, and prepare the dataset. Therefore, the data augmentation techniques are used to artificially increase the size of the dataset by creating a modified version of the existing dataset. Table 4 shows the dataset size for each class after data augmentation. The size of the dataset after data augmentation is 8453 images. Lastly, the dataset was split into the train set, validation set, and test set with a train:val:test ratio of 87:13:0 to be 792:117:0 of images. The dataset is converted into YOLOv8 PyTorch format for use in the training process.
|
Classes |
Number of Images |
|
Empty |
304 |
|
Partially Empty |
190 |
|
Full |
298 |
|
Total |
792 |
Table 4: Number of images for each class after data augmentation
Results and Discussion
Robot Farm
As a result of the project, the robot farm automates the feeding and monitoring water for the goats. A feeder box, feeding troughs, water pump, and water trough are the main elements of the system. Two stepper motors and a servo motor help control the feeder box movement and operation. An ultrasonic sensor for monitoring the food and water level in the booth trough and Feeder Box to ensure it is always full. The Camera is used to control the parts with image processing as shown in Figure 3. All these components work together to make sure the goats get food and water automatically.

Figure 3: Robot Farm.
The training results for the YOLOv8n model, illustrated in Figure 4, show significant improvements in performance metrics. The train/box loss graph indicates a steady decrease from around 0.8 to 0.2 over 100 epochs, signifying enhanced accuracy in predicting trough locations. The train/classification loss reduced substantially from approximately 2.0 to nearly 0.0, highlighting the model's effectiveness in distinguishing between empty, partially empty, and full troughs, leading to high classification accuracy. Additionally, the train/distribution focal loss (DFL) decreased from about 1.3 to below 1.0, reflecting the model's increased precision in locating the troughs. Validation metrics, including Val/box loss and Val/ classification loss, also improved, suggesting that the model generalizes well to new data, minimizing overfitting. Precision and recall metrics provide further insights, with high precision close to 1.0 indicating a low false positive rate and recall values approaching 1.0 demonstrating effective capture of all relevant trough statuses. The mean Average Precision at IoU=0.50 (mAP50) and mAP50-95 remained high, with mAP50 near 1.0 and mAP50- 95 stabilizing around 0.9, confirming the model's robustness and accuracy across various detection challenges.

Figure 4: Training and Validation Metrics for YOLOv8n Model on Trough Status Classification.
The Precision-Confidence Curve in Figure 5 shows how the accuracy of the model's predictions (precision) changes as the confidence level varies. A higher confidence level means the model is more certain about its predictions. In this case, the precision remains very high, close to 1.0, across almost all confidence levels for all trough statuses (empty, partially empty, and full). This means the model is very accurate, even when the confidence level is low, ensuring that most predictions it makes are correct.
The Recall-Confidence Curve in Figure 6 shows how the model's ability to find all true instances changes with different confidence levels. Over many confidence levels, the recall stays almost high at 1.0. This shows that even with a low confidence threshold, the model is rather good in identifying all possible occurrences of the trough statuses. As the model becomes more selective with its predictions, the slight drop in recall at higher confidence levels is normal.
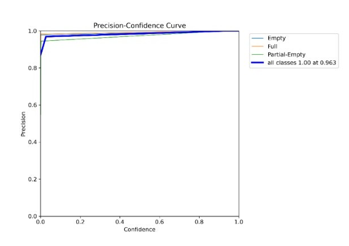
Figure 5: Precision-Confidence Curve
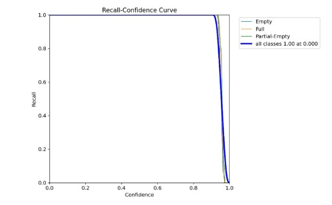
Figure 6: Recall-Confidence Curve
The Precision-Recall Curve in Figure 7 shows how can the model identify and classify the trough statuses. The curve is near the top- right corner, showing that both precision and recall are close to 1.0 for all classes, which means the model is excellent at finding all instances of each class and making accurate predictions. The total precision (mAP @ 0 5) is very high at 0.995 which means the model has very high accuracy and reliability.
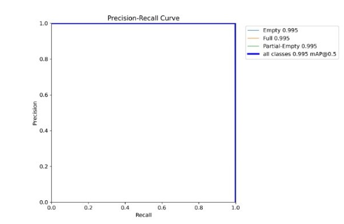
Figure 7: Precision-Recall Curve
The above results can be verified using Figure 8 (Normalized Confusion Matrix). This proportion matrix corrects predictions for each class in the cells. The diagonal elements are all 1.00, indicating that the model correctly classified each trough status with an accuracy of 100%, predicting the entire class without a single mistake. The normalized confusion matrix provides a more interpretable visualization of the model's performance, especially useful for classes with imbalanced distribution. However, in this instance, both the raw counts and the normalized matrix demonstrate perfect classification performance.

Figure 8: Normalized Confusion Matrix.
Discussion
The project developed an automated system to monitor and manage goat feeding troughs, effectively addressing traditional method issues. By integrating a YOLOv8n model with hardware such as the Raspberry Pi 4, ultrasonic sensors, and a camera module, the system accurately identified troughs statuses (empty, partially empty, or full), significantly reducing the need for manual checks through image processing and machine learning. Key steps included collecting and enhancing a large set of trough images, using a deep learning model for object detection, and implementing real-time monitoring with the Blynk app, resulting in timely alerts for farmers. The model demonstrated high precision, recall, and F1 scores, with confusion matrices confirming accurate classification and performance curves indicating reliability. The project's success, driven by careful planning, effective methodology, and advanced technology, reduces farmers' workload, enhances resource management and goat care, and sets the stage for further innovations in automated farming, illustrating the potential of AI and IoT to improve agriculture.
Conclusion
The project successfully created an advanced system for automatically monitoring and managing goat-feeding troughs and solved a key problem in traditional farming methods. By using modern technology like the Raspberry Pi 4, ultrasonic sensors, a USB camera, and the YOLOv8n deep learning model, the system can identify whether the troughs are empty, partially empty, or full. This accuracy is crucial for making sure goats are fed properly and consistently, which directly affects their health and well-being. The project highlighted the importance of having accurate, real-time information, allowing farmers to quickly respond to their animals' needs. During the project, there were several challenges, especially with managing the different power needs of the components andmaking sure they worked well together. These issues were solved with careful planning and creative solutions. For example, using a voltage regulator to ensure the components receive the right amount of power, to keep the system stable and functioning properly. The inclusion of a user-friendly mobile app for real- time alerts made the system practical, enabling farmers to monitor the Feeder Box and take action when needed. The successful operation of this system showed how AI and IoT technologies can be applied in agriculture, demonstrating their potential to improve traditional farming practices. Not only did the project achieve its goals, but it also provided important lessons for future projects looking to use technology in agriculture. This includes expanding the system's abilities to monitor other conditions or using it for different types of farm management. The project's comprehensive approach, from planning to implementation and evaluation, serves as a good example for future projects. By improving the efficiency and accuracy of farm management, this project helps towards the larger goal of enhancing food security and sustainability in agriculture. Overall, the project demonstrates how modern technology can effectively address challenges in farming, leading to more advanced and sustainable agricultural practices.
References
- Norton, T., Chen, C., Larsen, M. L. V., & Berckmans, D. (2019). Precision livestock farming: Building ‘digital representations’ to bring the animals closer to the farmer. Animal, 13(12), 3009-3017.
- Oliveira, D. A. B., Pereira, L. G. R., Bresolin, T., Ferreira,R. E. P., & Dorea, J. R. R. (2021). A review of deep learning algorithms for computer vision systems in livestock. Livestock Science, 253, 104700.
- Saar, M., Edan, Y., Godo, A., Lepar, J., Parmet, Y., & Halachmi,I. (2022). A machine vision system to predict individual cow feed intake of different feeds in a cowshed. Animal, 16(1), 100432.
- Teletchea, F. (2019). Animal domestication: A brief overview. IntechOpen
- .Morris, S. T. (2017). Overview of sheep production systems. In Advances in sheep welfare (pp. 19-35). Woodhead Publishing.
- Food and Agriculture Organization (FAO) Statistics Food. FAOSTAT. (n.d.).