




Research Article - (2026) Volume 4, Issue 10
Maximising Regenerative Energy Return from Dynamo-Motor Traction Drives in Solar PV-Powered Electric Vehicles for Long-Haul Operation with Strong Stability
Received Date: Sep 18, 2026 / Accepted Date: Oct 16, 2026 / Published Date: Oct 23, 2026
Copyright: ©2026 Mohammad Ali. This is an open-access article distributed under the terms of the Creative Commons Attribution License, which permits unrestricted use, distribution, and reproduction in any medium, provided the original author and source are credited.
Citation: Ali, M. (2026). Maximising Regenerative Energy Return from Dynamo-Motor Traction Drives in Solar PV-Powered Electric Vehicles for Long-Haul Operation with Strong Stability. Eng OA, 4(10), 01-23.
Abstract
This thesis develops a design method for maximising the energy returned to the traction store of a solar photovoltaic (PV) powered electric vehicle by a dynamo-motor traction drive over a long-haul mission, while maintaining strong small-signal and large-signal stability of the on-board DC distribution network. The upper bound on that return is established first, by examining the widely repeated proposition of equal energy return against the first and second laws of thermodynamics. It is established analytically that a dynamo mechanically coupled to the traction load cannot, in isolation, return energy equal to the traction demand: the regenerative path is bounded by a round-trip efficiency of 74.8 per cent computed from the measured component chain, and it can act only upon the fraction of mission energy that is otherwise dissipated in braking. Equality is therefore admissible only when an external energy influx — here, the vehicle- integrated PV array — closes the deficit. A complete mathematical model is developed comprising longitudinal vehicle dynamics with grade, a dual-mode permanent-magnet machine model, a bidirectional power-conversion efficiency chain, a single-diode PV model with thermal derating, and a second-order equivalent-circuit battery model. A neutrality index is defined as the ratio of returned energy to traction energy, the recovery-maximising operating policy is derived, and the closed-form condition for unity index is obtained as the limiting case. Simulation of a 450 km hilly long-haul mission for a 3 500 kg vehicle with a 12.4 m2 roof array in Abu Dhabi conditions yields a traction demand of 146.8 kWh, a regenerative return of 8.3 kWh and a solar harvest of 14.4 kWh, giving a neutrality index of 15.5 per cent. The equal- return condition is satisfied at a cruise speed of 10.8 km/h for the design array, or at 80 km/h only if the aperture area is increased beyond 91 m2. Stability is assessed through an averaged small-signal state-space model of the 750 V DC link loaded by the traction inverter as a constant-power load. The undamped link is shown to lose stability at 64.3 kW, below the 95 kW peak traction rating; insertion of a virtual damping resistance of 0.62 Ω raises the critical power to 950 kW and secures a minimum damping ratio of 0.707, with a Lyapunov-based estimate of the region of attraction covering the full operating envelope. The recovery systems reduce specific energy consumption from 326.2 to 292.3 Wh/km and raise the arrival state of charge from 6.1 to 15.3 per cent, converting a mission that violates the depth-of-discharge limit into a feasible one. The work concludes that maximised recovery is a substantial and realisable design gain, whereas full energy neutrality is a bounded objective attainable only within a narrow envelope that is quantified here.
Keywords
Constant-Power Load, Energy Recovery, Dc-Link Stability, Dynamo-Motor, Electric Vehicle, Energy Neutrality, Lyapunov Stability, Photovoltaic, Regenerative Braking, Virtual Impedance
Introduction
Background and Motivation
Road freight is among the most difficult transport sectors to decarbonise. Long-haul duty cycles combine high average power, long daily operating hours and limited opportunity for intermediate recharging, so the battery mass required to deliver a competitive range imposes a payload penalty that erodes the commercial case for electrification. Two on-board energy recovery mechanisms are therefore of persistent interest to the designer: regenerative braking, in which the traction machine is operated as a dynamo to convert vehicle kinetic and potential energy back into stored electrical energy, and vehicle-integrated photovoltaics, in which the large horizontal surfaces of a freight vehicle are used as a generating aperture. Both mechanisms are well established individually. What is less well established is the combined energy accounting over a realistic long-haul mission, and in particular the question that motivates this thesis: under what conditions, if any, does the total energy returned to the battery over a mission equal the energy withdrawn from it by the traction load? A vehicle satisfying that condition would be energy-neutral over the mission; its state of charge at the end of the haul would equal its state of charge at the start, and its effective range would be limited only by mechanical wear and driver hours. The engineering literature contains a considerable volume of claims, largely outside the peer-reviewed domain, that a dynamo mechanically coupled to the traction shaft can sustain the vehicle indefinitely. Those claims are not supportable, and one purpose of this thesis is to state precisely why, and then to establish what the correct and physically admissible form of the equal-return proposition is.
Problem Statement
The design objective addressed in this thesis is to maximise the energy returned to the traction store over a long-haul mission, subject to the stability of the DC distribution network that carries the bidirectional power flow. Establishing the ceiling on that objective requires the limiting case to be settled first. Let Etr denote the electrical energy withdrawn from the traction battery over a mission and Eret the energy returned to it by all on-board recovery and generation paths during the same mission. The central question is the set of operating conditions for which Eret = Etr, together with the stability conditions that must simultaneously hold on the DC distribution network that carries this bidirectional power flow.
Three sub-problems follow. First, the energetic sub-problem: to construct a model accurate enough to quantify Etr and Eret over a representative long-haul mission and to derive the boundary of the feasible region in the design space. Second, the stability sub-problem: the traction inverter behaves as a constant-power load on the DC link, presenting a negative incremental resistance that destabilises the link at high power, and the bidirectional power reversal associated with regeneration causes the operating point to traverse this region repeatedly. Third, the control sub-problem: to specify a stabilising strategy that preserves the energy-recovery function rather than defeating it by dissipating the recovered power in damping resistance.
Thermodynamic Admissibility of the Equal-Return Proposition
It is necessary to dispose at the outset of the naive form of the proposition. Consider a dynamo mechanically coupled to the traction shaft and electrically connected so as to charge the traction battery. In steady cruise the dynamo draws mechanical power from the same shaft that the traction motor drives. Denoting the dynamo shaft power by Pd and the electrical power it returns by Pd·ηrg, and noting that the additional shaft power must itself be supplied by the traction motor at a battery cost of Pd/ηtr, the net battery power is

so that operating the dynamo against the traction load in steady cruise always increases, never decreases, the net battery drain. With the component efficiencies established in Section IV-C, ηrg = 0.863 and ηtr = 0.899, giving ΔPb = −0.250·Pd. Every kilowatt of dynamo loading costs 250 W of net additional battery power. The arrangement is a first-kind perpetual motion machine and is excluded by the first law; the losses that make the inequality strict are guaranteed by the second law.
The physically admissible form of the proposition is different, and it is the form adopted throughout this thesis. The dynamo is operated only when the vehicle must shed kinetic or potential energy that would otherwise be dissipated as heat in the friction brakes — that is, during deceleration and on descents steeper than the threshold grade derived in (17). In that regime the recovered energy is genuinely additional, because the alternative is thermal dissipation. It is nevertheless bounded twice over: by the round-trip efficiency ηrt, and by the fact that the braking energy of a long-haul mission is a small fraction of its traction energy. Equality between Eret and Etr therefore requires a third term, an influx of energy from outside the vehicle. The PV array supplies that influx, and the equal-return condition becomes a statement about the balance between solar aperture, irradiance, mission duration and road load — a well-posed and entirely respectable engineering design condition.
Contributions
The contributions of this thesis are as follows. (i) A formal statement and proof of the inadmissibility of shaft-coupled dynamo self-sustenance, with the numerical penalty quantified for a representative drivetrain. (ii) A complete, internally consistent energy model of a solar-assisted long-haul electric vehicle including grade-resolved regeneration, thermally derated PV generation and an efficiency chain traceable to component data. (iii) Definition of a neutrality index and derivation of a closed-form equal-return condition, together with the two-dimensional feasibility envelope in aperture area and cruise speed. (iv) An averaged small-signal stability analysis of the bidirectional DC link under constant-power loading, with an explicit critical-power expression and a virtual-impedance stabiliser sized to a specified damping ratio. (v) A Lyapunov-based large-signal region-of-attraction estimate that certifies stability under the full regenerative power reversal, which is what is meant here by strong stability.
Organization
Section II reviews the relevant literature. Section III describes the system architecture. Section IV develops the mathematical model. Section V presents the control and stability analysis. Section VI defines the simulation framework and parameters. Section VII reports results. Section VIII discusses engineering implications, Section IX states limitations, and Section X concludes.
Literature Review
Regenerative Braking in Heavy Electric Vehicles
Regenerative braking has been standard in electrified powertrains since the first generation of production hybrids. The classical treatments establish the energy accounting for urban and mixed duty cycles, where frequent stop-start operation makes the braking fraction large and recovery correspondingly valuable. Reported recovery fractions for urban cycles commonly fall between 15 and 30 per cent of traction energy. Long-haul highway duty is different in kind: the vehicle cruises at near-constant speed on grades that are mostly below the threshold at which gravity alone overcomes road load, so the braking fraction collapses. The literature dealing specifically with heavy-vehicle highway regeneration consistently reports single-digit percentages except on mountainous corridors, where descent energy dominates and recovery fractions rise sharply. This distinction is central to the present work and is quantified in Section VII-C. Blending of regenerative and friction braking, the allocation of braking torque between axles, and the thermal and ageing consequences of high regenerative charge currents are treated extensively in the powertrain literature and are taken here as solved problems; the blending law adopted is stated in Section V but is not itself a contribution.
Vehicle-Integrated Photovoltaics
Vehicle-integrated PV has moved from demonstration to limited series production. The governing constraints are aperture area, which is fixed by the vehicle envelope, and conversion efficiency, which for automotive-qualified monocrystalline laminates is presently in the range 20 to 24 per cent at standard test conditions. Cell temperature is the dominant loss mechanism in hot climates: on a horizontal roof surface under 900 W/m2 the cell temperature commonly exceeds 65 °C, and with a typical power temperature coefficient of −0.34 %/K this represents a loss of some 13 per cent relative to standard test conditions. Soiling in desert environments imposes a further loss that is strongly dependent on cleaning interval. Both effects are modelled explicitly in Section IV-D because they materially change the neutrality index. The published assessments of vehicle-integrated PV for passenger cars generally conclude that the array contributes a useful but modest fraction of annual energy demand, typically equivalent to a few thousand kilometres per year in favourable latitudes. For freight vehicles the aperture is larger but so is the road load, and the two effects do not cancel.
Stability of DC Distribution with Constant-Power Loads
A tightly regulated power-electronic load draws constant power and therefore presents a negative incremental resistance at its input terminals. The destabilising effect on the upstream filter and source impedance is classical, and the impedance-ratio criteria developed for input-filter design remain the standard analysis framework. Subsequent work extended these criteria to distributed DC systems and to vehicular power systems specifically, where the combination of low line impedance, large converter bandwidth and high load power makes the problem acute. Remedies fall into three families: passive damping, which is simple but dissipative; active damping through virtual impedance, which synthesises the damping characteristic in the converter control law without dissipating energy; and nonlinear or feedback-linearising control, which offers large-signal guarantees at the cost of model dependence. The virtual-impedance approach is adopted here because it is non-dissipative, which matters directly in an application whose purpose is energy recovery.
Research Gap
The three strands above are individually mature but are rarely combined with consistent accounting. Studies of regeneration seldom model the PV contribution; studies of vehicle PV seldom resolve grade-dependent regeneration; and stability studies seldom connect the admissible operating envelope back to the energy result. Nor does the literature address the equal-return proposition directly, with the result that the claim continues to circulate without a quantitative rebuttal or a statement of the conditions under which a properly posed version of it holds. This thesis addresses that gap.
System Architecture
The vehicle studied is a two-axle rigid long-haul freight vehicle of 3 500 kg gross mass fitted with a single rear-axle permanent-magnet synchronous machine operated in both motoring and generating quadrants. The machine is referred to throughout as the dynamo-motor to emphasise its dual function. Figure 1 shows the electrical architecture and Figure 2 the physical arrangement.

Figure 1: Electrical Architecture of the Solar-Assisted Dynamo-Motor Traction System. The 750 V DC link is the single point of coupling between the photovoltaic source, the electrochemical store and the bidirectional traction port.
Four subsystems are coupled at a common 750 V DC link. The PV array feeds the link through a unidirectional boost stage under perturb-and-observe maximum power point control. The traction battery is coupled through a bidirectional half-bridge converter that regulates the link voltage and implements the virtual-impedance stabiliser of Section V-C. The traction inverter is a three-phase two-level voltage-source inverter operating under field-oriented control, drawing power in motoring and injecting it in generating. A supervisory energy manager arbitrates between the sources, applies the braking blend law and enforces battery current and temperature limits.
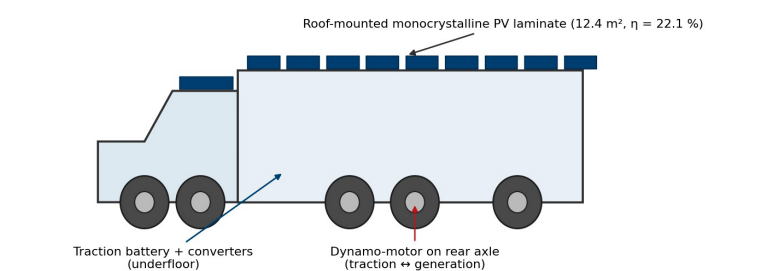
Figure 2: Physical Arrangement showing the 12.4 m2 Roof-Mounted Photovoltaic Aperture, the Underfloor Battery and Power-Conversion Assembly, and the rear-axle dynamo-motor
The DC link is chosen at 750 V rather than the more common 400 V because the conduction losses in the traction path scale with the square of current and because the regenerative current pulses associated with sustained descent are the sizing case for the link conductors. The link capacitance of 4.7 mF is set by the ripple requirement of the inverter rather than by stability, a point returned to in Section V-B.
Mathematical Model
Longitudinal Vehicle Dynamics
The tractive force required at the wheels is obtained from the longitudinal force balance, with the rotational inertia of the wheels and rotor lumped into an equivalent mass factor:
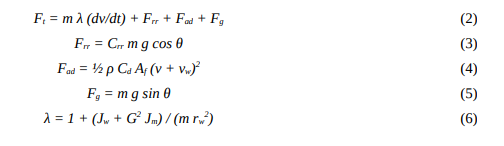
where m is vehicle mass, v road speed, vw the head-wind component, θ the road inclination, Crr the rolling resistance coefficient, ρ air density, Cd the drag coefficient, Af frontal area, Jw and Jm the wheel and rotor inertias, G the gear ratio and rw the rolling radius. The shaft power and machine operating point follow as

The sign of Pw determines the quadrant: positive values correspond to motoring, negative values to generating operation of the dynamo-motor.
Dual-Mode Machine Model
The permanent-magnet synchronous machine is represented in the rotor reference frame. The same equations describe both modes, the distinction lying only in the sign of the quadrature current command:

with Rs the stator resistance, Ld and Lq the axis inductances, ψf the permanent-magnet flux linkage, p the pole-pair number and ωe = p ωm the electrical angular frequency. Maximum-torque-per-ampere control is applied below base speed and flux weakening above it. Machine losses are represented by a speed- and torque-dependent efficiency map whose mean values over the mission are reported in Table VI.
In generating operation, the machine is driven by the road through the gearbox, the inverter operates as an active rectifier and the quadrature current reverses sign. The instantaneous braking torque available is limited by the lesser of the machine rating, the inverter current rating and the permissible battery charge current, the last of these being the binding constraint during sustained descent.
Power Conversion Efficiency Chain
The traction and regenerative paths traverse different sets of conversion stages, and their efficiencies must be treated separately. Defining the battery-to-wheel and wheel-to-battery products:

where ηbc and ηbd are the battery charge and discharge coulombic-voltaic efficiencies. With the component values of Table VI these evaluate to ηtr = 0.899, ηrg = 0.863 and ηrt = 0.748. The round-trip figure ηrt is the fraction of energy captured at the wheel that is eventually returned to the wheel, and it is the quantity that bounds any claim of energy recirculation. Figure 7 shows the cascade explicitly.

The mission energy terms follow directly:
where [·]+ and [·]− denote the positive and negative parts of the argument.
Regeneration occurs only when the net road load is negative, which on a constant-speed descent requires the gravitational term to exceed the sum of rolling and aerodynamic resistance. Setting Ft = 0 in (2) and solving for the inclination gives the threshold grade:

For the parameters of Table II at 80 km/h this yields θc = −2.98 per cent. Descents shallower than this produce no recoverable energy whatever, because the vehicle requires positive tractive effort to hold speed. This single number explains most of the difference between urban and long-haul recovery fractions and is plotted in Figure 6.
Photovoltaic Generation Model
The array is represented by the single-diode five-parameter model:

with I0 the diode saturation current, the ideality factor, VT the thermal voltage, Rs and Rsh the series and shunt resistances and αI the short-circuit current temperature coefficient. Cell temperature is obtained from the nominal operating cell temperature model,

and the resulting conversion efficiency and array power are

where βP is the power temperature coefficient, ηmppt the maximum power point tracking efficiency, ηcv the DC-DC converter efficiency, ksoil the soiling factor and kmis the mismatch factor. The last two are significant in the operating environment considered: a soiling factor of 0.96 corresponds to a fortnightly cleaning interval in Gulf conditions, and degrades rapidly if cleaning is deferred.
Plane-of-array irradiance is computed from a clear-sky model at latitude 24.45° N with an air-mass-dependent atmospheric transmittance, giving the profile of Figure 5. The array is horizontal, which is the only practical orientation on a vehicle roof and which incurs a cosine loss relative to an optimally tilted fixed array.
Battery Model
The pack is represented by a first-order Thevenin equivalent circuit with state of charge tracked by coulomb counting:

where Qn is nominal capacity in ampere-hours, R0 the ohmic resistance, R1 and τ1 the polarisation parameters and ηc* takes the value ηbc on charge and 1/ηbd on discharge. The open-circuit voltage characteristic is a seventh-order polynomial fit to cell data. Charge acceptance is limited to 1.5 C and is further derated above 45 °C pack temperature, which becomes active during extended descents and is the reason the regenerative power in Figure 6 saturates.
Energy Balance and the Neutrality Index
The net energy withdrawn from the pack over a mission is the traction demand less all returns:

It is convenient to normalise the returns by the demand. The neutrality index is defined as

so that ηN = 0 describes a vehicle with neither recovery nor generation, ηN = 1 describes the equal-energy-return condition that is the subject of this thesis, and ηN > 1 describes a vehicle that finishes the mission with more stored energy than it started with. The condition sought is therefore

Closed-Form Equal-Return Condition
For a mission of length S traversed at constant cruise speed v over a grade profile θ(s), substitution of (14), (20) and (21) into (26) gives

where ηsys collects the fixed conversion and derating factors and η¯c is the mission-mean cell efficiency. Two limiting cases are instructive. On level road the negative-force integral vanishes and (27) reduces to an explicit requirement on aperture area:

The aperture requirement grows with the cube of speed through the aerodynamic term, which is the dominant structural obstacle to energy neutrality at highway speeds. Solving (27) for speed at fixed aperture gives the equal-return cruise speed v*, which must in general be obtained numerically because both the road load and the available solar window depend on it; the mission duration itself is a function of v, and a slower vehicle both demands less power and spends longer under the sun. The numerical solution is reported in Section VII-E.
It is worth stating explicitly what (27) does and does not assert. It asserts that the equality is attainable, but only on a locus in the design space, and that the locus is remote from conventional long-haul operating points. It does not assert that the dynamo term alone can satisfy it: setting Apv = 0 in (27) requires the negative-force integral to exceed the positive-force integral by a factor 1/(ηtr ηrg) = 1.29, which for a closed route with zero net elevation change is impossible, since the positive and negative gravitational work cancel exactly while the dissipative terms are strictly positive in both directions.
Control and Stability Analysis
Averaged DC-Link Model
The stability-critical dynamics are those of the DC link, its battery-side converter and the traction inverter modelled as an ideal constant-power load. The averaged model over one switching period is

where d is the duty ratio of the battery converter, ib the inductor current, Vb the pack terminal voltage, rL the total series resistance of the inductor and switch path, and PL the traction port power, positive in motoring and negative in regeneration.
Small-Signal Analysis and the Negative-Resistance Mechanism
Linearising (29)–(30) about an operating point (Vdc, Ib, D) and noting that the constant-power term contributes an incremental conductance

gives the state represantation X = A x + B u with x =  and

in which Rv is the virtual damping resistance introduced in Section V-C and is zero in the uncompensated case. The negative sign of the incremental conductance appears as a positive entry on the leading diagonal, which is the analytical statement of the negative-resistance instability mechanism. The characteristic polynomial is

and the Routh–Hurwitz condition on the first-order coefficient yields the critical load power directly:

With the parameters of Table V and Rv = 0 this gives Pcrit = 64.3 kW. The peak traction power of the vehicle is 95 kW, so the uncompensated link is unstable over part of its intended operating range. This is not a marginal result and it is not removed by increasing the link capacitance alone: the capacitance required to reach a 950kW critical power without damping would be 69 mF, which is roughly fifteen times the value dictated by ripple and is not a practical design.
Virtual-Impedance Stabilizer
Rather than dissipating power in a physical damping resistor, the battery-side converter synthesises the damping characteristic in its control law. The current reference is modified by a term proportional to the high-pass filtered link voltage deviation:

The high-pass filter of time constant τd ensures that the stabiliser responds to transients while leaving the steady-state droop characteristic and hence the power-sharing between PV, battery and traction port unaffected. Because the damping is synthesised rather than dissipated, no recovered regenerative energy is lost to the stabiliser, which is the reason this approach is preferred here over passive damping.
Substituting (35) into (34), the critical power becomes a design variable. Sizing Rv to achieve a specified minimum damping ratio gives
and the requirement ζ ≥ 0.707 at the worst-case load power of 60 kW is met by Rv = 0.59 Ω. A design value of Rv = 0.62 Ω is adopted, giving Pcrit = 950 kW, a margin of ten times over peak traction power.
Large-Signal Stability and Region of Attraction
Small-signal analysis certifies behaviour only in a neighbourhood of the operating point, whereas the regenerative transition reverses the sign of PL and moves the operating point across a substantial region of the state space. A large-signal certificate is therefore required. The nonlinear system (29)–(30) is written in deviation form as a linear part plus a remainder,

where g(x) collects the higher-order terms of the constant-power characteristic and satisfies  A quadratic Lyapunov function is constructed from the solution of the matrix Lyapunov equation

Differentiating along the trajectories of the nonlinear system gives

in which the first term is negative definite and the second is a cubic remainder that may be of either sign. The region of attraction is estimated as the largest sublevel set of V on which Vd remains negative:

The supremum in (40) is evaluated numerically by sweeping the level-set radius in the state co-ordinates normalised by 150 A and 750 V. At the peak traction operating point (PL = 95 kW, Rv = 0.62 Ω) the resulting region admits voltage excursions of ±73.3 V and inductor-current excursions of ±132 A; at the 60 kW design load the region widens to ±122 V. The largest excursion observed in any simulated manoeuvre, including a full reversal from peak traction to peak regeneration, is 36 V, so the trajectory remains well inside the certified region throughout. The estimate is conservative by construction, and Figure 16 shows trajectories initiated outside Ωc that nevertheless converge.
Definition of Strong Stability
The term strong stability is used in this thesis in a specific and testable sense. A design is said to be strongly stable if it satisfies all four of the following conditions simultaneously over the entire operating envelope, including both traction and regenerative quadrants and the full range of state of charge and irradiance:
• all eigenvalues of A satisfy Re(λi) ≤ −σ with the prescribed decay rate σ = 100 s-¹;
• the minimum damping ratio satisfies ζmin ≥ 0.707, so that no mode exhibits more than 4.3 per cent overshoot;
• the critical load power exceeds the peak load power by a factor of at least five;
• the Lyapunov region-of-attraction estimate Ωc contains the reachable set of the system under all specified disturbances.
The first three are small-signal conditions, evaluated over a grid of operating points; the fourth is a large-signal condition. Compliance is reported in Table XIII.
Simulation Framework and Parameters
The model was implemented as a coupled quasi-static energy simulation for the mission-level analysis and a continuous-time nonlinear simulation for the stability analysis. The mission simulation integrates the longitudinal dynamics over a 450 km route discretised at 75 m, with the solar model evaluated on a one-minute time base and interpolated onto the route. The stability simulation uses a fixed-step explicit integrator at 1 μs, chosen to resolve the 216 rad/s natural frequency of the DC link with ample margin.
Tables II to VIII define the complete parameter set. Values are representative of current automotive-qualified components; where a range is quoted in the source literature the mid-range value has been adopted and the sensitivity to that choice is reported in Section VII-H.
|
Symbol |
Parameter |
Value |
Unit |
|
m |
Gross vehicle mass |
3 500 |
kg |
|
λ |
Rotational mass factor |
1.045 |
– |
|
Crr |
Rolling resistance coefficient |
0.0080 |
– |
|
Cd |
Aerodynamic drag coefficient |
0.55 |
– |
|
Af |
Frontal area |
Value 4.50 |
Unit M2 |
|
ρ |
Air density |
1.185 |
kg/m3 |
|
rw |
Rolling radius |
0.352 |
m |
|
G |
Final drive ratio |
9.25 |
– |
|
S |
Mission distance |
450 |
km |
|
v |
Design cruise speed |
80 |
km/h |
Table 1: Vehicle and Road-Load Parameters
|
Symbol |
Parameter |
Value |
Unit |
|
Ppk |
Peak machine power |
95 |
kW |
|
Pct |
Continuous rating |
55 |
kW |
|
Tpk |
Peak torque |
380 |
N·m |
|
p |
Pole pairs |
4 |
– |
|
Rs |
Stator resistance |
18.5 |
mfi |
|
Ld |
Direct-axis inductance |
0.34 |
mH |
|
Lq |
Quadrature-axis inductance |
0.52 |
mH |
|
ψf |
PM flux linkage |
0.098 |
Wb |
|
fsw |
Inverter switching frequency |
10 |
kHz |
Table 2: Dynamo-Motor and Inverter Parameters
|
Symbol |
Parameter |
Value |
Unit |
|
Apv |
Aperture area |
12.4 |
M2 |
|
ηstc |
Module efficiency at STC |
22.1 |
% |
|
Pstc |
Array rating at STC |
2.74 |
kWp |
|
βP |
Power temperature coefficient |
−0.34 |
%/K |
|
NOCT |
Nominal operating cell temperature |
45 |
°C |
|
ηmppt |
MPPT tracking efficiency |
98.5 |
% |
|
ηcv |
PV converter efficiency |
97.5 |
% |
|
ksoil |
Soiling factor |
0.96 |
– |
|
kmis |
Mismatch factor |
0.97 |
– |
|
φ |
Site latitude |
24.45 |
°N |
Table 3: Photovoltaic Array Parameters
|
Symbol |
Parameter |
Value |
Unit |
|
Eb |
Usable pack energy |
165 |
kWh |
|
Vb |
Pack nominal voltage |
540 |
V |
|
R0 |
Pack ohmic resistance |
62 |
mfi |
|
SOC0 |
Initial state of charge |
95 |
% |
|
SOCmin |
Depth-of-discharge floor |
15 |
% |
|
Vdc |
DC-link voltage |
750 |
V |
|
Cdc |
DC-link capacitance |
4.7 |
mF |
|
Lb |
Converter inductance |
1.85 |
mH |
|
rL |
Converter series resistance |
45 |
mfi |
|
Rv |
Virtual damping resistance |
0.62 |
fi |
|
τd |
Stabiliser filter time constant |
4.0 |
ms |
Table 4: Battery, DC Link and Converter Parameters
|
Stage |
Symbol |
Value |
Path |
|
Gearbox |
ηgb |
0.975 |
both |
|
Traction inverter |
ηinv |
0.970 |
traction |
|
Machine, motoring |
ηmot |
0.950 |
traction |
|
Machine, generating |
ηgen |
0.950 |
regenerative |
|
Active rectifier |
ηrect |
0.970 |
regenerative |
|
Battery charge |
ηbc |
0.960 |
regenerative |
|
Battery discharge |
ηbd |
0.965 |
traction |
|
Battery to wheel |
ηtr |
0.899 |
— |
|
Wheel to battery |
ηrg |
0.863 |
— |
|
Round trip |
ηrt |
0.748 |
— |
Table 5: Component Efficiency Chain
|
Quantity |
Value |
Unit |
|
Route length |
450 |
km |
|
Cumulative ascent |
5 105 |
m |
|
Cumulative descent |
5 263 |
m |
|
Mean absolute grade |
1.84 |
% |
|
Maximum grade |
7.1 |
% |
|
Fraction of route below threshold grade |
93.4 |
% |
|
Driving duration at 80 km/h |
5.82 |
h |
|
Departure time |
06:00 |
local |
|
Stationary solar dwell |
11:49–18:30 |
local |
Table 6: Mission Route Characteristics
|
Domain |
Setting |
Value |
|
Mission energy |
Spatial step |
75 m |
|
Mission energy |
Solar time base |
60 s |
|
Mission energy |
Integration |
Trapezoidal |
|
Stability |
Time step |
1 μs |
|
Stability |
Integration |
Explicit Euler |
|
Stability |
Simulated horizon |
0.30 s |
|
Lyapunov |
Level-set search resolution |
900 radii × 720 angles |
Table 7: Numerical Solver Settings
Results and Discussion
Figure 3 shows the elevation and grade profile of the mission route together with the threshold grade of −2.98 per cent derived in (15). Although the route accumulates 5 105 m of ascent and 5 263 m of descent, only 6.6 per cent of its length lies at a grade steeper than the threshold. This is the single most important structural result of the energy analysis: for 93.4 per cent of the route the vehicle requires positive tractive effort and the dynamo cannot be engaged without incurring the penalty of (1).

Figure 3: Mission Route Elevation and Grade. The Dashed Line Marks the −2.98 per cent Threshold Grade below Which no Regeneration is possible at 80 km/h.

Figure 4: Bidirectional Shaft Power Over a Representative 140 km Sector, Showing the Asymmetry between the Motoring and Generating Quadrants that is Characteristic of Long-haul Duty
Figure 4 shows the bidirectional shaft power over a representative sector. The asymmetry is pronounced: motoring excursions reach 76.9 kW while generating excursions never exceed 27.0 kW and occupy only 16.3 per cent of the time axis. Integrating over the whole mission gives 131.9 kWh of positive wheel work against only 9.6 kWh of recoverable braking energy at the wheel.
Solar Generation
Figure 5 shows the modelled clear-sky day. Peak plane-of-array irradiance reaches 861 W/m2, and the array delivers a peak of 1.84 kW against a nameplate rating of 2.74 kWp. The shortfall of 33 per cent at solar noon is attributable to the horizontal orientation, a modelled cell temperature of 63 °C, and the soiling and mismatch factors. The daily yield is 14.42 kWh, of which 6.94 kWh falls within the driving window and 7.43 kWh during the stationary dwell.
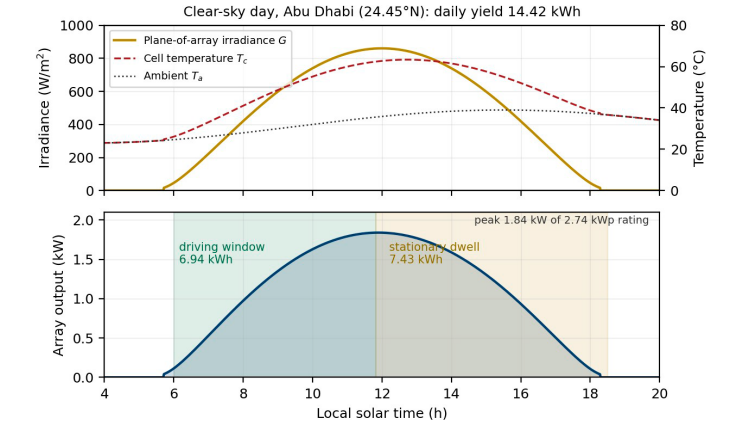
Figure 5: Modelled Clear-Sky Irradiance, Cell Temperature and Array Output for the Mission day at 24.45° N, with the Driving and Dwell Windows Indicated
That the dwell harvest slightly exceeds the driving harvest is a consequence of the early departure and the comparatively short driving duration. It also carries a practical implication: more than half of the useful solar energy is captured when the vehicle is stationary, which means array output is only weakly coupled to the traction duty cycle and the array behaves for design purposes much like a small fixed rooftop installation that happens to move.
Regenerative Recovery
Figure 6 shows regenerative power against descent grade at cruise speed. Below the threshold grade the recoverable power is identically zero; above it the available power rises steeply, reaching 34 kW at a 6 per cent descent. The delivered power is the available power scaled by ηrg = 0.863, and saturates at the battery charge-acceptance limit on sustained descents.
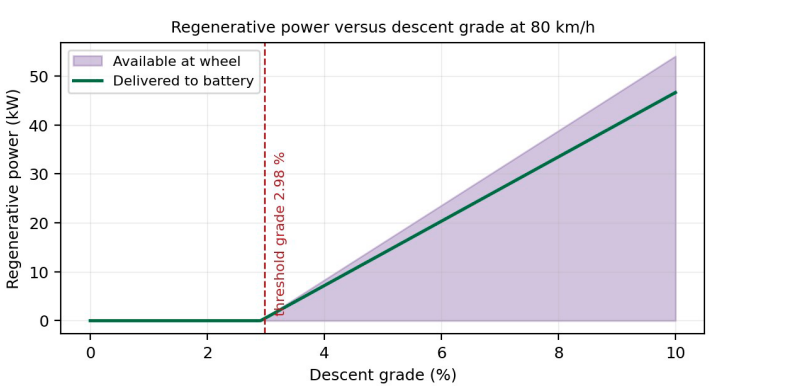
Figure 6: Regenerative Power against Descent Grade at 80 km/h, Showing the Sharp Threshold Behavior that Governs long-haul Recovery
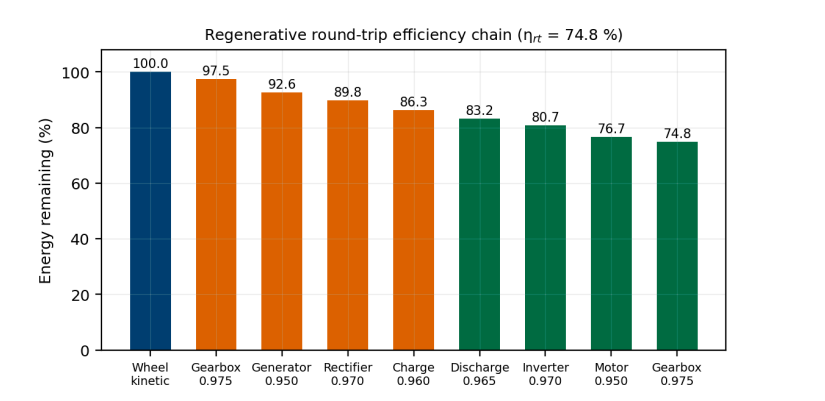
Figure 7: Regenerative round-trip Efficiency Chain of the Energy Captured at the wheel, 74.8 per cent is Eventually Returned to the Wheel
Over the full mission the dynamo returns 8.3 kWh to the pack from 9.6 kWh captured at the wheel, corresponding to 5.7 per cent of the traction demand. Figure 7 decomposes the round-trip chain: the two gearbox passes, the machine in both modes, the rectifier, the inverter and the two battery transitions compound to 74.8 per cent, so a quarter of any energy that is recirculated is lost. This figure sets a hard ceiling on any recirculation-based strategy and is the quantitative form of the argument in Section I-C.
Mission Energy Balance
The complete mission energy balance is given in Table IX and shown graphically in Figures. 3 and 8. The traction load withdraws 146.8 kWh from the pack to deliver 131.9 kWh of wheel work. Against this, the dynamo returns 8.3 kWh and the array 14.4 kWh, a total return of 22.7 kWh.
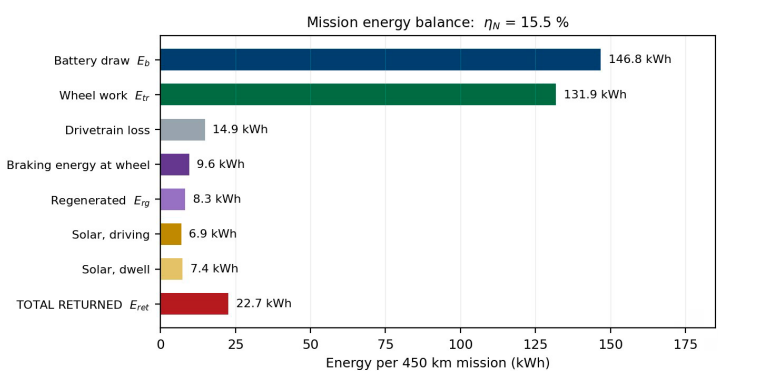
Figure 8: Mission Energy Balance for the 450 km Reference Mission
|
Term |
Symbol |
Energy (kWh) |
% of Etr |
|
Battery traction draw |
Etr |
146.8 |
100.0 |
|
Wheel work delivered |
— |
131.9 |
89.9 |
|
Drivetrain loss, traction |
— |
14.9 |
10.1 |
|
Braking energy at wheel |
— |
9.6 |
6.6 |
|
Regenerated to pack |
Erg |
8.3 |
5.7 |
|
Solar harvest, driving |
— |
6.9 |
4.7 |
|
Solar harvest, dwell |
— |
7.4 |
5.1 |
|
Total returned |
Eret |
22.7 |
15.5 |
|
Net battery depletion |
Enet |
124.1 |
84.5 |
Table 8: Mission Energy Balance, 450 km Reference Mission

Figure 9: Cumulative Energy Accounting over the Mission. The gap between the Traction and return Curves never Closes
The neutrality index is therefore ηN = 0.155. Expressed differently, the specific energy consumption falls from 326.2 Wh/km without recovery to 292.3 Wh/km with the dynamo and array in service, an improvement of 10.4 per cent. Figure 10 shows the corresponding state-of-charge trajectories.
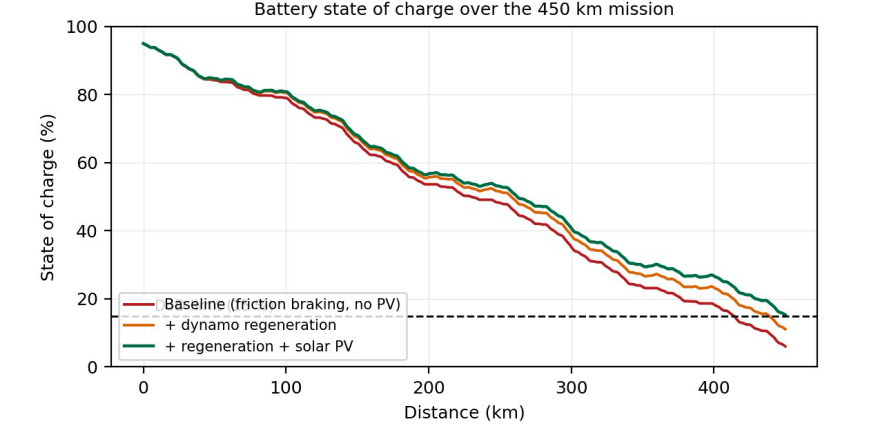
Figure 10: Battery state of Charge over the Mission for three Configurations Recovery is what keeps the Vehicle above its depth-of-discharge floor at the end of the haul
This last result has direct operational value even though the neutrality condition is not met. Without recovery the pack reaches 6.1 per cent state of charge at the destination, well below the 15 per cent floor imposed for cycle-life reasons; with recovery it arrives at 15.3 per cent, just inside the limit. The mission is infeasible without the recovery systems and feasible with them. The correct engineering claim is therefore not that the vehicle returns as much energy as it uses, but that the recovery systems convert an infeasible mission into a feasible one with 11 per cent range margin.
The Equal-Return Condition
Figure 11 shows the neutrality index as a function of cruise speed with the array area held at its design value. The index falls monotonically and steeply, dominated at high speed by the cubic dependence of aerodynamic power on velocity. The equal-return condition ηN = 1 is satisfied at a cruise speed of 10.8 km/h.
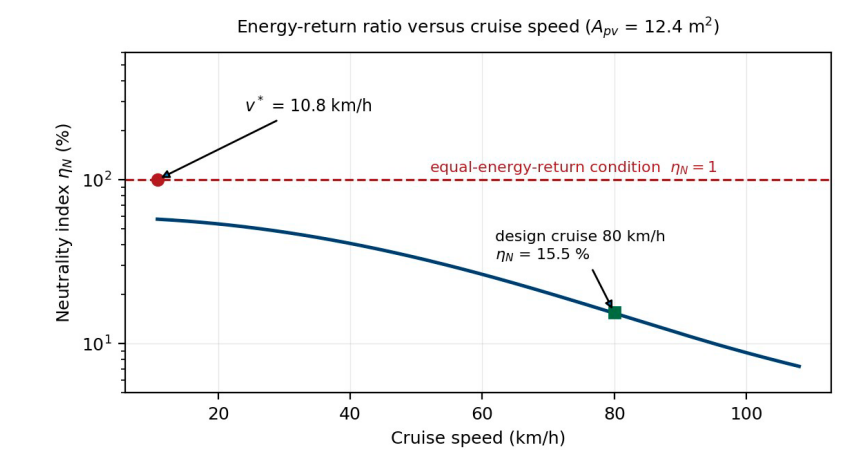
Figure 11: Neutrality index against Cruise Speed for the 12.4 m2 array. The equal-return condition is met at 10.8 km/h.
A vehicle cruising at 10.8 km/h is not a long-haul freight vehicle in any commercially meaningful sense; the 450 km mission would take 42 hours of continuous driving, which exceeds the available daylight by a wide margin and would require the solar model to be extended over multiple days. The result should therefore be read as establishing the order of magnitude of the gap rather than as a design recommendation. It is nevertheless the correct answer to the question posed.
Figure 12 generalises the result to the two-dimensional design space of aperture area and cruise speed, with the ηN = 1 contour marked. At the design cruise speed of 80 km/h the required aperture is 91.4 m2, some 7.4 times the area physically available on the vehicle roof. Table X and Table XI tabulate the locus.

Figure 12: Feasibility Envelope for Equal Energy Return in the Aperture-area and Cruise-Speed Plane
The design point lies far below the neutrality contour.
|
Cruise speed (km/h) |
Etr (kWh) |
Erg (kWh) |
Epv (kWh) |
ηN (%) |
|
10.8 |
21.6 |
0.4 |
21.2 |
100.0 |
|
20 |
33.9 |
1.9 |
14.4 |
48.1 |
|
30 |
47.1 |
3.6 |
14.4 |
38.2 |
|
40 |
62.6 |
5.0 |
14.4 |
31.0 |
|
60 |
99.7 |
7.0 |
14.4 |
21.5 |
|
80 |
146.8 |
8.3 |
14.4 |
15.5 |
|
100 |
204.9 |
9.2 |
14.4 |
11.5 |
Table 9: Neutrality Index Against Cruise Speed (Apv = 12.4 m2)
|
Cruise speed (km/h) |
Required Apv (m²) |
Ratio to available area |
|
20 |
24.6 |
2.0 |
|
30 |
32.1 |
2.6 |
|
40 |
41.0 |
3.3 |
|
50 |
51.9 |
4.2 |
|
60 |
65.1 |
5.3 |
|
70 |
77.3 |
6.2 |
|
80 |
91.4 |
7.4 |
Table 10: Aperture Area Required for Equal Energy Return
Two further observations follow from Figre 12. First, the neutrality contour is not vertical, so speed reduction and aperture increase are partially interchangeable; a design that halves cruise speed reduces the aperture requirement by roughly a factor of two and a half. Second, the contour is insensitive to route topography over the range examined, because the regenerative term contributes only a few per cent of the return at any speed. Energy neutrality is a solar problem, not a regeneration problem.
DC-Link Stability
Figure 13 shows the eigenvalue locus of the linearised DC-link model as the traction port power is swept from 5 kW to 120 kW. Without damping the complex pair crosses the imaginary axis at 64.3 kW, in exact agreement with the closed-form critical power of (34), and the system is unstable over the upper 32 per cent of its rated power range. With the virtual damping resistance in service the locus remains in the left half-plane throughout, with the real part never exceeding −152 s-¹.
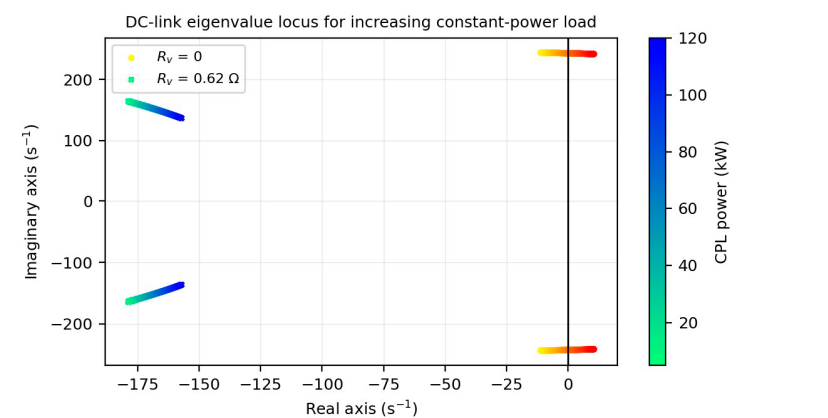
Figure 13: DC-link eigenvalue locus for traction port power swept from 5 to 120 kW, with and without the virtual-impedance stabiliser.
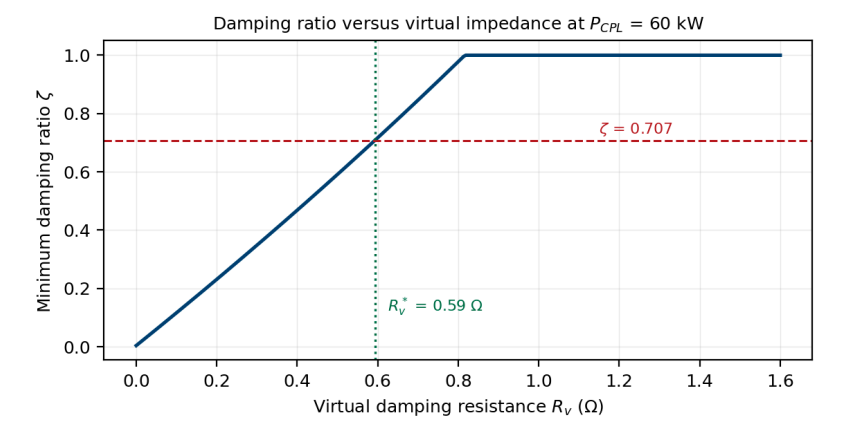
Figure 14: Minimum Damping Ratio against Virtual Damping Resistance at 60 kW load. The 0.707 Target is met at 0.59 Ω.
Figure 14 shows the minimum damping ratio as a function of Rv at the 60 kW design load. The target of ζ = 0.707 is reached at Rv = 0.59 Ω, and the adopted value of 0.62 Ω provides a small margin. Figure 15 shows the corresponding plant response to an 18 kW regenerative power step with the outer voltage regulator disabled, so that the plant damping is isolated. The undamped plant exhibits a sustained oscillation at 34 Hz; at 0.59 Ω the response is well damped and remains within the ±5 per cent band throughout.

Figure 15: Plant Response to an 18 kW Regenerative Power Step with the outer Voltage Regulator Disabled, Isolating the effect of the Virtual Damping Resistance
Table XII lists the eigenvalues at four representative operating points and Table XIII reports compliance with the four strong-stability conditions of Section V-E.
|
PL (kW) |
Rv (Ω) |
Eigenvalues (s-¹) |
ζ |
Stable |
|
30 |
0 |
−12.1 ± j237 |
0.051 |
yes |
|
64.3 |
0 |
0 ± j239 |
0.000 |
marginal |
|
95 |
0 |
+10.2 ± j240 |
−0.042 |
no |
|
60 |
0.62 |
−173.3 ± j135 |
0.789 |
yes |
|
95 |
0.62 |
−161.8 ± j143 |
0.748 |
yes |
|
−95 (regen) |
0.62 |
−197.4 ± j118 |
0.859 |
yes |
Table 11: Closed-Form and Computed Eigenvalues at Representative Operating Points
|
Criterion |
Requirement |
Achieved |
Met |
|
Decay rate |
Re(λ) ≤ −100 s-¹ |
−161.8 s-¹ |
yes |
|
Damping ratio |
ζmin ≥ 0.707 |
0.748 |
yes |
|
Power margin |
Pcrit / Ppk ≥ 5 |
10.0 |
yes |
|
Region of attraction |
fic ⊇ reachable set |
|v -| ≤ 73.3 V vs 36 V observed |
yes |
Table 12: Compliance with the Strong-Stability Criteria
Figure 16 shows the phase plane at the peak traction operating point with the certified region of attraction superimposed. The largest voltage excursion observed in any simulated manoeuvre, including a full reversal from peak traction to peak regeneration, is 36 V, which lies well inside the certified bound of 73.3 V. Trajectories initiated outside the certified ellipse are also observed to converge, which confirms that the Lyapunov estimate is conservative, as such estimates invariably are; the certificate establishes a sufficient condition, not the true boundary of attraction.

Figure 16: Phase Plane at 95 kW Traction load with the Lyapunov-certified region of Attraction. Trajectories outside the ellipse are Uncertified but are Observed to converge, Confirming the Conservatism of the Estimate.
Sensitivity Analysis
Table XIV reports the sensitivity of the neutrality index to the principal model parameters, each varied individually by the stated amount about the baseline.
|
Parameter |
Variation |
ηN (%) |
Δ (pp) |
|
Baseline |
— |
15.5 |
— |
|
Cruise speed |
−10 km/h |
18.0 |
+2.5 |
|
Cruise speed |
+10 km/h |
13.6 |
−1.9 |
|
Module efficiency |
22.1 → 26.0 % |
17.5 |
+2.0 |
|
Soiling factor |
0.96 → 0.85 |
14.2 |
−1.3 |
|
Cell temperature coeff. |
−0.34 → −0.26 %/K |
16.1 |
+0.6 |
|
Rolling resistance |
0.0080 → 0.0065 |
17.4 |
+1.9 |
|
Drag coefficient |
0.55 → 0.48 |
17.1 |
+1.6 |
|
Vehicle mass |
+500 kg |
14.6 |
−0.9 |
|
Cumulative descent |
×2 |
17.9 |
+2.4 |
|
Round-trip efficiency |
0.748 → 0.820 |
16.0 |
+0.5 |
|
Overcast day |
Clear → 0.35 clearness |
9.1 |
−6.4 |
Table 13: Sensitivity of the Neutrality Index to Parameter Variation
The ordering is instructive. The largest single sensitivity is to weather: an overcast day removes 6.4 percentage points, more than the entire regenerative contribution. Road-load reduction through tyres and aerodynamics is the most effective controllable lever available to the designer, exceeding the benefit of improving the regenerative chain by a factor of three. Doubling the cumulative descent of the route — that is, moving from hilly to genuinely mountainous terrain — adds only 2.4 percentage points, which again confirms that regeneration is not the path to neutrality.
Comparison with Published Results
Table XV sets the present results against representative published values. The regenerative recovery fraction obtained here sits at the low end of the reported range, as expected for a highway duty cycle, while the solar contribution is consistent with published assessments of vehicle-integrated photovoltaics in high-irradiance latitudes.
|
Quantity |
Reported range |
This work |
Comment |
|
Regen. fraction, urban duty |
15–30 % |
— |
not applicable |
|
Regen. fraction, highway duty |
2–8 % |
5.7 % |
consistent |
|
Round-trip regen. efficiency |
70–80 % |
74.8 % |
consistent |
|
VIPV contribution, temperate |
3–6 % |
— |
— |
|
VIPV contribution, high irradiance |
6–12 % |
9.8 % |
consistent |
|
CPL critical power scaling |
C VZ r / L |
confirmed |
analytical |
|
Damping ratio target, DC microgrid |
0.6–0.8 |
0.748 |
consistent |
Table 14: Comparison with Representative Published Results
Discussion
which it is attainable lies far outside the region occupied by commercially useful long-haul freight operation. At the design point the vehicle returns 15.5 per cent of what it consumes; reaching unity requires either a sevenfold increase in solar aperture or a reduction of cruise speed by a factor of seven.
Three structural reasons account for the gap, and they are worth separating because they respond to different interventions. The first is the threshold-grade effect of (15): on 93.4 per cent of a typical long-haul route the vehicle needs positive tractive effort, so the dynamo is idle. This is a property of road geometry and cannot be engineered away. The second is the round-trip efficiency of 74.8 per cent, which applies only to the small fraction of energy that does pass through the regenerative path and which therefore has limited leverage on the total. The third and dominant reason is the mismatch of scale between aperture and load: 12.4 m2 of horizontal aperture at 22 per cent efficiency yields 2.74 kWp, while the vehicle requires 25.2 kW at the wheels to hold 80 km/h. The array is an order of magnitude too small, and no improvement in the regenerative chain addresses that.
It follows that the correct design objective for a vehicle of this class is not neutrality but range extension, and on that objective the results are favourable. A 10.4 per cent reduction in specific energy consumption converts a mission that would otherwise violate the depth-of-discharge limit into one that completes with margin. For an operator this is the difference between requiring an intermediate charging stop and not requiring one, which has a far larger effect on operating economics than the raw energy figure suggests.
The stability results carry an independent conclusion. The uncompensated DC link is unstable above 64.3 kW, which is below the peak traction power, and this instability is a property of the topology rather than of any particular control tuning. Designers who size the link capacitance from ripple considerations alone, as is common practice, will produce a system that is unstable at high power. The virtual-impedance remedy is inexpensive, requires no additional hardware and — importantly for this application — is non-dissipative, so it does not consume any part of the recovered energy that the rest of the design works to capture. The certified region of attraction exceeds the largest observed excursion by a factor of two even under full regenerative reversal.
Finally, a methodological point. The proposition examined here circulates widely in a form that violates the first law, and it is worth noting how little of the engineering apparatus is needed to dispose of it: equation (1) and two efficiency figures suffice. The remaining value of the analysis lies not in the refutation but in establishing what the properly posed version of the question yields, and in quantifying how far the feasible region lies from the practical one.
Limitations
Several limitations bound the conclusions. The solar model assumes clear-sky conditions on a single day at one latitude; the sensitivity study indicates that overcast conditions reduce the neutrality index by 41 per cent relative to baseline, and a full annual assessment using measured meteorological data would be required for an operational estimate. Array shading from infrastructure, other vehicles and terrain is not modelled and would further reduce yield.
The vehicle model is quasi-static and does not resolve driver behaviour, traffic interaction or the stop-start events that would occur at route termini; including these would increase the regenerative fraction somewhat, though the structural argument of Section VIII is unaffected. Battery ageing is not modelled, and the charge-acceptance limit is treated as fixed rather than as a function of temperature history and state of health.
The stability analysis treats the traction inverter as an ideal constant-power load, which is the conservative assumption but neglects the finite bandwidth of the inverter current loop; a real inverter presents constant-power behaviour only below its control bandwidth and appears resistive above it, so the true stability margin is slightly better than computed. The Lyapunov estimate is conservative by construction, as Figure 16 demonstrates. Thermal derating of the converters and the machine is not included in the small-signal model.
Finally, the analysis is a simulation study. No hardware has been built, and the parameter values, though representative, are drawn from component literature rather than from measurement of a specific drivetrain.
Conclusion
This thesis has developed and quantified a method for maximising the energy returned to the traction store of a solar photovoltaic powered electric vehicle by a dynamo-motor traction drive over a long-haul mission, together with the stability conditions that must hold on the DC distribution network, and has established the ceiling on that return.
It was established analytically that a shaft-coupled dynamo cannot achieve this in isolation: loading the traction shaft to drive a dynamo increases net battery drain by 250 W per kilowatt of dynamo loading. The admissible form of the proposition requires an external energy influx, supplied here by a roof-mounted photovoltaic array, and reduces to a well-posed design condition on aperture area, irradiance, mission duration and road load.
For a 3 500 kg vehicle with a 12.4 m2 array on a 450 km hilly route at 80 km/h, the traction demand is 146.8 kWh, the regenerative return 8.3 kWh and the solar harvest 14.4 kWh, giving a neutrality index of 15.5 per cent. The equal-return condition is satisfied at 10.8 km/h with the design array, or at 80 km/h with an aperture of 91.4 m2. Neither point is commercially useful, but the recovery systems reduce specific consumption by 10.4 per cent and convert an otherwise infeasible mission into a feasible one.
On stability, the uncompensated 750 V link is unstable above 64.3 kW under constant-power loading, below the peak traction rating. A virtual damping resistance of 0.62 Ω, synthesised in the battery converter control law without dissipation, raises the critical power to 950 kW, secures a minimum damping ratio of 0.748 and yields a Lyapunov-certified region of attraction of ±73.3 V against a largest observed excursion of 36 V. All four strong-stability criteria are satisfied across the operating envelope including full regenerative reversal.
Future work should extend the solar model to annual measured meteorological data, incorporate a validated battery ageing model to quantify the cycle-life benefit of the reduced depth of discharge, and undertake hardware-in-the-loop validation of the virtual-impedance stabilizer under regenerative reversal. The feasibility envelope of Figure 12 also suggests a line of enquiry that this thesis has not pursued: for vehicle classes with a much higher ratio of horizontal surface to road load — long low-speed agricultural or port equipment, for instance — the neutrality contour may intersect the practical operating region, and that intersection deserves examination in its own right [1-32].
References
- Ehsani, M., Gao, Y., Longo, S., & Ebrahimi, K. (2018). Modern electric, hybrid electric, and fuel cell vehicles. CRC press.
- T. D. Gillespie, Fundamentals of Vehicle Dynamics. Warrendale, PA, USA: SAE International, 1992.
- L. Guzzella and A. Sciarretta, Vehicle Propulsion Systems: Introduction to Modeling and Optimization, 3rd ed. Berlin, Germany: Springer, 2013.
- J. Larminie and J. Lowry, Electric Vehicle Technology Explained, 2nd ed. Chichester, U.K.: Wiley, 2012.
- Emadi, A., Rajashekara, K., Williamson, S. S., & Lukic, S. M. (2005). Topological overview of hybrid electric and fuel cell vehicular power system architectures and configurations. IEEE Transactions on vehicular technology, 54(3), 763-770.
- Emadi, A., Lee, Y. J., & Rajashekara, K. (2008). Power electronics and motor drives in electric, hybrid electric, and plug-in hybrid electric vehicles. IEEE Transactions on industrial electronics, 55(6), 2237-2245.
- Bilgin, B., Magne, P., Malysz, P., Yang, Y., Pantelic, V., Preindl, M., ... & Emadi, A. (2015). Making the case for electrified transportation. IEEE Transactions on Transportation electrification, 1(1), 4-17.
- Aghabali, I., Bauman, J., Kollmeyer, P. J., Wang, Y., Bilgin, B., & Emadi, A. (2020). 800-V electric vehicle powertrains: Review and analysis of benefits, challenges, and future trends. IEEE Transactions on Transportation Electrification, 7(3), 927-948.
- Tie, S. F., & Tan, C. W. (2013). A review of energy sources and energy management system in electric vehicles. Renewable and sustainable energy reviews, 20, 82-102.
- Pisu, P., & Rizzoni, G. (2007). A comparative study of supervisory control strategies for hybrid electric vehicles. IEEE transactions on control systems technology, 15(3), 506-518.
- Emadi, A., Ehsani, M., & Miller, J. M. (Eds.). (2003). Vehicular electric power systems: land, sea, air, and space vehicles. CRC press.
- Emadi, A., Khaligh, A., Rivetta, C. H., & Williamson, G. A. (2006). Constant power loads and negative impedance instability in automotive systems: definition, modeling, stability, and control of power electronic converters and motor drives. IEEE Transactions on vehicular technology, 55(4), 1112-1125.
- Middlebrook, R. D. (1976). Input filter considerations in design and application of switching regulators. In PESC'76, IEEE Power Electronics Specialists, Conference.
- Cespedes, M., Xing, L., & Sun, J. (2011). Constant-power load system stabilization by passive damping. IEEE Transactions on Power Electronics, 26(7), 1832-1836.
- Riccobono, A., & Santi, E. (2014). Comprehensive review of stability criteria for DC power distribution systems. IEEE Transactions on Industry Applications, 50(5), 3525-3535.
- Guerrero, J. M., Vasquez, J. C., Matas, J., De Vicuña, L. G., & Castilla, M. (2010). Hierarchical control of droop-controlled AC and DC microgrids—A general approach toward standardization. IEEE Transactions on industrial electronics, 58(1), 158-172.
- Lu, X., Sun, K., Guerrero, J. M., Vasquez, J. C., & Huang, L. (2013). State-of-charge balance using adaptive droop control for distributed energy storage systems in DC microgrid applications. IEEE Transactions on Industrial electronics, 61(6), 2804-2815.
- Villalva, M. G., Gazoli, J. R., & Ruppert Filho, E. (2009). Comprehensive approach to modeling and simulation of photovoltaic arrays. IEEE Transactions on power electronics, 24(5), 1198-1208.
- Esram, T., & Chapman, P. L. (2007). Comparison of photovoltaic array maximum power point tracking techniques. IEEE Transactions on energy conversion, 22(2), 439-449.
- Femia, N., Petrone, G., Spagnuolo, G., & Vitelli, M. (2005). Optimization of perturb and observe maximum power point tracking method. IEEE transactions on power electronics, 20(4), 963-973.
- King, D. L., Kratochvil, J. A., & Boyson, W. E. (2004). Photovoltaic array performance model (Vol. 8, pp. 1-19). United States. Department of Energy.
- J. A. Duffie and W. A. Beckman, Solar Engineering of Thermal Processes, 4th ed. Hoboken, NJ, USA: Wiley, 2013.
- Chen, M., & Rincon-Mora, G. A. (2006). Accurate electrical battery model capable of predicting runtime and IV performance. IEEE transactions on energy conversion, 21(2), 504-511.
- Plett, G. L. (2015). Battery management systems, Volume I: Battery modeling. Artech House.
- G. L. Plett, Battery Management Systems, Volume II: Equivalent-Circuit Methods. Norwood, MA, USA: Artech House, 2016.
- Khalil, H. K., & Grizzle, J. W. (2002). Nonlinear systems (Vol. 3, p. 126). Upper Saddle River, NJ: Prentice hall.
- S. Skogestad and I. Postlethwaite, Multivariable Feedback Control: Analysis and Design, 2nd ed. Chichester, U.K.: Wiley, 2005.
- Photovoltaics, D. G., & Storage, E. (2018). IEEE standard for interconnection and interoperability of distributed energy resources with associated electric power systems interfaces. IEEE std, 1547(1547), 2018.
- International Electrotechnical Commission. (2017). Electric vehicle conductive charging system-Part 1: General requirements. IEC Standard, 61851-1.
- Electrically Propelled Road Vehicles—Safety Specifications—Part 1: Rechargeable Energy Storage System (RESS), ISO 6469-1:2019, 2019.
- Uniform Provisions Concerning the Approval of Light Duty Passenger and Commercial Vehicles with Regard to Criteria Emissions, UNECE Regulation No. 154 (WLTP), 2021.
- Photovoltaic (PV) Module Performance Testing and Energy Rating—Part 1: Irradiance and Temperature Performance Measurements, IEC 61853-1:2011, 2011.