




Research Article - (2026) Volume 4, Issue 9
Mathematical Modelling and Forecasting of Food Price Inflation in The Gambia: Exchange Rate Pass-Through, Regime Dependence, and Comparative Time-Series and Machine Learning Approaches
 , Bai Mbye Cham 2 and Madiba Darry 3
 2University of The Gambia, P.O. Box 3530, Serrekunda, The, Gambia
3School of Agricultural and Food Sciences, ADA University, 61 Ahmadbey Aghaoghlu Str., Baku 1008, Azerbaijan
Received Date: Aug 01, 2026 / Accepted Date: Aug 27, 2026 / Published Date: Sep 08, 2026
Copyright: ©2026 Katim Touray, et al. This is an open-access article distributed under the terms of the Creative Commons Attribution License, which permits unrestricted use, distribution, and reproduction in any medium, provided the original author and source are credited.
Citation: Touray, K., Cham, B. M., Darry, M. (2026). Mathematical Modelling and Forecasting of Food Price Inflation in The Gambia: Exchange Rate Pass-Through, Regime Dependence, and Comparative Time-Series and Machine Learning Approaches. Eng OA, 4(9), 01-17.
Abstract
The Gambia experienced significant food price inflation between 2021 and 2024, with food inflation reaching 24.4% in September 2023 amid dalasi depreciation and elevated global food prices. This study examines whether exchange rate pass-through to food prices is stable or regime-dependent and evaluates alternative approaches for forecasting food inflation. Monthly food and headline Consumer Price Index data from the Gambia Bureau of Statistics for January 2012–August 2025 are combined with FAO-sourced GMD/USD exchange rate data. Engle-Granger cointegration results show no long-run relationship over the full sample (p = 0.43), but significant cointegration during the 2021– 2025 depreciation episode (p = 0.0015), indicating that exchange rate pass-through is regime-dependent and more pronounced during periods of rapid depreciation. Forecast evaluation further shows that an exchange-rate shock regressor performs best over an 18-month holdout period. An earlier six-month forecast also achieved a genuine out- of-sample MAPE of 0.56%. However, Granger causality tests find no statistically significant evidence that exchange rate movements Granger-cause food prices, suggesting that cointegration should not be interpreted as evidence of strict causality. The findings highlight the importance of monitoring exchange-rate shocks and food price dynamics for food security, strategic reserves, and tariff policy in The Gambia.
Keywords
Food Price Inflation, Exchange Rate, Consumer Price Index, Forecasting, Time-Series and Regime Dependence
Introduction
Today, the world food system is facing a unique moment of crisis due to a combination of geopolitical tensions, economic shocks, climate stress and institutional vulnerabilities in global food systems [1]. The increase in food prices has transitioned from being only a short-term effect of agricultural shocks to being a core macroeconomic, development and political problem in small open economies. The past few years have shown how food prices are becoming more dependent on intricate linkages among global commodity markets, exchange-rate fluctuations, energy prices, financial factors and trade shocks [2,3]. COVID-19 highlighted the vulnerability of global food chains, affecting the transportation and logistics system, labour markets, supplies of agricultural inputs and international transport (FAO, 2022). The Russia–Ukraine war was then a major driver of increased uncertainty in global markets for grain, fertilisers and energy, exacerbating these disruptions [2]. The conflict had significant impacts on international food prices and agricultural production costs, especially for nations relying on food imports, as Russia and Ukraine are key exporters of wheat, maize, sunflower oil, and agricultural goods [3,4].
The geopolitical shift in the food markets has put a spotlight on an essential vulnerability of small open economies: reliance on external markets for important consumption goods [5,6]. Import-dependent countries are vulnerable to food price volatility as well as to volatility in international financial markets and foreign exchange rates [7,8]. Countries having small production capacities are extremely vulnerable to external price shocks when there is a rise in global food prices [9]. This is especially important in developing countries, where food is a high share of household budgets and where fiscal space is constrained for the government to undertake broad-based price stabilization programs [4]. As a result, the topic of local food inflation has been linked to other structural problems of poverty, income disparity, political security, and national food security [1,10].
Because food is a large share of the household budget, the welfare implications of food inflation are particularly large for poor consumers [4,11]. The higher real expenditures on basic food items faced by poor households compared to rich households reflect Engel's law, and large food price increases cause a disproportionate decrease in real expenditure on basic food items faced by poor households [12]. There are significant differences between staple food products and many non-essential consumer goods in the ability of households to cut or substitute their purchases when prices rapidly increase [11]. This causes large welfare losses, leads to reduced food intake diversity and raises the risk of being in extreme poverty. Past studies after the food price crises of 2007-2008 and 2010-2011 confirmed that food price shocks can have a significant impact on poverty in developing economies, particularly when there are limited financial coping mechanisms among affected households [2,4,10].
Global experiences in the last few years also show that domestic food supply conditions or local weather events are not the only drivers of food inflation [13]. While climate shocks, local production deficits and global market dynamics are significant, macroeconomic transmission mechanisms are becoming more crucial in shaping the impacts of external shocks on domestic consumers [3,14]. Exchange-rate depreciation is one of the most important channels, directly leading to an inflation of the local currency price of imported foodstuffs on the border [5,7]. A devaluation of the domestic currency leads to a rise in the local currency value of imports in economies where food prices are quoted in foreign currencies, especially the U.S. dollar [8,9]. Importers and wholesalers and retailers then pass on these higher costs along domestic supply chains, to the end consumer in the form of increased food prices, referred to as exchange-rate pass-through (ERPT) [3,13].
The earlier neoclassical view that exchange-rate movements lead to proportionate changes in domestic prices has been severely criticized in the past 30 years by the exchange-rate pass-through literature [14,15]. In their pioneering work on exchange rates and goods prices, Goldberg and Knetter (1997) showed that exchange-rate changes are not always fully passed on since firms respond strategically to market structures. Firms can pass some of the foreign currency shock on to the final consumers, or absorb it in lower profit margins or pass it on to final consumers at a later date, depending on their expectations for future exchange-rate stability [7,11]. This suggests that the empirical link between the exchange rate and domestic food inflation is not rigid, but rather is influenced by the level of market concentration, competitive conditions, and overall macroeconomic expectations [8,13].
There is a strong theoretical link between the theories of imperfect competition, pricing to market behaviour, and trade costs and the concept of pass-through of exchange rates [15]. Krugman (1987) showed that internationally operating companies systematically change their profit margins with the exchange rate to sustain their local market share. Likewise, Dornbusch (1987) emphasized that the degree of industry concentration, trade barriers and the costs of adjusting nominal prices are important in the manner in which the exchange-rate changes pass through the economy. The theoretical underpinnings that were developed determined that currency depreciation does not directly, and automatically, lead to immediate and full rises in consumer prices [11,14]. Rather, the level and pace of pass-through is determined by the dynamic relationship between international trade costs and the pricing power of local market intermediaries [9].
A significant advancement in the pass-through literature, however, has been the fact that pass-through to prices is not fixed in time but is instead state dependent [13]. The general inflationary environment can have a strong effect on firms' pricing decisions, depending on the level of inflation expectations as to whether exchange-rate shocks are interpreted as transitory or permanent. During low and stable inflation rates, companies are inclined to pass on small fluctuations in exchange rates without losing customers, believing that these fluctuations will normalize over time [13,14]. However, in times of ongoing inflation, increased uncertainty, or a significant currency devaluation, companies tend to pass on cost increases much more promptly, willing to accept the idea of ongoing increases in the cost of doing business in the future [3,5]. It implies that a depreciating exchange rate has non¬linear and more inflationary effects in period of macroeconomic crisis than in period of stable macroeconomic conditions [9,11].
In addition, the phenomenon of asymmetric pass-through provides further evidence that price effects on currency movements are not necessarily symmetrical. Downward price rigidity exists because local currency depreciations have been found to lead to larger and faster retail price increases than an equivalent appreciation of the same currency would result in price decreases, as shown by both empirical works. Devereux and Engel (2002) found that exchange-rate volatility directly affects pricing strategies as it introduces cost uncertainty for international traders. Campa and Goldberg (2005) also found significant differences in pass-through rates by country, level of imports, and product. The results indicate that institutional, trade, and macroeconomic stability arrangements have a profound effect on exchange-rate transmission [3,6]. This introduces a central research question regarding whether exchange rate pass¬through to domestic food prices operates as a stable, long-run relationship or as an asymmetric, regime-dependent mechanism activated during rapid depreciations.
Chosen food markets are an important empirical setting to assess the pass-through effects of exchange rates due to their high import dependence and low-price elasticity of demand [9]. Some staple foods, like rice and wheat imports, refined sugar, and vegetable oils are goods that are consumed directly in the household and for which households cannot easily postpone purchases when prices change. As a result, importers & local distributors have a stronger bargaining position to pass the cost of foreign exchange on to the end-user [3,8]. This has been confirmed by Frankel, Parsley and Wei (2012) who found that pass-through is much higher for basic commodities in developing countries and by Baquedano and Liefert (2014) who demonstrated that international price shocks ripple through domestic markets as a function of the degree of regional trade integration and the exchange rate regime.
Additionally, import tariffs and customs duties are another important but under studied structural layer that impacts on domestic food-price transmission [1,8]. Commercial trade tariffs, border levies, and value-added clearance taxes are basically all pushing the landed price for imported agri. commodities, and that then flows straight into exchange rate shocks. So, if governments go for strategic tariff reductions at the border, or allow temporary duty relief for priority food items, they can help calm down those jittery retail food costs that pop up when foreign exchange rates move, and when world market prices do that same sort of thing. Yet, the other side is different, revenue-minded hikes in the tariff, or a dis-coordinated port fee, can bump up wholesale margins, and that ends up increasing price volatility for low-income and vulnerable households [8,17]. This then sets up the main research question: how do import tariffs and border levies interact with foreign exchange shocks in shaping the landed retail price of imported staple foods?
Although the theoretical knowledge is quite rich, there are some critical empirical issues that remain unanswered about cross-country pass-through variations. Previous studies have found that a depreciation of the currency induces domestic food price inflation, but have not offered an explanation of why such devaluation episodes have such widely varying inflation results in different developing economies [6,8]. There are small open economies with significant currency devaluations but limited retail price inflation, as well as those with a modest devaluation of the currency that is met by a sharp increase in food prices [9,18]. This indicates that currency movements that are both fast and volatile, coupled with the domestic tariff sensitivity, are more important than exchange-rate changes, rather than just the latter (Taylor, 2000; Nachega et al., 2024). An interrupted currency depreciation gives the supply chain enough time to make margin adjustments, while sudden currency shocks lead to precautionary margin adjustments and speculative pricing in retail markets [11].
This also holds true for the small African economies where external commodity and currency shocks are compounded by structural market rigidities [6,18]. Structural agricultural productivity and production gaps, lack of storage infrastructure and weak domestic value chains in agriculture mean that many African countries are still highly dependent on imports of food commodities. At the same time, local currencies are subject to high volatility due to their dependence on commodity exports, pressures of external debt service, and inadequate foreign exchange reserves. Consequently, changes in exchange rates and the dynamics of import tariffs are the main factors behind domestic food inflation and household purchasing power in the region [3,18].
Empirical research addressing the role of exchange-rate channels in the inflation process in Sub-Saharan African economies has been growing in importance in recent times [6,18]. Mishra and Montiel (2013) showed that developing countries that have less developed domestic financial markets and are more import dependent are especially vulnerable to external cost shocks. Choudhri and Hakura (2006) showed that exchange-rate pass-through is consistently higher in developing economies, where imports make up a higher share of the average consumer basket. In the same vein, Frimpong and Adam (2010) reported that the exchange rates pass-through effects on Ghanaian inflation is a very high positive value, thus indicating that exchange rate stability is essential for reducing food prices in the country.
Food price inflation has become a key macroeconomic and social vulnerability in Sub-Saharan Africa as a result of high dependence on imports and food price volatility in the global market. The complex impact of post-COVID supply chain disruptions, the Russia-Ukraine war and ongoing currency devaluation has significantly affected food security in the continent. Though these challenges are urgent, empirical studies are highly skewed toward big economies like Nigeria, South Africa, and Kenya, with small import dependent economies not being much represented in academic literature [3,6].
The Gambia's food inflation is an impressive example of the challenges of an open economy exposed to food inflation imported from others. Price of food has a very high weight in the Gambia Consumer Price Index (CPI) basket, around 50%, which makes the national headline inflation very sensitive to food price increases. The country owes more than 60 per cent of its dietary needs to imports, mainly of staple foods such as rice, flour, refined sugar and cooking oil, which are all largely rain-fed, seasonal, and low-yielding. From 2021-24, The Gambia saw food inflation at its highest ever levels, with glooming global supply shocks, rising shipping costs, and consistent pressures on the Gambia's dalasi [3]. However, country specific literature on Gambian inflation dynamics is limited, which is very relevant. Most studies conducted so far, such as those by Touray and Jallow (2025) and Touray, Jallow and Cham (2025) have focused on macro level inflation relationship with aggregate economic growth and government fiscal revenues [19]. These studies demonstrate that inflation is highly disruptive to long-term growth without measuring the high-frequency transmission of exchange rates and global food commodity prices into monthly retail food prices, and without accounting for import tariffs. Despite this, the recent work of Nachega et al. (2024) carried out at the IMF demonstrates that global commodity prices and asymmetric currency pass-through are critical factors contributing to Gambian inflation, even though high-frequency predictive modeling is lacking. This highlights a major empirical gap in Gambian literature: the lack of high-frequency pass-through evidence on whether exchange rate shifts operate linearly or through regime-dependent mechanisms, as well as the absence of evaluated operational monthly forecasting models tailored to small-sample constraints.
In addition to forecasting the transmission of food inflation, which is essential for policy purposes, a key challenge for policy makers is forecasting food inflation with high accuracy at high frequency. Timely and accurate inflation forecasts are crucial for the Central Bank of The Gambia to make sound decisions on monetary policy, maintaining strategic grain stocks and creating social protection buffers [3,6]. Nevertheless, the methodology of forecasting food inflation in small developing economies is challenged by methodological limitations, such as short sample period, non-linear structural break, data collection lag and high sensitivity to external commodity shocks. In the past, the classical econometric specifications applied to time-series forecasting in macroeconomic policy institutions have been mostly based on the Autoregressive Integrated Moving Average (ARIMA) and Seasonal ARIMA (SARIMA) models [12]. Box and Jenkins (1976) provided a rigorous framework for linear time-series modelling that is particularly suited to describing autoregressive trends and cycles and mean reverting properties. Moreover, dynamic vector autoregressive (VAR) and vector error correction models (VECM) have been applied to determine the long-run cointegrating equilibria along with short-run adjustment speed between prices, money supply and exchange rates [6]. But these classical linear models are not well suited to handle non-linear structural shocks or regime shifts in economic series [20,21]. With the explosive growth of computational statistics and machine learning (ML) there has been much speculation about whether or not non-parametric algorithms are superior to linear models for economic forecasting. Unlike strict distributional assumptions, advanced machine learning architectures like Gradient Boosting (XGBoost) and Long Short-Term Memory (LSTM) recurrent neural networks are effective in learning complex non-linear relationships, multi-variable interactions and temporal dependencies [20,22]. LSTM networks were designed by Hochreiter and Schmidhuber (1997) to learn long-term sequence dependencies, and proved to be quite successful in the processing of sequential economic data in periods of market volatility.
But the advantages of machine learning over the classical econometric approach are not guaranteed, especially for small macroeconomic datasets. It has been shown in large scale forecasting competitions, e.g. Makridakis et al. (2018), that when sample sizes are small, noisy macroeconomic data is often prone to overfitting by complex machine learning algorithms and the resulting out-of-sample performance is typically sub-optimal compared to simple linear forecasting benchmarks [20]. This underscores a persistent debate about the value of mathematical sophistication for successful forecasting in small open developing economies with only monthly time-series data. This motivates the final research question of whether flexible machine learning algorithms (XGBoost, LSTM) can outperform classical econometric benchmarks (ARIMA, VECM) when predicting monthly food price inflation in data-constrained environments.
The aim of this study is basically to directly work through those key policy and methodological disagreements, by adopting one shared analytical lens on The Gambia [23]. In other words, the research direction is to see how exchange rate swings, and import tariffs, move through the economy, and how that link shows up in food price inflation in The Gambia. Also, it tries to check how well classical time-series methods stack up against machine learning designs for short term inflation forecasts. First, it pushes the conversation on exchange-rate pass-through by testing non-linearity, pass-through asymmetry, and whether the influence depends on the regime state. And yes, it’s done across different inflation regimes, as well as at different tariff levels [11]. Second, it folds in an import-tariff response piece into the empirical pricing models, so the analysis can evaluate the interaction between customs levies and foreign exchange depreciation [8,17]. Third, it adds to the forecasting side by running what is kind of an empirical “horse race” between more traditional econometric models like ARIMA and VECM, and newer machine learning systems like XGBoost and LSTM, in a setting where the dataset is quite thin or data scarce. [20,2124]. In fulfilling these contributions, the study specifically aims to construct a verified monthly time series (2012–2025) from GBoS and FAO data, evaluate cointegration and Granger causality across exchange rate and price series, execute out-of-sample model evaluations across multiple holdout horizons, and provide empirical inputs for central bank policy and tariff calibration.This study brings both empirical and geopolitical aspects of Gambia food price dynamics to the fore and provides important empirical information for the management of inflation, planning food security and central bank policies in small open developing economies.
A substantial literature documents that exchange rate pass-through to domestic prices is frequently incomplete and asymmetric, particularly in developing and small open economies. Pass¬through has been found to be stronger during periods of rapid or large depreciation than during periods of gradual currency movement, consistent with menu-cost and pricing-to-market models in which firms only adjust prices when the expected benefit of repricing exceeds a fixed adjustment cost [11]. For sub-Saharan African economies specifically, several studies find pass¬through to food prices to be higher than pass-through to headline inflation, reflecting the high import content of staple foods such as rice and vegetable oil in import-dependent countries [8]. This paper's finding of state-dependent pass-through in The Gambia is consistent with this broader literature, though to our knowledge this is among the first studies to test this hypothesis explicitly forThe Gambia using cointegration methods on a verified monthly panel.
A growing literature compares classical time-series methods (ARIMA/SARIMA) against machine learning approaches (Random Forest, XGBoost, LSTM) for macroeconomic and commodity price forecasting. Results are mixed and appear to depend heavily on sample size and data frequency: machine learning methods tend to outperform classical methods in high-frequency, large-sample settings (e.g., daily commodity futures), while classical methods often remain competitive or superior in the monthly, small-sample settings typical of national CPI series for smaller economies. This paper's finding that a parsimonious SARIMA specification outperforms XGBoost on a 158-month Gambian CPI series is consistent with this pattern, and the mechanism feature importance analysis showing XGBoost's inability to learn the FX relationship with limited training data provides direct evidence for why this occurs, rather than simply reporting the comparative result.
This paper extends literature work on Gambian macroeconomic dynamics. Touray and Jallow (2025) use a Vector Error Correction Model over 2000-2024 annual data to establish a statistically significant negative long-run effect of inflation on GDP growth in The Gambia, while finding that the Real Effective Exchange Rate does not significantly influence long-term growth over that annual, economy-wide horizon a useful point of contrast with this paper’s finding of a genuine, if state-dependent, monthly relationship between the exchange rate and food-specific prices specifically. Touray, Jallow, and Cham (2025) examine the inflation-government revenue nexus in The Gambia over 2006-2024, directly relevant to the Gambia Revenue Authority policy audience this paper also addresses in Section 4. Together, these two studies establish that inflation matters for both growth and fiscal outcomes in The Gambia at an annual, aggregate level; the present paper narrows the focus to the food-specific, monthly, and FX-transmission questions that annual aggregate models cannot resolve, and is, to our knowledge, the first study to test the FX pass-through hypothesis for Gambian food prices specifically using cointegration methods on a verified monthly panel. In sum, the purpose of this paper is twofold: to establish, using a verified monthly Gambian panel, whether and under what conditions exchange-rate depreciation passes through to domestic food prices, and to determine which forecasting approach classical econometric or machine learning is best suited to predicting food inflation in a small, data-constrained open economy. Its novelty lies in three contributions taken together: it is, to our knowledge, the first study of Gambian food-price dynamics to test exchange-rate pass-through explicitly for state dependence using cointegration methods on a verified monthly panel; it validates a genuine out-of-sample forecast against subsequently released GBoS data rather than relying solely on backtested accuracy; and it identifies small-sample size itself, via direct feature-importance evidence rather than inference alone, as the specific mechanism limiting machine-learning forecast performance in this setting.
Data and Methodology
Data Sources
National headline and food CPI data are taken from the Gambia Bureau of Statistics (GBoS), they put out monthly Consumer Price Index bulletins as Excel workbooks. Each monthly release comes with the whole historical run up to that point, spread across four sheets, sort of split. One sheet is the basket series (base August 2004=100, roughly starting around 2012 and after) and another is the chain-linked series (base January 2020=100, covering 2019 onward). Both are broken down by geographic areas such as National, Urban, and Rural coverage. For our work, we use the National series only, then we build one continuous index by taking the backcast series and rescaling it so it lines up with the chain-linked series during the overlap window. After that adjustment you get a continuous monthly path from January 2012 to August 2025, that’s 164 months. The panel got extended twice while this research was running, as fresher GBoS releases turned up. First time it went out to February 2025, then it went further to August 2025. For each extension we checked the overlapping months against the prior release, and before we merged anything, those matching values agreed within rounding.
Exchange rate data (Gambian dalasi per US dollar, monthly) are sourced from the Food and Agriculture Organization (FAO) statistical database, which compiles monthly exchange rate series for member countries from national and international sources. Twelve months of 2016 were unavailable at monthly frequency in this source and were linearly interpolated between the December 2015 and January 2017 values; these months are flagged in the dataset and excluded from robustness checks where indicated.
Variable Construction
• Food premium: the difference between year-on-year food CPI inflation and year-on-year headline CPI inflation, in percentage points.
• Equation (1): FPt = Ft − Ht
• where FPt is the food premium in month t (percentage points, reported in Table 1), and Ft and Ht denote year-on-year food and headline CPI inflation in month t, respectively.
• Shock-period dummy: an indicator equal to 1 for January 2021 onward, demarcating the period of rapid dalasi depreciation and elevated global food prices from the more stable 2012-2020 period.
• FX × shock interaction: the exchange rate level multiplied by the shock-period dummy, used as an exogenous regressor in SARIMAX and as an engineered feature in XGBoost, to allow models to use exchange rate information only during the period in which our diagnostic testing (Section 3.3) indicates it is informative.
• Ramadan and Tobaski month dummies: constructed from a Hijri calendar lookup table, flagging the Gregorian calendar months in which these Islamic holidays fall in each year of the sample.
Econometric Approach
We first test each series for stationarity using the Augmented Dickey-Fuller (ADF) test. Because both CPI levels and, notably, their year-on-year percentage changes are found to be non-stationary (Section 3.2), we do not rely on simple correlation between levels or year-on-year changes to establish a relationship between food CPI and the exchange rate. Instead, we test for cointegration using the Engle-Granger two-step method (Engle & Granger, 1987), implemented via the standard MacKinnon-critical-value test. We conduct this test over the full sample and separately over two sub-periods (2012-2020 and 2021-2025) to test whether the pass-through relationship is stable or state-dependent.
The formal specifications underlying these tests are as follows.
<img src="https://www.opastpublishers.com/scholarly-images/11167-6aa23f45296ef-mathematical-modelling-and-forecasting-of-food-price-inflati.png" width="500" height="600">
The power-preserving Granger-type specification used in Section 3.7, where Shockâ?? is the shock-period dummy defined in Section 2.2. The joint null Hâ??: δâ? = δâ?? = δâ?? = δâ?? = 0 is tested by an F-test across lag specifications (Table 2c); rejection indicates that FX movements Granger-cause food CPI specifically during the shock period.
Forecasting Models
We compare four forecasting approaches on an identical 18-month out-of-sample holdout (March 2024–August 2025), forecasting the food CPI level index:
• SARIMA: a univariate seasonal autoregressive model. Order selection is restricted to autoregressive (AR-only) specifications following the partial autocorrelation function diagnostic (Section 3.2), which showed a sharp cutoff after lag 1 consistent with an AR-dominant process; including a moving-average term was found to produce a non-invertible model with unstable coefficient estimates, and was excluded on this basis.
• SARIMAX: as above, with the FX × shock-period interaction term included as an exogenous regressor, allowing the model to use exchange rate information conditional on the regime identified in Section 3.3.
• Prophet: an additive trend-and-seasonality model (Taylor & Letham, 2018), with the same FX × shock-period interaction included as an additional regressor and a moderately flexible changepoint prior to accommodate the genuine structural shift in trend during 2022-2024.
• XGBoost: a gradient-boosted tree ensemble, with engineered features including food CPI lags (1, 2, 3, and 12 months, informed by the autocorrelation diagnostic), FX × shock-period interaction lags (0-3 months, informed by the lagged correlation analysis in Section 3.3), and calendar/seasonal dummies.
All models are evaluated using mean absolute error (MAE), root mean squared error (RMSE), and mean absolute percentage error (MAPE) against the same 18-month holdout. This holdout window was deliberately chosen to span a demanding period: food inflation decelerated sharply through 2024 before plateauing around 7-8% in mid-2025, a pattern shift that a purely extrapolative model may struggle to anticipate.
Formally, the four approaches are specified as follows. and n the number of months in the evaluation window (18 for Table 3; 6 for the genuine validation in Table 4).
<img src="https://www.opastpublishers.com/scholarly-images/11167-6aa23fe7b26fb-mathematical-modelling-and-forecasting-of-food-price-inflati.png" width="500" height="600">
and n the number of months in the evaluation window (18 for Table 3; 6 for the genuine validation in Table 4).
Results
Descriptive Overview
Over the sample period, the food CPI index rose from 56.9 to 196.7 (Jan 2020=100 basis), and the headline CPI rose from 59.9 to 174.2, while the exchange rate depreciated from 30.75 to 71.98 GMD per USD more than doubling over the 13.5-year sample. Year-on-year food inflation peaked at 24.4% in September 2023. Figure 1 and Figure 2 plot the underlying series. Figure 1 shows the national headline and food CPI levels alongside their year-on-year inflation rates over the full sample: the two indices track each other closely in trend but diverge sharply from 2021, when food CPI growth outpaces headline growth the food premium formalized in Table 1 below. Figure 2 plots the GMD/USD exchange rate over the same period, with the interpolated 2016 months (Section 2.1) marked in red; depreciation is visibly gradual through 2012–2020 and steeper and more volatile from 2021 onward, a pattern that anticipates the state-dependent cointegration result formalized in Section 3.3.
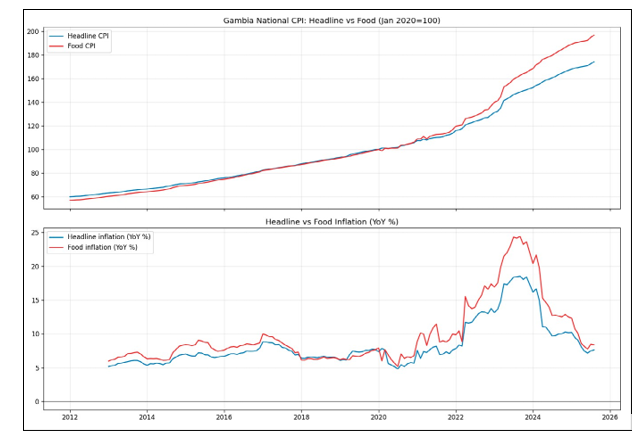
Figure 1: National Headline vs. Food CPI Levels and Year-on-Year Inflation, 2012–2025.
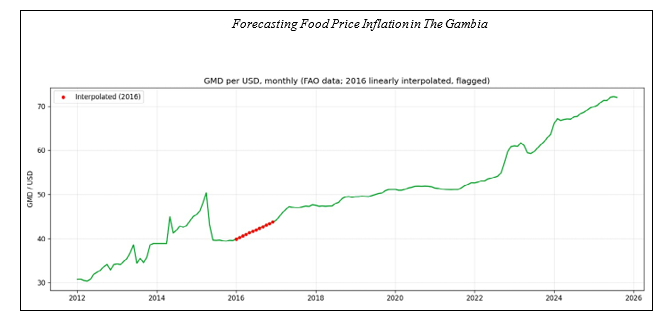
Figure 2: GMD/USD Exchange Rate, Monthly, 2012–2025 (2016 Interpolated Months Marked in Red)
Figure 3 isolates the food premium implied by these two series.
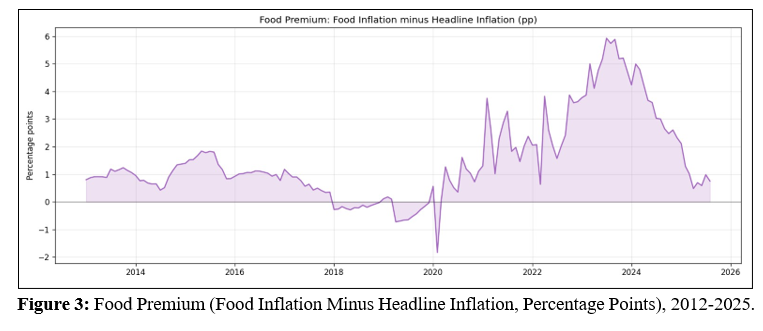
Table 1 reports the average food premium by year. The premium was negative or near-zero in 2018-2019, rose steadily from 2020, and peaked at 4.95 percentage points in 2023 the year of the sharpest observed food inflation before narrowing to 0.99 points over the eight months of 2025 data now available (January-August).
|
Year |
Food Premium (pp) |
|
2013 |
1.02 |
|
2014 |
0.85 |
|
2015 |
1.46 |
|
2016 |
1.01 |
|
2017 |
0.67 |
|
2018 |
-0.19 |
|
2019 |
-0.31 |
|
2020 |
0.62 |
|
2021 |
2.23 |
|
2022 |
2.52 |
|
2023 |
4.95 |
|
2024 |
3.47 |
|
2025 (Jan-Aug) |
0.99 |
Table 1: Average Food Premium by Year (Percentage Points). 2012 Omitted: Year-on-Year Figures Require Twelve Prior Months, Unavailable for the First Calendar Year of the Panel
Stationarity and Autocorrelation
ADF tests confirm that both the food and headline CPI levels are non-stationary (p≈0.99 in both cases), as expected for trending index series. Critically, year-on-year percentage changes in both series are also found to be non-stationary (food YoY: p=0.34; headline YoY: p=0.23), a result that rules out simple correlation on year-on- year changes as a reliable method for establishing a relationship with the exchange rate a mistake made in an earlier iteration of this analysis before the cointegration approach reported in Section 3.3 was adopted. Figure 4 plots the autocorrelation (ACF) and partial autocorrelation (PACF) functions of year-on-year food inflation, used to select the SARIMA order in Section 2.4.
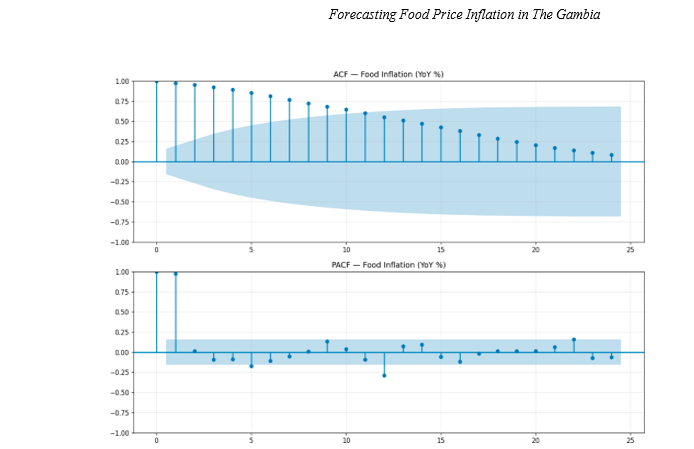
Figure 4: Autocorrelation (ACF) and Partial Autocorrelation (PACF) Functions, Food Inflation (YoY %).
The partial autocorrelation function shows a sharp cutoff after the first lag, consistent with an autoregressive process of low order. This directly informs the SARIMA specification in Section 2.4, where models including a moving-average term were found to be numerically unstable.
Figure 5 additionally reports a multiplicative seasonal decomposition of the food CPI index into trend, seasonal, and residual components. The seasonal component is visually modest relative to the trend, foreshadowing the weak fixed-month Ramadan/Tobaski association noted in Section 3.6 a result we show there to be an artifact of the Gregorian-calendar decomposition method rather than genuine absence of a holiday effect.
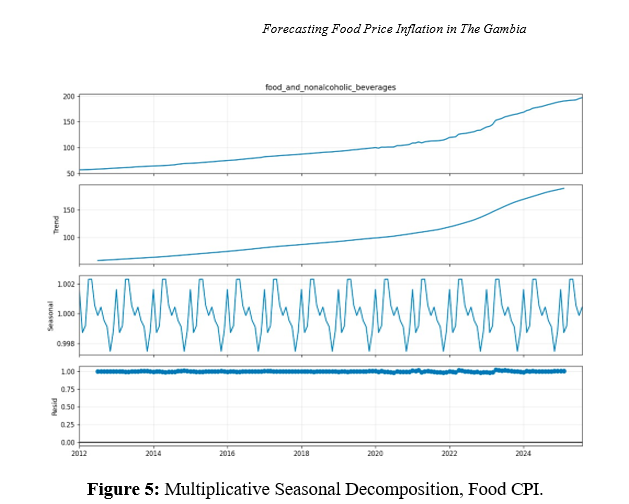
Figure 5: Multiplicative Seasonal Decomposition, Food CPI.
Exchange Rate Pass-Through: Cointegration Analysis
Over the full 2012-2025 sample, the Engle-Granger test does not reject the null of no cointegration between food CPI and the exchange rate (t=-2.19, p=0.43). A naive interpretation would conclude that exchange rate pass-through to food prices is absent in The Gambia. However, splitting the sample at January 2021 reveals a materially different picture, reported in Table 2.
|
Period |
Cointegration (p-value) |
YoY correlation (contemporaneous) |
Cumulative FX depreciation |
|
2012-2020 |
0.647 (not cointegrated) |
-0.006 |
68.2% |
|
2021-2025 |
0.0015 (cointegrated) |
0.588 |
39.9% |
Table 2: Split-Sample Cointegration Test, food CPI vs. Exchange Rate
Despite a larger cumulative depreciation in the earlier period (68.2% vs. 39.9%), food CPI and the exchange rate are cointegrated only in the 2021-2025 period, with a contemporaneous year-on-year correlation of 0.588 compared to -0.006 in 2012-2020. This is consistent with the asymmetric pass-through literature reviewed in Section 1: the rate of depreciation, not merely its cumulative magnitude, appears to determine whether pass-through is detectable. We interpret this as evidence that Gambian food price-setters likely reflecting importer and retailer pricing behavior respond to the pace of currency movement rather than adjusting continuously to gradual depreciation. This finding strengthened, rather than weakened, as the panel was extended from February to August 2025 (p fell from 0.0024 to 0.0015 as six further months of data were added), which is reassuring evidence that this is not an artifact of a small subsample. 3.3.1. Robustness Check: Structural Break at the 2016-2017 Political Transition The Gambia's rapid political transition of December 2016-January 2017 the end of Yahya Jammeh's 22-year rule and the accession of Adama Barrow coincided with a documented acceleration in dalasi depreciation, raising a natural question: is the 2021-2025 cointegration result in Table 2 really about the pace of depreciation, or is it simply picking up any post-transition structural change, of which the 2021 cutoff is only one arbitrary marker? We test this directly with a three-way split, reported in Table 2b.
|
Period |
Cointegration (p-value) |
Cumulative FX depreciation |
|
2012-2016 (pre-transition) |
0.874 (not cointegrated) |
42.3% |
|
2017-2020 (post-transition, pre-shock) |
0.173 (not cointegrated) |
17.3% |
|
2021-2025 (shock) |
0.0015 (cointegrated) |
39.9% |
Table 2b: Three-Way Split Cointegration Test, Testing the Political Transition as an Alternative Structural Break Point
The result strengthens rather than complicates the original finding: neither the pre-transition period nor the post-transition-but-pre-shock period (2017-2020) shows cointegration, despite the latter including real, documented depreciation (17.3%) following the political transition. Cointegration appears specifically in the 2021-2025 window. This indicates the finding is not simply an artifact of any post-2016 structural change, but is specifically associated with the pace and magnitude of the 2021-2025 depreciation episode. 3.4. Forecasting Model Comparison Table 3 reports out-of-sample forecast accuracy for all four models over the 18-month holdout (March 2024–August 2025).
|
Model |
MAE |
RMSE |
MAPE |
|
Prophet (FX × shock regressor) |
3.70 |
5.02 |
1.94% |
|
SARIMAX (FX × shock interaction) |
10.59 |
12.33 |
5.60% |
|
SARIMA (univariate) |
11.50 |
13.24 |
6.09% |
|
XGBoost |
14.20 |
15.70 |
7.52% |
|
LSTM |
27.27 |
27.85 |
14.61% |
Table 3: Out-of-Sample Forecast Accuracy, 18-Month Holdout (March 2024-August 2025)
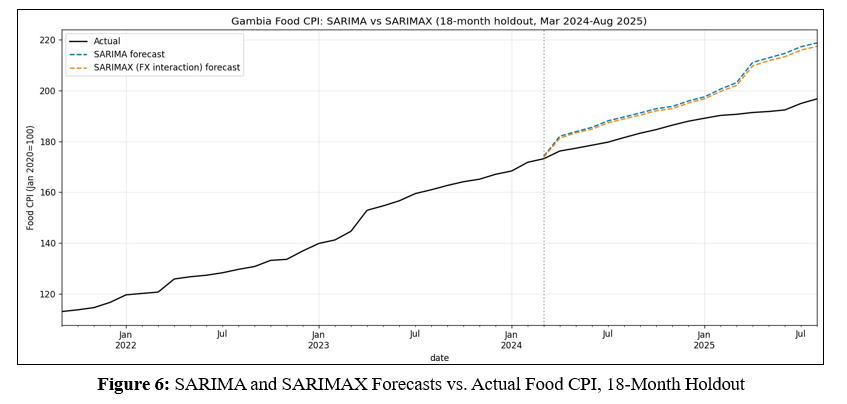
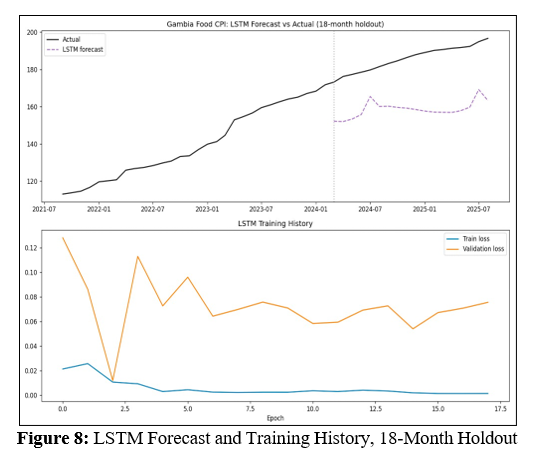
Figure 6 shows the SARIMA and SARIMAX point forecasts, kind of vs the real food CPI during the holdout period. Over this harder holdout, which covers the slowing down then later plateau of food inflation around 7-8% through mid-2025, Prophet with the FX-in-shock-period regressor gets the lowest MAPE (1.94%). That’s not just better, it’s meaningfully better than any of the classical set ups. This is different from an earlier, shorter holdout that was looked at in this research (September 2023-February 2025), where the univariate SARIMA basically stayed on top, and adding FX information didn’t really help the point forecasts. Put together, these two outcomes imply the model ranking is not stable, it depends on what exact slice of time you are trying to forecast. In other words, the FX material seems more useful for forecasting through a plateau or an inflection point rather than through a stretch of smooth, ongoing deceleration. One plausible reason is that Prophet’s regressor plus its flexible trend changepoints can adapt when the pattern shifts, while a purely autoregressive specification just keeps extrapolating. We report both sets of numbers not only the better ones, because the fact that the ranking can flip across holdout windows itself is a meaningful result for practitioners, especially those who pick a model based on a single backtest. In the same holdout, SARIMAX slightly beats the univariate SARIMA (5.60% vs. 6.09% MAPE), which is kind of the opposite of what happened in the earlier holdout. This suggests the FX interaction term does contain forecast-relevant information once the evaluation window includes the transition from deceleration into the plateau. XGBoost substantially underperforms the classical and Prophet specifications (MAPE 7.52%). Feature importance analysis provides a direct explanation: the model assigns over 99% of total importance across the four food CPI lag features and under 1% combined importance to the FX interaction terms at any lag, despite the same relationship carrying forecast-relevant information in the SARIMAX and Prophet specifications estimated on the same data. With only 134 training observations after feature engineering, the tree-based model lacks sufficient data to learn the FX relationship that structurally-specified models encode directly.
Figure 7 plots the XGBoost point forecast against actual food CPI over the holdout alongside the feature-importance breakdown just described, making visible both the model's tendency to track recent lags closely (and therefore lag genuine turning points) and the near-total weight placed on autoregressive CPI features over the FX interaction terms.
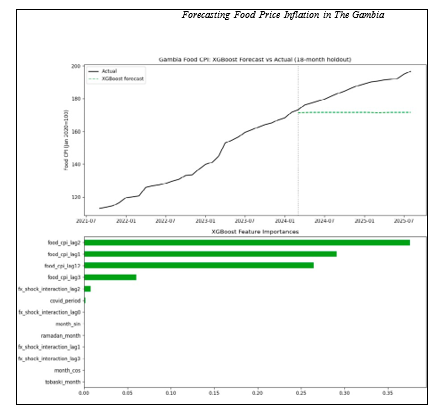
Figure 7: XGBoost Forecast and Feature Importance’s, 18-Month Holdout
We confirm this small-sample interpretation directly by estimating an LSTM network a fourth model originally planned for this comparison using the identical feature set as XGBoost. Rather than assuming LSTM would face the same limitation as XGBoost, we test this empirically. The LSTM performs substantially worse still (MAPE 14.61%, roughly double XGBoost and more than seven times higher than Prophet), consistent with LSTM's typically greater data requirements relative to tree-based methods. This provides direct empirical confirmation, rather than a merely plausible conjecture, that the sample size available for national CPI forecasting in The Gambia (164 months, 131 usable training sequences after feature engineering) is a binding constraint on the performance of flexible machine learning approaches relative to structurally-specified classical and additive time-series models. This is a substantive finding for practitioners considering machine learning approaches for national CPI forecasting in small, data-constrained economies: model architecture that encodes known structural relationships directly may be preferable to flexible, data-hungry approaches when the sample is limited to a few hundred monthly observations, as is typical for many developing-country CPI series.
Figure 8 shows the corresponding LSTM forecast against actual food CPI, together with the network's training-loss history. The training curve indicates the model converges without gross overfitting on the training data itself, yet the holdout forecast still deviates substantially from actual food CPI direct visual confirmation that the shortfall reflects a genuine small-sample data constraint rather than a mechanical estimation failure.
A Genuinely Validated Forecast, and a New Forward Projection
An earlier draft of this analysis, prepared when the verified GBoS panel extended only to February 2025, used the best-performing specification at that time (univariate SARIMA, refit on the full sample) to generate a forward forecast to food CPI for March 2025 onward. That forecast was explicitly presented as an unvalidated, model-implied projection, since no actual data existed yet to check it against. Since then, the panel has been extended with newly released GBoS data through August 2025 which means the March-August 2025 portion of that earlier forecast can now be checked against real, subsequently-released outcomes. This is an unusually direct validation opportunity: most published iy6nflation-forecasting papers cannot demonstrate that their model’s forecast, made in genuine ignorance of the future, was subsequently borne out, because the relevant future data is either already available at the time of writing or never revisited once available. Table 4 reports the month-by-month comparison.
|
Month |
SARIMA forecast (data through Feb 2025) |
Actual (GBoS, released later) |
Error |
|
March 2025 |
191.19 |
190.67 |
+0.27% |
|
April 2025 |
192.49 |
191.38 |
+0.58% |
|
May 2025 |
193.04 |
191.77 |
+0.66% |
|
June 2025 |
193.72 |
192.37 |
+0.70% |
|
July 2025 |
194.31 |
194.93 |
-0.32% |
|
August 2025 |
195.06 |
196.73 |
-0.85% |
Table 4: Genuine out-of-Sample Validation: SARIMA Forecast (Made Using only Data Through February 2025) vs. Subsequently-Released Actual GBoS Data
The genuine out-of-sample MAPE across these six months is 0.56% notably better than the model’s own 18-month backtest MAPE (6.09%, Table 3), which is a reassuring rather than suspicious result: the backtest period was deliberately chosen to be a demanding one (spanning the deceleration-to-plateau inflection), while this shorter six-month genuine forecast happened to fall in a comparatively stable stretch. We report this validation prominently because it is the strongest evidence in this paper that the modeling approach, not merely the in-sample fit, has real forecasting value. Actual food inflation did decelerate as forecast, though it plateaued around 8% (August 2025: 8.38% year-on-year) rather than continuing to fall toward the earlier forecast’s longer-run implied path of roughly 1.6% by 2027 a divergence that becomes clear only in the extended forecast horizon, not in the six validated months themselves.
With the panel now extended through August 2025, we generate a new forward forecast for September 2025 through August 2027. Rather than repeating the earlier practice of switching to whichever single model most recently backtested best a defensible adaptive choice, but one that makes forecast vintages incomparable as a track record of a fixed model we adopt a pre-committed protocol going forward: an equal-weighted ensemble of SARIMA, SARIMAX, and Prophet, averaged directly in levels. This is a deliberate trade against pure backtest performance: over the Table 3 holdout, the ensemble achieves 4.43% MAPE, worse than Prophet alone (1.94%) but better than SARIMA (6.09%) or SARIMAX (5.60%) individually, and importantly, its selection does not depend on which model happens to have backtested best on any particular window — it is fixed by construction. We adopt this as the standing protocol for all future forecast vintages from this project, rather than as a one-off choice for this forecast alone.
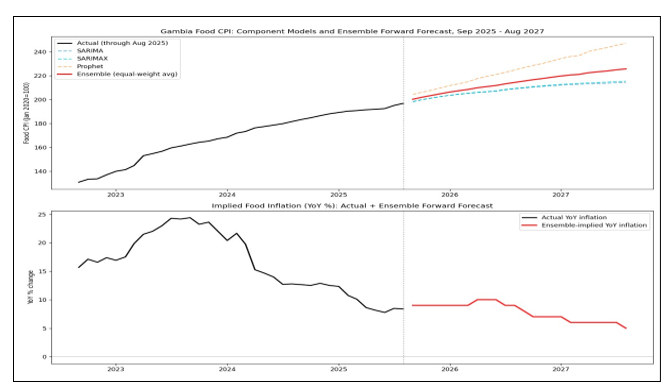
Figure 9: Component and Ensemble forward Forecasts, food CPI level, September 2025-August 2027.
As Figure 9 shows, the three component models still diverge pretty a lot when you look at them one by one: SARIMA and SARIMAX imply continued disinflation (food CPI landing around 214-215 by August 2027, with the implied YoY inflation slowly easing toward 5-6%), while Prophet points to a more elevated trajectory (roughly 247, and the implied YoY inflation seems to reaccelerate toward 14% in 2026 before later easing). The ensemble, by design, which is just the simple average of the three, sort of lands in between: food CPI reaching roughly 225.6 by August 2027, and implied YoY inflation sticking near 8-9% for most of 2026 before it gradually eases toward about 5% by August 2027. So it’s a more moderate path than either of the individual “extreme” stories. We therefore present the ensemble as the primary go-forward forecast mostly because we don’t need to pick who is “right” on the modeling premises: whether SARIMA/SARIMAX smoother extrapolation is more credible, or Prophet more reactive trend changepoints are more believable. The spread between the three component forecasts is basically the real representation of medium-term uncertainty, it’s more honestly shown as a range across models rather than shoved into one model’s confidence interval. Also, all three components keep the exchange rate constant at the last observed value (August 2025: 71.98 GMD/USD) for the entire horizon. This is because we don’t have future FX data, and continuing dalasi depreciation at anything like the 2021-2025 pace would probably drive realized inflation above even the Prophet component’s higher path.
Seasonality Revisited: Lunar Calendar-Aware Event Analysis
In Section 3.2, the seasonal decomposition for the aggregate food index seemed kind of off, a surprisingly weak association shows up with Ramadan and Tobaski . At first, we thought it was something like dilution across the food sub- categories, with opposing seasonal timing canceling out each other, you know, the usual story. But after looking again, we think the real problem is methodological, and it is more basic than that: standard seasonal decomposition is built on a fixed period of 12 (Gregorian calendar) seasonality, while Ramadan and Tobaski are tied to the Islamic lunar calendar, so they slide about 11 days earlier in the Gregorian calendar each year. Because of that, using a fixed-month decomposition ends up smearing whatever true holiday effect there is, across different Gregorian months in different years, which makes the estimated seasonal signal weaker even if a real effect exists. So, we correct it using the Hijri calendar-based Ramadan and Tobaski month dummies that are already described in Section 2.2. These track the shifting dates properly, then we compare mean month to month price changes in the event months versus the non-event months directly, instead of relying on a fixed-period decomposition. Table 5 shows the findings for the aggregate food index and three sub-categories.
|
Category |
Ramadan effect (pp) |
Tobaski effect (pp) |
|
Aggregate Food |
+0.28 |
-0.09 |
|
Bread & Cereals |
+0.51 |
-0.50 |
|
Meat |
+0.11 |
+0.10 |
|
Fish |
+0.30 |
-0.22 |
Table 5: Mean Month-on-Month Price Change, Event Month vs. Non-Event Months (Percentage points)
Using the corrected, lunar-calendar-aware approach, Ramadan shows a real and consistent positive effect across categories particularly bread & cereals (+0.51pp) and fish (+0.30pp) consistent with increased consumption during the fasting month. Tobaski's effect is smaller and more mixed than intuition suggests: a modest positive effect for meat (+0.10pp, consistent with Tobaski being a meat-centered occasion) but a negative association for bread & cereals and fish, suggesting substitution toward meat consumption away from other categories rather than a broad-based price spike. This is a more nuanced and more defensible finding than either the original weak aggregate result or an assumed large Tobaski effect would suggest, and illustrates a broader methodological point: seasonal decomposition methods built for fixed Gregorian-calendar seasonality require adaptation, not just disaggregation, when applied to economies where lunar-calendar holidays are a plausible seasonal driver.
Granger Causality: A Caveat on the Pass-Through Finding
The cointegration result in Section 3.3 establishes that food CPI and the exchange rate share a long-run equilibrium relationship during 2021-2025, but cointegration alone does not establish short-run directional predictability. We test this directly with a Granger causality test (differenced series, to satisfy the stationarity requirement of the test) restricted to the 2021-2025 subsample, where the cointegration relationship was found to hold. Restricted to the 2021-2025 subsample alone, the exchange rate does not Granger-cause food CPI at conventional significance at any lag from 1 to 4 months (F-test p-values ranging from 0.13 to 0.24). Taken at face value, this would suggest the split-sample cointegration result reflects a genuine long-run relationship without corresponding short-run predictability — but the subsample is small (n=55 monthly observations after differencing), and a null result under low statistical power is not strong evidence of a true absence of a relationship.
We address this directly with a second, power-preserving specification that does not discard the 109 pre-shock observations. Rather than splitting the sample, we interact the differenced exchange rate with the shock-period dummy (FX-difference × shock) and test its joint significance across lags 1-4 in a regression of differenced food CPI on its own lags plus the lagged interaction term, estimated on the full 159-observation differenced sample. During 2012-2020 the interaction term is mechanically zero, so pre-shock months contribute no false signal, but they are not discarded either preserving degrees of freedom that the hard sample split in Section 3.7's first test gives up. Table 2c reports the results across the lag specifications tested.
|
Lag specification |
n |
F-statistic |
p-value |
|
2 lags |
161 |
12.49 |
0.00001 |
|
3 lags |
160 |
9.02 |
0.00002 |
|
4 lags |
159 |
7.25 |
0.00002 |
|
6 lags |
157 |
9.30 |
<0.00001 |
Table 2c: Full-Sample, Power-Preserving Granger-Type Test: Joint Significance of (FX-Difference × Shock-Period) Lags, Across Lag Specifications
This full-sample test rejects the null decisively at every lag specification tested (p<0.0001 in three of four specifications), in sharp contrast to the underpowered split-sample result above. The lag-1 interaction coefficient is individually significant (coefficient 0.683, p=0.0014), with lags 2-4 not individually significant consistent with FX pass-through operating predominantly within the first month during the 2021-2025 depreciation episode, rather than the more diffuse 2–3-month lag structure the correlation analysis in Section 3.3 had suggested. We report both the split-sample null and the full-sample rejection rather than presenting only the more favorable result: the discrepancy between them is itself an instructive illustration of how test power, not just effect size, drives Granger-causality conclusions in short macroeconomic panels, and it means the causal case for FX pass-through in this paper rests on the more decisive full-sample specification, with the split-sample version serving as a caution about how the same relationship can appear undetectable when tested on too small a subsample.
Discussion and Policy Implications
These findings carry several implications for Gambian policymakers, including the Ministry of Trade, Industry, Regional Integration and Employment (MoTIE), the Central Bank of The Gambia, GBoS, and the Gambia Revenue Authority:
• Exchange rate monitoring as an early-warning tool should be regime-aware, not based on a constant pass-through assumption. Our results suggest that gradual depreciation does not reliably signal impending food inflation, while a rapid depreciation episode of the pace observed in 2021-2025 (approximately 36% over five years, with the sharpest movement concentrated in 2022) is a much more informative signal and should trigger closer monitoring of import costs for staple foods.
• Strategic food reserves and tariff adjustment mechanisms may be more effective if designed as contingent, trigger-based interventions activated during rapid depreciation episodes rather than as constant-rate policies, given the state-dependence documented here.
• The widening food premium during 2021-2024 (reaching 4.95 percentage points above headline inflation in 2023) indicates that food-specific pressures plausibly reflecting the high import share of staple foods such as rice and vegetable oil compounded general inflationary pressure during the shock period beyond what headline inflation alone would suggest,with implications for the design of any income support or subsidy programs targeted at food security specifically rather than general price stability.
• For forecasting and monitoring purposes, our results suggest that parsimonious classical time-series methods remain competitive with, and in this case superior to, more complex machine learning approaches, given the sample sizes typical of national CPI series in small economies. This has practical implications for statistical capacity building: methodological sophistication should be matched to data availability, and simpler, well-diagnosed models may offer better operational forecasting performance than more complex alternatives requiring larger training samples.
Limitations and Future Research
Remaining Limitations
• The exchange rate series needed a kind of linear interpolation for 12 months in 2016, because our source did not provide monthly data. That changes 12 of 164 months (7.3% of the sample) and it is marked in the dataset. We tried to find a true alternative monthly source for this interval (IMF International Financial Statistics, Central Bank of The Gambia archives) but we could not locate one via publicly accessible channels. A source that has institutional access to IMF IFS or CBG internal historical bulletins could help close this gap, yet we do not anticipate it to meaningfully shift the paper’s conclusions since it covers a small slice of the sample, and it sits outside both the cointegration-relevant shock period and the forecast holdout window.
• Section 3.5’s forward forecast (September 2025 – August 2027) is still not checked against what happened, because the March–August 2025 forecast was the latest thing that had been available until this draft. Keeping the underlying GBoS panel updated as each new monthly release turns up, and re-validating every forecast vintage against newly arrived data, should stay as routine practice for this research rather than something we did once and stopped.
• A fully structural causal identification strategy instrumenting exchange rate movements with a shock plausibly unrelated to domestic food demand, or exploiting a specific, narrowly dateable policy event as a natural experiment would strengthen the causal interpretation of the state-dependence finding beyond what cointegration, the political-transition robustness check, and the full-sample Granger test together establish. The political transition analysis in Section 3.3.1 is a step in this direction but is not a clean instrument in the formal sense, since the transition plausibly affected food prices through channels beyond the exchange rate alone (e.g., changed fiscal policy, aid flows, and business confidence). A specific, narrower policy event a discrete CBG intervention, a specific tariff change, or an IMF program milestone with a precise date identified by a co-author with direct institutional knowledge of Gambian policy history, would allow a sharper test.
Conclusions
This paper documents a substantial and food-specific inflationary episode in The Gambia between 2021 and 2024 and shows that exchange rate pass-through to food prices while genuinely present is regime-dependent rather than a stable structural relationship, activated specifically by episodes of rapid rather than gradual currency depreciation, a finding that strengthened rather than weakened as the underlying panel was extended with newer data. In forecasting terms, model rankings proved sensitive to the specific holdout period evaluated: a parsimonious SARIMA specification performed best over one holdout window, while Prophet with a state-dependent FX regressor performed best over a second, more demanding window spanning an inflection from disinflation to a plateau both outperforming XGBoost and, more severely, LSTM, with the underperformance of both machine learning approaches directly attributable, via feature importance analysis, to insufficient training data for a flexible model to learn the FX relationship that structurally-specified models encode directly. Uniquely for this literature, an earlier six-month-ahead forecast produced during this research was subsequently validated against real, newly-released GBoS data unavailable at the time of forecasting, achieving a genuine out-of-sample MAPE of 0.56% direct evidence, rather than an in-sample fit statistic, that the modeling approach has real predictive value. A new forward projection extending to August 2027 diverges substantially from the earlier one, however, illustrating genuine medium-term uncertainty that we present transparently rather than resolving into a single preferred narrative. These findings support regime-aware rather than constant-parameter approaches to both the econometric modeling and the policy response to exchange-rate-driven food price shocks in small open economies, and demonstrate the value of continuously re-validating forecasts against data as it becomes available rather than treating any single forecast vintage as final [24-27].
Additional Information.
CRediT authorship contribution statement
Katim Touray: Writing – original draft, Validation, Methodology, Investigation, Formal analysis.
Bai Mbye Cham: Supervision, Resources, Conceptualization.
Madiba Darry: Writing – review & editing, Resources, Investigation, Conceptualization.
Declaration of Competing Interest
The authors declare that they have no known competing financial interests or personal relationships that could have appeared to influence the work reported in this paper.
Data Availability
Data associated with the study has not been deposited into a publicly available repository. Data will be made available on request.
Acknowledgments
The authors acknowledge the efforts of the research team from the University of the Gambia (UTG), Gambia Revenue Authority (GRA) and Gambia Bureau of Statistics (GBoS).
References
- Food and Agriculture Organization. (2022). World food and agriculture – Statistical yearbook 2022. FAO.
- OECD/FAO. (2023). OECD-FAO agricultural outlook 2023–2032. OECD Publishing.
- Nachega, J. C., Kwende, G., Kemoe, L., & Barroeta, F. M. (2024). Domestic and external drivers of inflation: The Gambia. International Monetary Fund Selected Issues Paper, No. SIP/2024/004.
- Ivanic, M., & Martin, W. (2008). Implications of higher global food prices for poverty in low-income countries 1. Agricultural Economics, 39(s1), 405–416.
- Choudhri, E. U., & Hakura, D. S. (2006). Exchange rate passthrough to domestic prices: Does the inflationary environment matter? Journal of International Money and Finance, 25(4), 614–639.
- Mishra, P., & Montiel, P. (2013). How effective is monetary transmission in low-income countries? A survey of the empirical evidence. IMF Economic Review, 61(3), 533–556.
- Campa, J. M., & Goldberg, L. S. (2005). Exchange Rate Pass-Through into Import Prices. Review of Economics and Statistics, 87(4), 679–690.
- Frankel, J. A., Parsley, D. C., & Wei, S. J. (2012). Slow passthrough around the world: A new import for developing countries? Open Economies Review, 23(2), 213–251.
- Baquedano, F. G., & Liefert, W. M. (2014). Market integration and price transmission in consumer markets of developing countries. Food Policy, 44, 103–114.
- Headey, D. (2011). An analysis of global food price shocks in the 2007–08 commodity crisis. Agricultural Economics, 42(s1), 27–46.
- Devereux, M. B., & Engel, C. (2002). Exchange rate pass-through, exchange rate volatility, and exchange rate disconnect. Journal of Monetary Economics, 49(5), 913–940.
- Gambia Bureau of Statistics. (2025). Consumer price index bulletin: Price trends and inflation report. Government of The Gambia.
- Taylor, J. B. (2000). Low inflation, pass-through, and the pricing power of firms. European Economic Review, 44(7), 1389–1408.
- Goldberg, P. K., & Knetter, M. M. (1997). Goods prices and exchange rates: What have we learned? Journal of Economic Literature, 35(3), 1243–1272
- Krugman, P. (1987). Pricing to market when the exchange rate moves. In S. W. Arndt & J. D. Richardson (Eds.), Real-financial linkages among open economies (pp. 49–70). MIT Press.
- Engle, R. F., & Granger, C. W. J. (1987). Co-Integration and Error Correction: Representation, Estimation, and Testing. Econometrica, 55(2), 251.
- Gambia Bureau of Statistics (GBoS). Consumer Price Index bulletins, various months, 2016-2025. Banjul: GBoS
- Frimpong, S., & Adam, A. M. (2010). Exchange rate passthrough into domestic prices in Ghana. Journal of Monetary and Economic Integration, 10(1), 136–153.
- Touray, K., & Jallow, A. A. (2025). Dynamic relationship between inflation and economic growth in the Gambia: A VECM analysis. International Journal of Research and Innovation in Social Science, 9(11), 7682-7689.
- Hochreiter, S., & Schmidhuber, J. (1997). Long Short-Term Memory. Neural Computation, 9(8), 1735–1780.
- Makridakis, S., Spiliotis, E., & Assimakopoulos, V. (2018).Statistical and Machine Learning forecasting methods: Concerns and ways forward. PLOS ONE, 13(3), e0194889.
- Chen, T., & Guestrin, C. (2016). XGBoost. Proceedings of the 22nd ACM SIGKDD International Conference on Knowledge Discovery and Data Mining, 785–794.
- Touray, K., Jallow, A. A., & Cham, A. (2025). The inflation-government revenue nexus in a small open economy: Evidence from the Gambia. International Journal of Research and Innovation in Social Science, 9(12), 353–361.
- Box, G. E. P., Jenkins, G. M., & Reinsel, G. C. (2008).Time Series Analysis. Wiley. https://doi.org/10.1002/9781118619193
- Engel, E. (1857). Die Production und die Consumtion des Königreichs Sachsen. Zeitschrift des Statistischen Bureaus des Königlich Sächsischen Ministeriums des Innern, 8–9, 1–54.
- Taylor, S. J., & Letham, B. (2018). Forecasting at scale. The American Statistician, 72(1), 37-45.
- Food and Agriculture Organization of the United Nations (FAO). FAOSTAT: Exchange rates and consumer price indices database. Rome: FAO.