
Journal of Veterinary Health Science(JVHS)
ISSN: 2831-3887 | DOI: 10.33140/JVHS
Impact Factor: 0.762

Research Article - (2023) Volume 4, Issue 3
Longevity and Milk Production Improvement in Dairy Cows Using Plant-Derived Products
Received Date: Nov 13, 2023 / Accepted Date: Dec 06, 2023 / Published Date: Dec 15, 2023
Copyright: ©Â©2023 Herrik Bieleman, et al. This is an open-access article distributed under the terms of the Creative Commons Attribution License, which permits unrestricted use, distribution, and reproduction in any medium, provided the original author and source are credited.
Citation: Herrema, F., Bieleman, H., Hoekstra, M., Gomes, J. (2023). Longevity and Milk Production Improvement in Dairy Cows Using Plant-Derived Products. J Vet Heal Sci, 4(3), 128-140.
Abstract
The goal and mandate of dairy farming is the production of milk from healthy animals. In consideration of this objec- tive, the company Animal Health Vision - AHV developed an innovation plan that is based on a twofold strategy: first, to develop innovative solutions and up-to-date protocols for the effective use of animal health products, and second, to advance animal health, welfare, and the ability of dairy cows ability to withstand infectious diseases, ultimately resulting in a decreased reliance on antibiotics. The aim of this work is to assess the impact of AHV products on a cow's lifetime (longevity) and milk production. The research was conducted on a dataset consisting of 162.057 milk production records consisting of 1208 Dutch farms and 213.047 animals. The longevity of the dairy cows was ex- tracted for 64.467 cows selected from 3171 farms. The results show that AHV products QuickTM and ExtraTM improve longevity by an average of 0.7 years when compared to animals that did not receive such products. The average lon- gevity of animals that received at least one of such AHV products is 6.52 years. Furthermore, we could show that for the top 10 largest farms, there is an increased average milk yield of 1.6% per lactation as compared to the animals that did not receive any AHV product.
Keywords
Longevity, Milk Production, Bacterial Disorders, Antibiotics
Abbreviations
CRV = Cooperatie Rundvee Verdeling
XGBOOST = Extreme Gradient Boosting
QE = Quick Extra
ISK = Individuele Standaard Koe
MPR = Milk Recording Registration
Introduction
Milk yield and longevity are two of the most important decision factors for optimal herd management [1]. For example, farmers use lactation models to forecast the farm’s income, determine the required nutrition and energy consumption, optimize the selection and culling decisions, and enhance animal monitoring systems [2-5].
The longevity of a cow, that is the time the animal spends on the farm from birth until culling, is influenced by several factors not only pertaining to their health but also due to herd management. In modern dairy farming, it is rare for cows to be removed from the herd solely due to old age. Instead, farmers consider a range of factors, including the cow’s milk yield, reproductive ability, and overall health [6, 7]. Therefore, the expected longevity and milk production of a cow is the result of many different factors [8, 9].
Plant-Derived Products to Combat Bacterial Disorders
Antibiotic resistance has become an increasing global concern. In turn, the use of antibiotics in farm animals is discouraged and re¬stricted to prudent use guidelines [10, 11].
Given this demand to reduce the use of antibiotics in farm animals, alternative and effective approaches to combat bacterial disorders need to be implemented. AHV products like AspiTM, ExtraTM, or QuickTM, comprising of highly standardized blends of herbal ex¬tracts supplemented with minerals to meet the requirements of a cow at different stages of lactation and stimulating the innate im¬mune response. Moreover, AHV products are designed to prevent bacterial biofilm formation, considering that bacterial and multi-species biofilms are one of the most common sources of chronic infections and an accelerating inflammatory response to otherwise mild infections. Hence these products provide a valuable addition to conventional treatment options for bacterial disorders.
Aim
The purpose of this research is to study the impact of AHV solu-tions on the lifetime of the animals while at the same time assess-ing the factors that explain culling and understanding the effect of AHV solutions on milk production. As a byproduct of this re-search work, we provide insight into key precursors impacting the life length and milk production and how these translate into financial returns for the farmer. We hypothesize that the use of AHV treatment will increase longevity, milk production and return on investment.
Structure
This work is organized as follows. First, the data preparation is presented in section 2. Second, the longevity analysis is outlined in section 3 whilst the milk production is described in section 4. In section 5, the ROI model is discussed and finally, conclusions and suggestions for further research are described in section 6.
Data Preparation
The data preparation phase covers activities required to set up the final dataset. Several pre- processing steps were taken before mod¬el prediction. These steps include data cleaning, standardization, and categorical variable encoding. Each of these steps is explained in more detail in later sections. In sections 2.1 and 2.2, the dataset and feature selection phase are explained.
Datasets
The data consists of farmer's records of milk production and re¬production (so called MPR data) and RVO (Netherlands Enter¬prise Agency) recording all living animals and animal movements in The Netherlands. The MPR dataset covers 10 years of animal data from 2013 to 2023 while the longevity dataset considers animals with ages between 20 months (earliest calving age) and 20 years (theoretical maximum life span). In total, it comprises 162.057 MPRs for 1208 farms and 64.467 culled animals. The data is provided by Farmtrace and CRV, a dairy farmer cooperative. Farmtrace integrates farm data at-scale from multiple farm sys¬tems across multiple countries. An overview of this data is listed in Table 1 below.
|
Datasets |
Farms |
Animals |
MPRs |
|
Longevity |
3.171 |
64.467 |
NA |
|
Milk |
1.208 |
213.047 |
162.057 |
Table 1: Datasets for Longevity and Milk Production
Note that the longevity dataset contains more farms than the milk dataset because the RVO database contains other farms besides AHV clients due to selling/buying. However, the data for non-AHV clients may not include all the movements for these farms. Here an MPR is a unique Company-date data point.
Feature Selection
We built two models to assess the impact of features on culling and milk production. In the case of longevity, the model estimates the probability of culling using the Gradient Boosting (XGBoost), while for milk production we consider a regression as a function of multiple features. Gradient Boosting is a machine learning model based on gradient descent and decision trees. This model is very successful in various data-driven tasks and provides robust feature selection.
The prediction variables are selected in two stages. First, we gather and build several features based on expert-opinion knowledge, and then keep only weakly correlated features to remove redundancy in the feature space [8]. In the second stage, the model is built, and feature importance is assessed on the prediction accuracy. A correlation between milk production and longevity with their as¬sociated precursors is calculated using the Spearman-rank method. The identification of relevant longevity features and prediction is performed using the XGBoost method.
Longetivity
Longevity is defined as the age of an animal at the culling time. An animal can move between multiple farms before being sent to cull¬ing. We restrict our dataset to animals that are born at a farm and whose only movement is to culling. Therefore, we do not consider intermediate movements like selling or buying. We do this to re¬move the dependence of culling on multiple external farm factors.
The culling age of an animal is defined as the number of days from birth till movement to the culling house (divided by 365 days for year count). The summary statistics for the full dataset are:
|
Farms |
Nr. Culled |
Min date |
Max date |
Min age |
Max age |
Avg Age |
25th |
50th |
75th |
|
3171 |
64467 |
2001-03- 04 |
2023-01- 06 |
1.5 years |
19.4 years |
5.77 years |
3.96 |
5.56 |
7.2 |
Table 2: Summary Statistics of Culled Animals With Ages Between 1.5 and 20 Years
|
Year |
Animals |
Longevity (years) |
|
2021 |
245.965 |
5.97 |
|
2020 |
240.216 |
5.84 |
|
2019 |
233.374 |
5.62 |
|
2018 |
318.712 |
5.55 |
|
2017 |
354.451 |
5.58 |
|
2016 |
286.347 |
5.73 |
|
2015 |
251.551 |
5.75 |
Table 3: Average Culling Age in the Netherlands Since 2015 (Source CRV)
In Table 3 we show national statistics provided by CRV, which we use as a benchmark. We estimate the national average culling age in the period 2015-2021 to be 5.71 years (this is a period that we can use to compare with AHV products). Despite our dataset being much smaller than CRV, the estimated average culling age in the same period is approximately 5.72 years, which is remarkably close to CRV’s.
Culling Age at AHV Farms
This section looks at the culling age of animals that did not receive AHV products. A ”treated” animal is an animal that received at least one AHV solution. We further distinguish those animals that received a QuickTM and/or ExtraTM (QE) tablet or did not receive any solution, not necessarily AHV, (NO-TRT) according to our re¬cordings (collected data via sales reps and farmer’s administration data). The statistics are summarized in Table 5.
|
Treated |
Nr. Culled |
Min date |
Max date |
Min age |
Max age |
Avg Age |
25th |
50th |
75th |
|
AHV |
2822 |
2015-04-01 |
2023-01-05 |
696 days |
16.1 yrs |
6.42 |
4.80 |
6.26 |
7.86 |
|
QE |
2161 |
2019-07-16 |
2023-01-05 |
696 days |
16.1 yrs |
6.59 |
5.04 |
6.47 |
8.02 |
|
NO-TRT |
57013 |
2001-03-04 |
2023-01-06 |
548 days |
19.35 yrs |
5.74 |
3.9 |
5.52 |
7.27 |
|
NON-AHV |
61645 |
2001-03-04 |
2023-01-06 |
548 days |
19.35 yrs |
5.74 |
3.92 |
5.52 |
7.27 |
Table 5: Summary Statistics for (Non)-AHV, QE and Non-Treated (NO-TRT) animals
We can compare with CRV values by restricting to the same period of 2015-2021, see table 3. We calculate that AHV-treated animals have an average culling age of 6.41 years (median 6.26), QE ani¬mals have an average of 6.59 and not-treated animals an average of 5.68.
To assess the statistical significance of these differences we use a t-test for the difference of means (Welch t-test). Since many ani-mals are common to both groups (AHV vs QE for example) we cannot readily compare the significance of the difference. Instead, we compare AHV with NON-AHV and AHV vs NO-TRT, since in this case, the set of animals in each group does not overlap. In both cases, the P-value is extremely small on the order of 1e – 46 rendering the result highly significant.
We see that the groups AHV/QE have culling ages larger than the general population (CRV stats table 3) by an average of 0.71 years more. This can also be seen in other statistics such as median and 80th percentiles.
The culling age of treated animals can be confounded by the age of the first treatment. This means that if animals are treated only late in their lives, their culling ages will be longer too.
The average age of AHV treatment is 5.53 years which indicates that animals are being treated with AHV products near their ex¬pected culling age. It is very complex to model longevity while adjusting to the treatment age. This is so because culling happens much later after treatment (on average after a year) which makes it hard to calculate the causal implications of the age of treatment. We discuss a possible solution to this problem in the next section. Similar work has been developed for cohort data to assess the ef-fect of agricultural policies on longevity [12].
In Figure 1 we look at the time-to-culling per age, this is how long an animal lives after receiving an AHV solution, as a function of the age of treatment. This provides more granularity on how time-to-culling depends on the age of treatment. To do this we build a KnearestNeighbor-Regressor with a Gaussian kernel that esti- mates the time-to-culling as a function of the age of treatment. The KnearestNeighbors-Regressor algorithm calculates a prediction by averaging the target of data points that are closest to each other. We chose this model because it provides an easy-to-understand calcu¬lation of the estimated time-to-culling: it takes animals with very close age of first treatment and averages the time-to-culling times.

Figure 1: Estimated time-to-culling (in years) regression using KNearestNeighbors - dark line. The horizontal line is the average 6.42 − 5.53 = 0.89, and the dashed line represents the distribution of animals as a density (axis on the right).
From the distribution of the age of treatment (dashed line in Fig-ure 1) we see that most of the animals are aged between 2.5 and 9 years. For this range of ages, the model prediction is reliable due to the substantial number of animals involved. We see that the estimated time-to-culling tends to decrease as animals are treated later in their life. This is expected because the longer an animal stays on the farm, the higher is the chance of being culled, and hence smaller its time-to-culling. We also see that in this age range the expected time-to-culling is always larger than 0.6 years (219 days) and has an average of approximately 0.89 years (325 days).
This seems to indicate that the age of treatment may have less influence on the culling age, as it would have if the difference be-tween those values were higher.
Deconfounding the Age of Treatment
In the previous section, we saw that the group of animals that re-ceived an AHV treatment had a higher culling age of, on average, 0.73 years more than those that did not receive it. We have also pointed out that the age of treatment has a confounding effect if the age at treatment is large then also the culling age. In this section, we focus on the confounding effect of the treatment.
To assess the causal effect of a treatment on longevity we would typically run a randomized control trial (RCT). This would con¬sist of randomly selecting two groups of animals and assigning an AHV treatment and a placebo to each group separately. At the end of the trial, when all animals have been culled, we would calcu¬late the average culling ages. For obvious reasons, we cannot cre¬ate such a trial; hence, the need to use data from non-randomized studies. This brings several difficulties related to selection bias and confounding, requiring sophisticated techniques and analysis [13]. In this work, we use counterfactual models to recreate the RCT- one model for the treated group and another one for the non-treated group. Each counterfactual model separately estimates the culling probability.To assess the treatment effect, we calculate the culling probabilities of each model on the same animal this provides an unbiased estimate of the effect.
We follow the approach to model the probabilities of culling for the treated and non treated animals separately: the two models, model-treated and model-non-treated, are used as counterfactuals.
Each counterfactual model influences the farmer's decision to cull or not, depending on whether the animal has been treated or not. We are interested in estimating the expected probability of culling on the treated animals if they were not treated, this removes the bias on the treatment age and adjusts for several features.
The study of longevity is a typical example of a survival-analy- sis problem: one is interested in culling events that only happen once for each animal. In this problem, the survival dataset contains time-varying features with left-truncated data. The left truncation comes from ignoring data before the age of the first treatment [12].
Features
We consider the following features for modeling in Table 4 below:
|
Feature |
Description |
Units |
|
farm id |
farm number |
dummy |
|
age |
age at the MPR recording |
years |
|
days in milk |
days since calving |
days |
|
milk yield |
milk of MPR |
Kg |
|
isk |
ISK milk value |
Kg |
|
scc |
somatic cell counts |
1000 cells/ml |
|
fat |
milk fat percentage |
% |
|
fat/protein |
fat protein ratio |
– |
|
protein |
milk protein percentage |
% |
|
lactose |
milk lactose percentage |
% |
|
urea |
urea |
mg/100g |
|
Ketosis ind |
CRV ketosis prediction (false/true) |
0/1 |
|
Ketosis events |
number of ketosis events until MPR |
dummy |
Table 4: Features for Longevity Models. Here the feature ”Ketosis ind” is the CRV prediction for Ketosis, which is provided to the farmer in the MPR report.
Since many of these features are highly correlated with each other, it is appropriate to filter these out before building the model. This process removes redundancy in the feature space and enhances model feature selection. We do this filtering by keeping features that have low Spearman-rank correlation with each other. This can be done by clustering (dendrogram) the features according to their correlation coefficients. The dendrogram 2 clusters feature that are highly correlated with each other. We choose (visually) a thresh¬old of 0.5 in the distance space of the dendrogram (see Figure 2). From each selected cluster we further choose the features: milk yield, days in milk, SCC, fat, lactose, urea, age, ketosis index and farm id.

Figure 2: Spearman-Rank-Correlation Dendrogram (Left) And Heatmap (Right)
Results Counterfactual Models
Survival models are typically hard to build in the presence of time-varying features. In this work, we follow a different ap-proach. The article shows how to recast a survival problem as a binary classification problem, making the analysis much easier [14]. Furthermore, we can use simpler classification models such as Logistic-Regression.
Typically, in a survival analysis, we have a cohort of subjects that is followed through time (calendar time). In our case, we cannot do this since data has been collected at different time points and at different farms. Instead, we use age as the time direction, meaning that the event time is identified by the animal’s age. In a way, we simulate a trial experiment where animals are born simultaneously and followed till culling. This is depicted in Figure 3. At each event (red circle) we inspect which animals are not culled (green cross) and store the features of all animals at that event. The final dataset then contains positively labeled events (the cullings) and negatively labeled events (the events where animals survived).

Figure 3: Survival as classification. The dashed lines correspond to the time prior to the first treatment which is truncated, meaning that it is not part of the modeling. The red circles correspond to culling events. At each event time, we label the culling events as y = 1 and non-culling events (green x) as y = 0.
We train two classification models using the XGBoost algorithm. The first on a dataset Dtreated : {Xtreated, ytreated} corresponding to culled animals that received an AHV treatment and composed of MPRs that occurred after the treatment. The second model is trained on a dataset Dnon-treated : {Xnon-treated, ynon-treated} corresponding to culled animals that didn’t receive any AHV treatment in their lifetime. For this model, we keep all the MPRs available. We have considered two models instead of one because the number of sam¬ples in the treated dataset is much smaller than in the non-treated. This way we allow the treated features to be learned by the model. In both cases, we keep MPR recordings after ”2015-01-01”, so both the treated and non-treated data span a similar period of time. Here X stands for the features determined in section , and y is the culling event: 1 if culled, 0 otherwise.
The datasets have a very imbalanced label distribution. For the Dtreated the ratio of positive to negative events is approximately 10%, while for the non-treated dataset, this ratio is about 4. We introduce balance in training by adding weights to the positive la¬bels.
For training, we use the XGBoost model and GridSearchCV for hyperparameter search. Due to the high class imbalance, we use the average precision (AP) metric, the area under the Precision-Recall curve. The Precision-Recall curve shows the relationship between precision and recall for different probability thresholds ranging from zero to one. The results are shown in Figure 4.

Figure 4: Precision-Recall Curve
We see that the Modelnon-treated performs better than the Modeltreat-ed when the threshold is high, meaning that it predicts less false positives. In contrast, the Modeltreated performs better for smaller thresholds.
We use permutation importance to determine the impact of the fea¬tures on model prediction [15]. Figure 5 details the impact of each feature in the average precision metric. The four most important features for the model are milk yield, farm id, SCC and days in milk, while for the non-treated model, they are days in milk, age, milk yield and farm id, in descending order of importance. Age has a more deterministic effect on culling for the non-treated model than the treated one. This can be understood from the fact that in the non-treated dataset, we include all the data available with no age truncation. While in the treated dataset we keep features measured only after the first AHV treatment. Recall that in the pre¬vious section, we saw that an animal takes on average 0.89 years to be culled after treatment.

Figure 5: Permutation feature importance for treated/non-treated models. Each value represents the average decrease in the overall average precision (0.27).
We can also describe the behaviour of the culling probability as a function of the most important features. In Figures 6 and 7, we show partial dependence plots for the features milk yield, SCC, age and days in milk (DIM). We have excluded farm id because it is a categorical feature with high cardinality which would make the plot difficult to interpret.
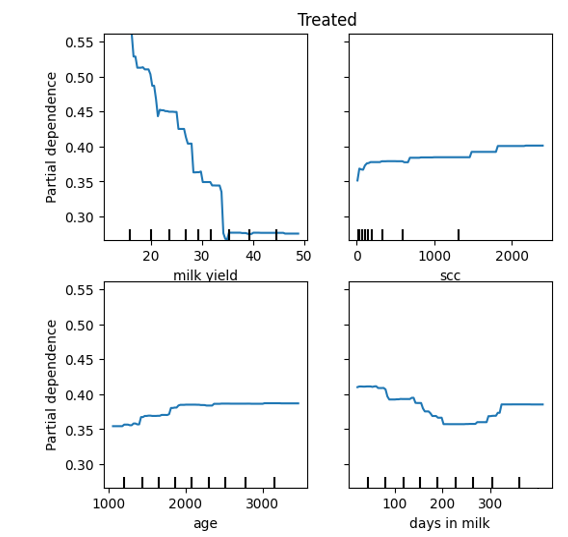
Figure 6: Partial dependence plot for the treated model. Here age is in day.
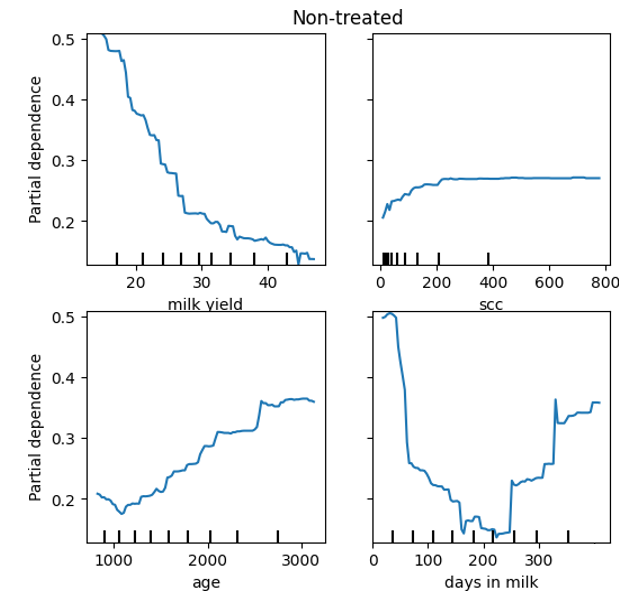
Figure 7: Partial dependence plot for the non-treated model. Here age is in days.
The average precision of the models is small, with a value of AP = 0.27 in both cases. We are not interested in making individual predictions. Instead, we want to determine whether the treated ani-mals have on average a smaller culling chance than the non-treated ones. For this purpose, we calculate the geometric average of the predicted culling probability from both the models on the treated dataset (test set). For this problem, the geometric average is more appropriate than the simple average because it preserves the likeli¬hood. We calculate the ratio:
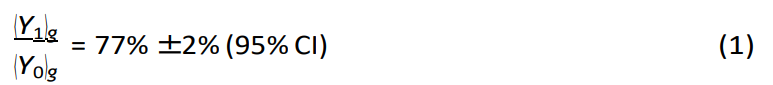
where g stands for the geometric average and Y1 is the probability of culling if treated, and Y0 is the counterfactual probability, that is, the probability of being culled if not treated. The result (1) shows that the culling chance drops by 23% if treated
Milk Production
In the previous section, we investigated the longevity of cows and their probability of being culled. In this section, we examine the effect of various treatments on ISK. The ISK indicates the daily production of each individual cow in kilograms of milk on the day of sampling. The milk yield is converted to the production that the animal would have realized at 100 days in lactation, after calving in February or March at an age of 69 to 92 months. Correction for age, season of calving and stage of lactation makes the ISK of different samples comparable.
It is well established that cows in poor health yield less milk [16]. As a result, farmers may make treatment decisions based on the impact on milk production and therefore we limit our analysis to AHV and non-AHV treated animals. Our data does not contain information about genetics, breeding, feeding practices, and en¬vironmental conditions which could potentially affect milk pro¬duction. Therefore, we focus on the treatments that fall under the AHV or non-AHV group and how these treatments are applied differently per farm.
We concentrate on the mostly sold products by AHV, specifically; Aspi, Extra, and Quick. The objectives in this chapter are to iden-tify any correlations between milk production and these and these three products. This analysis is based on the hypothesis that the use of AHV products increases longevity, and in turn overall milk yield, contributing to the profitability of a dairy farm. Increasing longevity without milk production will be of no added value for a farmer. .
Spearman-Rank Relation Between SCC and ISK
The results of the analysis, presented in Figures 8a and 8b, show that there is a negative correlation between cell count and ISK. This means that as cell count increases, ISK decreases. The nega- tive correlation is generally accepted (for review see for example (Hand et al.)) that higher cell counts correlate with a decrease in milk production [17].
To determine the significance of the relationship between cell count and ISK, we performed a Spearman-rank correlation coefficient test [18]. The results showed a statistically significant correlation with a p-value of less than 0.05. However, we observed also that the non- AHV group exhibited a stronger correlation between cell count and ISK, implying a greater effect on milk production. In contrast, the AHV group demonstrated a reduced decline in ISK as cell count increased, indicating a weaker association between cell count and milk production in this group.

(a) ISK versus Cellcount (AHV and non-AHV)
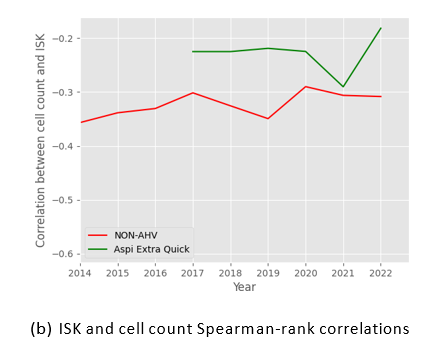
Figure 8: Negative Correlation Between Cell Count and ISK
Average ISK for (non)-AHV Products
The impact of treatments on ISK was analyzed by comparing the change in ISK for the top 3 AHV products to that of non-AHV products. The results, as depicted in Figure 9, indicate that the av- erage ISK of the AHV group is higher than that of the non-AHV group. To further investigate these observations and control for management practices, the ISK values for the four largest compa¬nies (in terms of number of animals) were examined with respect to the influence of AHV and non-AHV treatments during different lactations in table 6. By examining lactation, we aimed to control for the influence of age and provide a more comprehensive com-parison of treatments within a single company.

Figure 9: Average ISK Values Over Time for Different Treatments
|
|
Farm |
|
|
|
|
|
|
|
|
|
I |
|
II |
|
III |
|
IV |
|
|
Lactation |
AHV |
NON-AHV |
AHV |
NON-AHV |
AHV |
NON-AHV |
AHV |
NON-AHV |
|
1 |
46.6 |
45.3 |
50.8 |
50.3 |
40.2 |
40.1 |
55.8 |
45.1 |
|
2 |
48.8 |
45.9 |
51.2 |
50.0 |
42.1 |
41.3 |
46.6 |
45.3 |
|
3 |
49.5 |
46.2 |
51.2 |
50.0 |
42.1 |
41.3 |
46.6 |
45.3 |
|
4 |
50.1 |
46.2 |
50.5 |
49.7 |
42.9 |
41.1 |
45.3 |
45.8 |
|
5 |
50.8 |
44.6 |
53.3 |
50.1 |
41.9 |
41.6 |
|
|
|
6 |
|
|
53.6 |
51.4 |
42.5 |
41.0 |
|
|
|
7 |
|
|
52.7 |
50.9 |
42.3 |
40.6 |
|
|
|
8 |
|
|
51.2 |
50.0 |
42.1 |
40.6 |
|
|
|
9 |
|
|
50.9 |
49.9 |
41.9 |
39.4 |
|
|
|
10 |
|
|
|
|
|
|
|
|
|
Avg |
|
3.6 |
|
1.5 |
|
1.2 |
|
0.1 |
|
diff |
|
|
|
|
|
|
|
|
Table 6: Average Milk Production of Different Lactation’s for the Biggest 4 Farms (Out of the Selected 10 Farms), Grouped Per (Non)-AHV Treatment
Table 6 displays the comparison of the ISK values for the AHV and non-AHV treatments per company basis. The data suggests that the AHV treatment leads to higher ISK values. To provide a more comprehensive view, Table 7 presents an overview of the top 10 farms and the lactation phases for both the AHV and non-AHV treatments. For these top 10 farms, we have aggregated the data and averaged the non-AHV values per lactation. The analysis highlights a positive trend in favor of the AHV treatment. The results suggest that, based on historical data, the use of the AHV treatment results in improved milk production in cows when com¬pared to the use of the non-AHV product.
|
Lactation |
AHV mean |
NON-AHV mean |
Difference |
Percentage difference |
|
1 |
44,2 |
42,6 |
1,6 |
3,7% |
|
2 |
43,7 |
43,0 |
0,8 |
1,7% |
|
3 |
44,7 |
44,4 |
0,3 |
0,7% |
|
4 |
45,0 |
44,7 |
0,3 |
0,7% |
|
5 |
45,5 |
44,4 |
1,1 |
2,4% |
|
6 |
44,7 |
44,3 |
0,3 |
0,8% |
|
7 |
44,6 |
43,8 |
0,8 |
1,7% |
|
8 |
44,2 |
43,6 |
0,5 |
1,2% |
|
9 |
44,1 |
43,4 |
0,7 |
1,7% |
|
Avg |
44,5 |
43,8 |
0,7 |
1,6% |
Table 7: Overview of Average of Top 10 Largest Companies in Terms of Number of Cows
ROI Model and Added Value Farmer
The return on investment (ROI) is a crucial metric for farm-ers to measure the success of their operations. AHVs model has revealed that the ROI for AHV treatment is significantly higher compared to traditional treatments. One of the reasons for this in¬creased ROI is the low milk loss associated with AHV treatment. Traditional treatments such as antibiotics and painkillers result in milk loss due to the mandatory (statutory) withholding periods for milk, which is not necessary after the use of AHV products.
Table 5 shows that animals treated with AHV products have a high- er culling age of on average 0.7 years compared to the non-treated ones. Before calculating the ROI, first the average number of days in milk and number of lactation’s is calculated. Leading to sub¬sequently 1470 and 4.1 for AHV QE and 1198 and 3.35 when no treatment is applied. The average milk yield per MPR for AHV QE is 29.85 kg and 29.41 kg when no treatment is applied.
In this model we used we used a milk price; Milk Fat: EUR 300,-per 100 kg and Milk Protein EUR 595,- per 100 kg the revenue per cow for her whole life is calculated in Table 8 [19].
|
|
Produced Milk (kg) |
Milk Protein |
Milk Fat |
Total |
Revenue per day of life |
|
AHV |
42.212 |
€ 9.124,- |
€ 5.620,- |
€ 14.744,- |
€ 6,29 |
|
AHV QE |
43.881 |
€ 9.485,- |
€ 5.829,- |
€ 15.314,- |
€ 6,37 |
|
No Treatment |
35.228 |
€ 7.615,- |
€ 4.690,- |
€ 12.305,- |
€ 5,87 |
Table 8: ROI Per Treatment for Average Milk Price
This results in a cow that is treated with the AHV QE earned per day of life EUR 0.50, leading to EUR 3.009,- more profit over the cow’s whole life. Based on historical data a cow is treated maxi-mum 3 times with AHV QE during its whole life. Taking the cur-rent price EUR 81,- of AHV QE, result in a maximum treatment cost of EUR 243,- per cow’s life. However, on average a cow requires only 2.1 treatments during in its life cycle which even increases the ROI.
In addition, a higher culling age leads to a lower replacement per-centage. On average, raising a heifer costs a farmer per heifer EUR 1,790 in Europe. Also, heifers produce less milk in the first lactation than mature cows.
It’s important to note that the exact benefits of AHV treatment may vary depending on milking hygiene and infectious pressure on an individual farm, requiring targeted treatment with antibiotics.
Conclusion
Making use of a large database identifying animal numbers and production data of dairy cows in the Netherlands, and using dif-ferent statistical models, it was demonstrated that dairy cows that received one or more AHV products on average lived 0.7 years longer than cows that were not treated with AHV products.
Furthermore, comparing ISK data, it could be demonstrated that animals that received AHV treatment had not have a reduced im¬pact of somatic cell count on milk production than those that did not receive AHV treatment. This contributes to the overall milk production rate, as high SCCs are generally associated with lower milk yield. Applying the ROI model with common costs to raise heifers and milk prices in The Netherlands, a higher milk rev¬enue was calculated when comparing AHV treated animals vs non-treated animals. In addition, the higher culling age leads to a lower replacement percentage contributing to the overall ROI of AHV treated cows. Selecting the top 10 largest dairy companies, the use of AHV products resulted in an average increase in milk yield per lactation of 1.6% when compared to non-AHV treated animals. Further studies will aim to substantiate these findings by analyzing the prevalence of diseases on a farm which generally re¬sult in early culling such as chronic mastitis, metabolic disturbanc¬es related to rumen disfunction and the prevalence of lameness and impaired claw heath [20].
Future Work
We first reviewed the ISK and the longevity, the data sources, precursors and machine learning model outcomes. A model was derived to predict culling probability for each cow using the XG-Boost method. To further evaluate the usefulness of this prediction tool for farmers, we will conduct a feasibility study where we an-alyze how it can be used in their decision-making and planning to ensure the efficiency of farm operations. We aim to create an algo¬rithm that informs the farmer of the possible outcomes of an AHV treatment including milk production enhancement and longevity.
References
- Dematawewa, C. M. B., R. E. Pearson, and P. M. VanRaden. "Modeling extended lactations of Holsteins." Journal of Dairy Science 90.8 (2007): 3924-3936.
- Grzesiak, W., Lacroix, R., Wójcik, J., & Blaszczyk, P. (2003). A comparison of neural network and multiple regression predictions for 305-day lactation yield using partial lactation records. Canadian Journal of Animal Science, 83(2), 307-310.
- Upton, J., Murphy, M., Shalloo, L., Koerkamp, P. G., & De Boer, I. J. (2014). A mechanistic model for electricity consumption on dairy farms: Definition, validation, and demonstration. Journal of dairy science, 97(8), 4973-4984.
- Njubi, D. M., Wakhungu, J. W., & Badamana, M. S. (2010). Use of test-day records to predict first lactation 305-day milk yield using artificial neural network in Kenyan Holstein–Frie-sian dairy cows. Tropical animal health and production, 42,639-644.
- Adriaens, I., Saeys, W., Huybrechts, T., Lamberigts, C., François, L., Geerinckx, K., ... & Aernouts, B. (2018). A novel system for on-farm fertility monitoring based on milk proges-terone. Journal of dairy science, 101(9), 8369-8382.
- Essl, A. (1998). Longevity in dairy cattle breeding: a review. Livestock production science, 57(1), 79-89.
- Fetrow, J., Nordlund, K. V., & Norman, H. D. (2006). Invited review: Culling: Nomenclature, definitions, and recommendations. Journal of dairy science, 89(6), 1896-1905.
- Roche, S. M., Renaud, D. L., Genore, R., Shock, D. A., Bau-man, C., Croyle, S., ... & Kelton, D. F. (2020). Canadian National Dairy Study: Describing Canadian dairy producer practices and perceptions surrounding cull cow management. Journal of dairy science, 103(4), 3414-3421.
- Van Doormaal, B. (2009). A closer look at longevity. Canadian Dairy Network Information Article May.
- FAO. (2020). FAO promotes prudent use of antimicrobials. World Antimicrobial Awareness Week 2020 across Europe and Central Asia.
- Health EC Europa. (2015). Prudent use of antimicrobials in veterinary medicine.
- Kulkarni, P., Mourits, M., Nielen, M., van den Broek, J., & Steeneveld, W. (2021). Survival analysis of dairy cows in the Netherlands under altering agricultural policy. Preventive Veterinary Medicine, 193, 105398.
- Pearl, J., Glymour, M., & Jewell, N. P. (2016). Causal inference in statistics: A primer. John Wiley & Sons.
- Craig, E., Zhong, C., & Tibshirani, R. (2021). Survival stacking: casting survival analysis as a classification problem. arX-iv preprint, arXiv:2107.13480.
- Altmann, A., ToloÅ?i, L., Sander, O., & Lengauer, T. (2010). Permutation importance: a corrected feature importance measure. Bioinformatics, 26(10), 1340-1347.
- Rajput, M. N., Arora, R., Kaur, M., Dhaliwal, G. S., (2018). Effect of varying the amount of dried distillers grains with sol-ubles in the diet on feed intake, milk yield, and milk composition of dairy cows. Journal of Dairy Science, 101(1), 429-436.
- Hand, K. J., Godkin, A., & Kelton, D. F. (2012). Milk production and somatic cell counts: A cow-level analysis. Journal of dairy science, 95(3), 1358-1362.
- Kosslyn, S. M., Thompson, W. L. (2015). Why images and language are different. Metaphor and Symbol, 30(2), 73-80.
- FrieslandCampina. (2023). FrieslandCampina-garantieprijs voor boerderijmelk in februari: 56,00 euro.
- Bengtsson, B., & Greko, C. (2014). Antibiotic resistance— consequences for animal health, welfare, and food production. Upsala journal of medical sciences, 119(2), 96-102.