
Advancements in Journal of Urology and Nephrology(AJUN)
ISSN: 2689-8616 | DOI: 10.33140/AJUN
Impact Factor: 1.0


Research Article - (2020) Volume 2, Issue 1
Liver Function Enzymes are Potential Predictive Markers for Kidney Allograft Dysfunction
2USU-Walter Reed Department of Surgery, Uniformed Services University, Bethesda, MD, United States
3Department of Medicine, Uniformed Services University Bethesda, MD, United States
Received Date: Jan 31, 2020 / Accepted Date: Feb 11, 2020 / Published Date: Mar 03, 2020
Copyright: ©Meera Srivastava, Rahul M Jindal et al. This is an open-access article distributed under the terms of the Creative Commons Attribution License, which permits unrestricted use, distribution, and reproduction in any medium, provided the original author and source are credited.
Abstract
Introduction: Biopsy of the allograft is the gold standard for assessing kidney allograft dysfunction. The aim of our pilot study was to identify serum biomarkers that could obviate the need for biopsy.
Materials and Methods: We conducted a study to identify the biomarkers in the serum from different groups of chronic kidney disease (CKD) patients and kidney transplanted patients vs. healthy individuals. The four groups (n=25 in each group) were as follows: 1) Patients with unstable kidney allograft transplants requiring biopsy for cause, 2) Patients with stable kidney allograft transplants, 3) Patients with CKD not on immunosuppressive therapy and, 4) healthy subjects. We measured the activity and level of serum alkaline phosphatase (ALP) and other liver enzymes (alanine transaminase (ALT) and aspartate transaminase (AST)) as potential serum biomarkers in acute allograft dysfunction.
Results: We found that ALP correlated with allograft biopsy findings, liver function, and clinical outcomes and possibly graft survival. Additionally, AST and ALT were higher in patients with graft rejection compared to non-rejected and stable kidney transplants. Moreover, the low Pearson correlations (r- values) between ALP level with age (r=0.179), gender, body mass index (r=0.236), creatinine (r=0.044) or estimated glomerular filtration rate (r=0.048) suggest that ALP may be an independent biomarker which is relatively unaffected by other individual-level variables.
Conclusion: ALP may be a putative biomarker to predict kidney allograft function and rejection. Data also indicated that liver function plays an important role for the overall success of kidney transplantation.
Keywords
Serum alkaline phosphatase, chronic kidney disease, Kidney allograft rejection, non-invasive biomarker.
Abbreviations
NIDDK: National Institute of Diabetes and Digestive and Kidney Diseases
WRNMMC: Walter Reed National Military Medical Center
USUHS: Uniformed Services University of the Health Science
ALP: Alkaline phosphatase
EPO: erythropoiesis stimulating agent
CRP: C-reactive protein
VEGF: vascular endothelial growth factor
CKD: Chronic kidney disease
MUP: 4-Methylumbelliferyl-phosphate
FI: fluorescent intensity
NM: nanometer
ALT: alanine transaminase
AST: aspartate transaminase
eGFR: estimated glomerular filtration rate
°C: degrees Celsius
IRB: Internal Review Board
BMI: Body Mass Index
CV: cardiovascular
ESRD: End stage renal disease
CAC: Coronary artery calcification
MHD: maintenance hemodialysis
VSMCs: vascular smooth muscle cells
C-VSMCs: calcifying vascular smooth muscle cells
Introduction
According to the National Institute of Diabetes and Digestive and Kidney Diseases (NIDDK), kidney disease is the 9th leading cause of mortality in America, with an estimated 30 million Americans suffering from Chronic Kidney Disease (CKD) [1]. Additionally, approximately 660,000 Americans have kidney failure, 470,000 of whom are on dialysis, and 100,000 are awaiting kidney transplantation [2, 3]. However, with only 18,000 kidney transplants conducted per year, there exists a stark contrast between the number of individuals who require a kidney transplant and the availability of kidneys [4]. Therefore, preservation of renal allograft function to obviate the need for repeat transplant is of paramount importance. The purpose of this study was to investigate the possible correlation between serum alkaline phosphatase (ALP) levels and kidney allograft dysfunction, with the aim of increasing the long term clinical function of kidney transplant allografts.
Alkaline phosphatase affects inflammatory responses in patients with CKD and has been reported to be associated with erythropoiesis stimulating agent (EPO) resistant anemia [5]. While other biomarkers such as Vascular Endothelial Growth Factor (VEGF) gene polymorphism has been associated with long-term kidney allograft outcomes, sparse data are available regarding the effect of ALP in kidney transplant recipients [6].
In humans, ALP is present in all tissues, but is particularly concentrated in the liver, bile duct, kidney, bone, intestinal mucosa, and placenta [7]. Quantitative tissue specific ALP and other liver function enzyme expression levels, particularly, alanine transaminase (ALT) and aspartate transaminase (AST), were presented in the Fig 1. In the serum, twotypes of ALP isozymes are present: skeletal and liver [7, 8]. during childhood, the majority of ALP are of skeletal origin. Humans and most other mammals contain the following ALP isozymes: ALPI– intestinal (molecular weight of 150 kDa), ALPL– tissue-nonspecific (expressed mainly in liver/bone/kidney), ALPP–placental (Regan isozyme), and GCAP – germ cell. Four genes separately encode the four isozymes [9-11]. The gene for tissue-nonspecific ALP is located on chromosome 1, and genes for the other three isoforms are located on chromosome 2 [12].
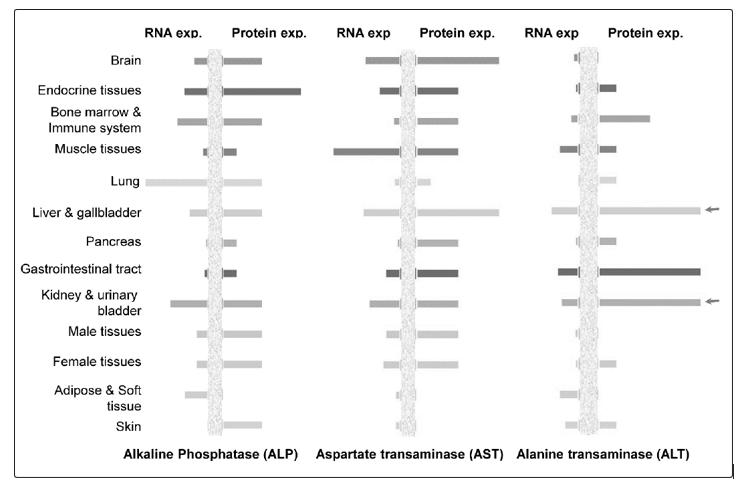
Figure 1: The expression levels Alkaline Phosphatase (ALP), Alanine Transaminase (ALT), and Aspartate Transaminase (AST) (both protein and messenger RNA levels) in different human tissues were presented. The data were analyzed from the Human Protein Atlas (HPA) database (www.proteinatlas.org). The RNA-seq results generated in HPA are reported as number of transcripts per million (TPM). Each bar represents the highest expression score found in a particular group of tissues. For protein expression score, each bar represents the highest expression score found in a particular group of tissues. For genes where more than one antibody has been used, a collective score is set displaying the estimated true protein expression.
In terms of biological function and importance, ALP has previously been linked to all-cause and cardiovascular death in several diseases, especially diseases relating to the veins or heart [13]. It is also important to mention the elevated values of liver function tests (including ALP, ALT and AST) in liver transplant patients [14, 15]. In a study containing 5540 patients with coronary artery disease, increased ALP was independently associated with an increased risk of 3-year all-cause mortality [16]. Another study, with over 10,000 patients, reported similar findings in that ALP was associated with an increased risk of all-cause mortality and cardiovascular-related hospitalizations [17, 18]. The study also found that high ALP was associated with increased risk of hospitalization due to infection or bone fracture [18].
The association between high ALP and mortality may be the result of increased vascular calcification and inflammation. Alkaline phosphatase hydrolyzes pyrophosphate, an inhibitor of calcification, which in turn could lead to excessive vascular calcification. An association between ALP and calcification has been shown numerous times in previous studies, especially in patients on hemodialysis, who often have elevated ALP [19]. High serum ALP has been linearly associated with and described as an independent risk factor for all-cause mortality in addition to increased coronary calcification in hemodialysis and peritoneal dialysis patients [20-24]. In addition, a retrospective analysis of >11,000 kidney transplant recipients found an association between non-transplant serum ALP >120 U/L with increased risk of graft failure, all-cause mortality, and cardiovascular (CV) mortality [25]. Two previous studies have shown a correlation between ALP and C-reactive protein (CRP) levels in regard to systemic inflammation [26, 27]. These studies suggest ALP’s integral role in vascular calcification and inflammation – both of which are key aspects for the health of a transplant recipient [19]. Therefore, we hypothesized that kidney allograft dysfunction was associated with higher level of ALP after kidney transplantation.
Methods
Ethics Statement: The study was approved by the joint IRB of Walter Reed Military Medical Center (WRNMMC) and the Uniformed Services University of The Health Sciences (USUHS), Bethesda, MD. Informed consent was obtained for experimentation from every individual subject and subjects were de-identified to protect their identities and were assigned a random study number.
Patient Recruitment and Serum Collection
Study groups consisted of the following categories: 1. Patients with allograft dysfunction who had undergone a “for-cause” renal biopsy after renal transplantation (N=25), 2. Patients with stable renal allografts (N=25), 3. Patients with CKD on dialysis (N=25), and 4. Control subjects (N=25). Upon consent, samples had baseline and follow-up blood draws at 3, 6, 9, 12, 18, and 24 months. Blood samples were collected by venepuncture into red top BD tubes and allowed to clot at room temperature for thirty minutes. A portion of the sample was also sent to the WRNMMC lab for clinical analysis for the following tests: albumin, and liver function tests. Samples were centrifuged at 1200xg for 20 minutes at room temperature. Serum was collected and aliquoted into labelled tubes and stored at -80 °C until further use.
Alkaline Phosphatase Enzymatic Activity Measurement
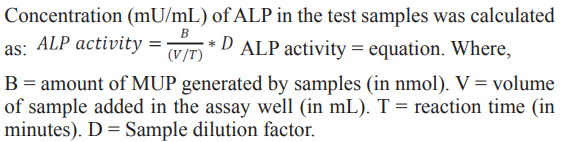
To determine ALP levels, the test was performed in the research lab, by using a fluorescent-based method which utilizes ALP substrate 4-Methylumbelliferyl-phosphate (MUP) (Abcam, Cambridge, MA). The MUP is specific to ALP and when cleaved, has a significantly higher fluorescent emission at 420 nm (optimal excitation wavelength of 360 nm) (Fig. 2). The fluorescent-based method was performed due to fluorescence being a more sensitive and accurate method compared to colorimetry. The assay requires three solutions: a serum sample, buffer, and the alkaline phosphatase substrate MUP. To perform the assay, 220 μl of buffer and 21 μl of diluted serum were mixed (separate mixtures for each sample) and 100 μl of each mixture was added to the wells in duplicate. After all of the sample mixtures were added, a fluorescent mixture of MUP and the buffer was created. For each well, 20 μl of 0.5 mM MUP was added with a channel pipette. After MUP was added to the last buffer, the plate was covered to block light from interfering with the fluorescent dye and was placed on a shaker until the desired time point was reached (1 hour). The emission was measured at 420 nm (excitation of 360 nm).
ALP Activity Measurement Units (U)
To determine the optimal incubation time length and serum concentration, two standard curves were performed. The first standard curve involved changing the incubation time from zero minutes to 1 hour. The second standard curve involved changing the concentration of serum from a 1:12 dilution to a 1:1200 dilution. Following the two standard curves, the most optimal incubation time and concentration were determined by determining where the data had the largest linear range. For time, the data had the largest linear range near the 30-minute incubation time-point and for serum concentration, the data had the largest linear range at a 1:48 total dilution (2.5 μl serum within a 120 μl mixture of buffer and MUP). The mathematical equation and other standard curve calculations were followed according to manufacturer’s instruction.
Data Analysis and Statistical Values
To determine ALP levels, all 93 samples were tested simultaneously, in duplicate, on two separate micro-assay plates. The procedure followed the same steps as above, with the total sample dilution as 1:48 and the incubation time as 30 minutes. Levels of ALP were log2 transformed and Welch’s t-test was used to evaluate the difference in the levels of ALP between the study groups. For statistical significance, p<0.05 was used as significance cutoff. The association between levels of ALP and test variables (age, BMI, creatinine and eGFR) were computed using Pearson’s correlation coefficient (r) and p<0.05 was used as significance cutoff. Dot-plots in combination with linear model fit were used to generate the correlation graphs. R-studio (R version 3.0.1) and GraphPad Prism (version 7.05) were used to create visual graphics, co-relation graphs (r- values), statistical values (p-values) and, Plot3D package in R was used to generate the three-axis plot with variables eGFR, ALP and creatinine.
It is important to mention that for group 4 individuals, there are some clinical parameters such as creatinine level, ALT, AST etc., we were unable to measure due to funding issues and/or IRB protocol limitations.
Results
Activity of ALP Levels in Different Groups of the Patients
Group 1 included kidney transplant recipients who required a post-transplant biopsy (due to kidney allograft dysfunction); Group 2 included patients with functionally stable kidney transplants; Group 3 comprised non-transplant patients with CKD and, Group 4 included healthy controls as shown in Table 1a.
Table 1: (a) Age and gender distribution of study subjects in Groups 1 to 4. (b) The differential expression of Alkaline Phosphatase (ALP) within different study groups and statistical values. Probabilities of statistical significance (p-value) and log2 ALP values per group and gender. Probabilities of statistical significance between each group. (c) Probabilities of statistical significance between male and female between each group. (d) Descriptive statistical values of clinical ALP, Creatinine, and calculated eGFR for Groups 1 to 3.
|
a. Groups: General Description |
Patients (n) |
M:F |
Avg Age |
AGE STDV |
|
1 |
25 |
16:09 |
54.6 |
13 |
|
2 |
25 |
14:11 |
53.4 |
14.7 |
|
3 |
25 |
16:09 |
60.2 |
16.2 |
|
4 |
25 |
12:13 |
42 |
15.3 |
|
b. ALP: Multiple Group Comparison |
P-Values |
Gr |
P-values |
|
|
1 .vs 2. |
P=0.2314 |
2 vs 3 |
P=0.7027 |
|
|
1 .vs 3. |
P=0.1302 |
2 vs 4 |
P=0.0230 |
|
|
1 .vs 4. |
P=0.0026 |
3 vs 4 |
P=0.0567 |
|
|
c. ALP: Group and Gender versus Group and Gender |
P-Values |
|
|
|
|
Male .vs Female |
P=0.143433 |
|
|
|
|
Group 1:Male .vs Group 1:Female |
P=0.690448 |
|
|
|
|
Group 2:Male .vs Group 2:Female |
P=0.580855 |
|
|
|
|
Group 3:Male .vs Group 3:Female |
P=0.076742 |
|
|
|
|
Group 4:Male .vs Group 4:Female |
P=0.337215 |
|
|
|
|
Group 1:Male .vs Group 2:Male |
P=0.347262 |
|
|
|
|
Group 1:Female .vs Group 2:Female |
P=0.556834 |
|
|
|
|
Group 3:Male .vs Group 4:Male |
P=0.003373 |
|
|
|
|
Group 3:Female .vs Group 4:Female |
P=0.765126 |
|
|
|
|
d. ALP and other clinical parameters |
Group 1 |
Group 2 |
Group 3 |
|
|
ALP value (U) |
|
|
|
|
|
Median |
105.3 |
87.98 |
85.33 |
|
|
Mean |
113 |
94.58 |
91.56 |
|
|
Std. Deviation |
48.02 |
33.88 |
33.8 |
|
|
Creatinine (mg/dL) |
|
|
|
|
|
Median |
1.84 |
1.22 |
2.99 |
|
|
Mean |
2.6 |
1.4 |
3.8 |
|
|
Std. Deviation |
2.172 |
0.5849 |
2.423 |
|
|
eGFR |
|
|
|
|
|
Median |
37.1 |
57.9 |
20.7 |
|
|
Mean |
39.8 |
60.4 |
28.9 |
|
|
Std. Deviation |
18.96 |
20.21 |
24.79 |
|
To determine self-fluorescence of the substrate, the fluorescent intensity (FI) was observed in the absence and the presence of ALP. In the absence of ALP, fluorescence was approximately 6000 fluorescent intensity units (FIU); whereas, in the presence of ALP, fluorescence was roughly 53,000 FIU - 8 to 9 fold increase (Fig 2b).
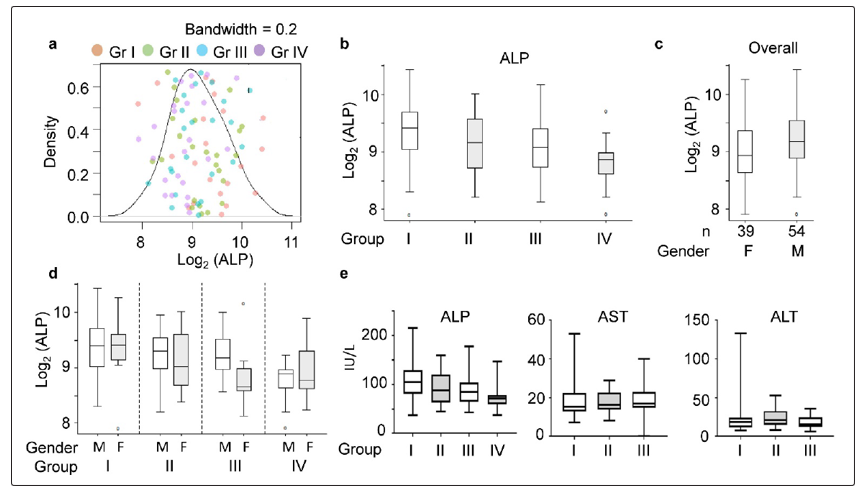
Figure 2: Schematic diagram for the measurement of Alkaline Phosphatase (ALP) activity (fluorescence-based). (a) Fluorescent substrate specific for ALP (b) Comparison of the fluorescent emission spectrum for buffer, substrate in buffer, and substrate in addition to enzyme (serum containing ALP) in buffer.
Next, we determined the activity of ALP within the 4 groups. The overall and gender-wise difference in ALP level (in terms of FI), irrespective of study groups as well as within study groups was also assessed. The density plot was presented to display the distribution of the levels of ALP in the study groups and is represented in Fig 3a. The findings indicated that data-points distribution between the ALP level (X-axis, Fig 3a) versus density were highly heterogeneous (bandwidth = 0.2). The density distribution graph of ALP levels (Fig. 3a) demonstrated where each group lay in comparison to the other groups in terms of samples above or below the overall distribution of values. Considering the differences in total samples per group, Group 1 appeared to be the most frequent group on the right side of the distribution (6 samples). Group 3 being the second most common group on the right side of the distribution (5 samples), followed by groups 2 and 4 (3 and 2, respectively). On the left side of the distribution, groups 2 and 4 were the most common (3 from both groups), followed by groups 1 and 3 as the least common (2 from both groups).
The distribution of ALP appeared higher in post-transplantation patients who required a kidney biopsy for cause compared to post-transplantation patients who did not require a biopsy, patients with CKD, and control individuals. The data indicated that the overall ALP level was about 20% higher in Group 1 patients compared to Group 2 patients (Fig 3b). Next, we compared the level of ALP within different groups of the patients. Box-plots were used to represent these data and are shown in Fig 3 b-c. The median (IQR) values and the statistical analysis values (p-values) of the ALP within the study groups and the test statistics are listed in Table 2. Data indicated that the level of ALP was highest for Group 1 and the lowest for the Group 4 (healthy individuals). There also appeared to be relatively little difference in ALP between males and females per each group, and the data also indicated that the serum level of ALP was lower in female patients (Fig 3c).
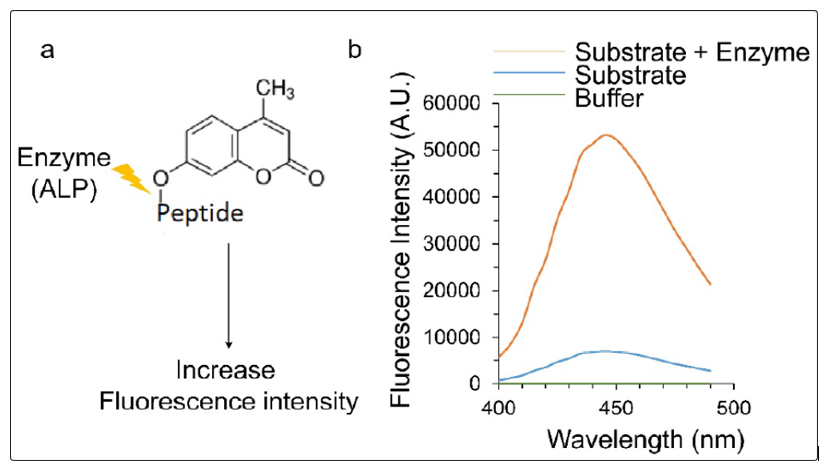
Figure 3: Density distribution of log2 Alkaline Phosphatase (ALP) values per individual and group. Distribution of serum ALP levels per group and gender. (b) Distribution of serum ALP per group. (c) Distribution of ALP in terms of the gender within differing groups. Overall distribution of serum ALP in males versus females. (d) The quantitative ALP level presented by Box & Whiskers plot showing the Median and 95% Confidence Interval for Groups 1 to 4 serum ALP data comparing gender. (e) Box & Whiskers plot showing the levels of ALP (Groups 1 to 4) and other liver function associated markers, Alanine Transaminase (ALT) and Aspartate Transaminase (AST), in the three different groups (Groups 1 to 3).
Correlations between ALP and Other Clinical Parameters Associated With Kidney Function
Association between levels of ALP and clinically important test variables (age, BMI, creatinine and eGFR) were computed using Pearson’s correlation coefficient (r). The values of ALP, creatinine, and eGFR were presented in Table 1d. The correlation between age and BMI with ALP levels was determined as well (Table 2b). Age appears to have a slightly positive correlation with ALP (r=0.179), with men having a stronger age-ALP correlation than women (r=0.224 versus r=0.038, respectively). BMI also has a slightly positive correlation with ALP (r=0.236), with women having a stronger BMI – ALP correlation than men (r=0.322 versus r=0.063, respectively).
The correlation between eGFR and creatinine with ALP was determined (Table 2b). The calculations were performed within the first three patient groups, i.e. Group 1, Group 2 and Group 3, which all have certain levels of kidney dysfunction. Serum alkaline phopshatase levels appeared to be relatively independent of eGFR and creatinine. The only slightly negative correlation appeared between the female eGFR and ALP (r=-0.127); however, the overall correlation between eGFR and ALP was relatively low (r=-0.060). As expected, a strong correlation was observed between eGFR and creatinine (r=-0.76). All probable correlation combinations between different clinical parameters were presented in Table 2b. Data indicated that correlation values were very low between ALP and eGFR, BMI, creatinine or age. The low correlation indicated ALP as an independent parameter, meaning that ALP is relatively unaffected by other individual-level variables such as age, gender, and BMI, which often influence the two tested parameters, creatinine and eGFR. This suggests that ALP alone could potentially predict the probable status of the kidney of interest.
Clinical Values of Different Liver Function Markers
Next, we have plotted (Fig. 3e) the values of liver function markers corresponding to different groups of patients. It is important to note that the clinical lab values of different liver function parameters only available for first three groups (Group 1, 2 and 3), whereas, the values for healthy individuals were missing (Group 4). The enzymatic activity values of ALP derived in this study were plotted in Fig 3d. The fluorescence based ALP activity calculation indicated that the Group 1 patients (patients with transplanted kidneys undergone kidney biopsy) having about 25% increase in activity compared with the Group 2 patients. The corresponding alanine transferase (ALT) and aspartate transferase (AST) liver function markers were also plotted in the same patient population (Fig.3e). The values of different markers associated with liver function were presented in the Table 2a. The data indicated that the bilirubin and AST has a higher values for the Group 1 patients.
Table 2: (a) The levels of different liver function related enzymatic markers. Table of Means and Standard deviations for Groups 1-3. Clinical Tests: Albumin, Aspartate Transaminase (AST), Alanine Transaminase (ALT), Bilirubin, Bilirubin Direct (bound with serum Albumin), and Total Protein. (b) The correlation coefficients (r-value) between ALP and different parameters of kidney function. Correlation table of ALP, Age, eGFR (estimated Glomerular Filtration Rate), BMI (Body Mass Index), and Creatinine. (c) Correlation values of Alkaline Phosphatase (ALP) and other liver function tests-Aspartate Transaminase (AST), Alanine Transaminase (ALT), Bilirubin Direct (bound with serum Albumin), and Total Protein.
|
a. Clinical Biomarker |
Group 1 |
Group 2 |
Group 3 |
|
|
|
|
Albumin (g/dL) |
4.238 ± 0.05 |
4.121 ± 0.07 |
3.932 ± 0.09 |
|
|
|
|
AST (IU/L) |
18.38 ±1.90 |
17.71 ± 1.14 |
18.53 ± 1.86 |
|
|
|
|
ALT (IU/L) |
23.38 ±5.21 |
23.42 ± 2.33 |
17.63 ± 1.79 |
|
|
|
|
Bilirubin (mg/dL) |
0.42 ± 0.04 |
0.37 ± 0.03 |
0.35 ± 0.04 |
|
|
|
|
Bilirubin Direct (mg/dL) |
0.20 ± 0.004 |
0.20 ± 0.001 |
0.19 ± 0.005 |
|
|
|
|
Total Protein (g/dL) |
6.7 ± 0.12 |
6.6 ± 0.12 |
6.6 ± 0.16 |
|
|
|
|
b. Correlation (Kidney Functions) |
ALP |
Age |
eGFR |
BMI |
Creatinine |
|
|
ALP |
|
0.179 |
-0.06 |
0.236 |
0.044 |
|
|
Age |
0.179 |
|
-0.281 |
0.036 |
0.191 |
|
|
eGFR |
-0.06 |
-0.281 |
|
-0.11 |
-0.776 |
|
|
BMI |
0.236 |
0.036 |
-0.112 |
|
0.051 |
|
|
Creatinine |
0.044 |
0.191 |
-0.776 |
0.051 |
|
|
|
c. Correlation (Liver Functions) |
Albumin |
ALP |
AST |
ALT |
Total Protein |
Bilirub Direct |
|
Albumin |
|
0.35 |
0.308 |
0.394 |
0.783 |
-0.666 |
|
ALP |
0.35 |
|
0.213 |
0.165 |
0.276 |
-0.296 |
|
AST |
0.308 |
0.213 |
|
0.792 |
0.432 |
-0.338 |
|
ALT |
0.394 |
0.165 |
0.792 |
|
0.629 |
-0.694 |
|
Total Protein |
0.783 |
0.276 |
0.432 |
0.629 |
|
-0.824 |
|
Bilirubin Direct |
-0.666 |
-0.296 |
-0.338 |
-0.69 |
-0.824 |
|
Cross-Talk between Kidney Allograft Dysfunction with ALP and Other Liver Function Markers
Although the main biomarker being examined is ALP, several other liver function test associated markers were evaluated and compared with ALP as a biomarker for kidney health. We hypothesized that the success of the kidney allograft also depends on liver function. ALP secreted from both liver and kidney, may play a critical role in determining the success of kidney transplantation. ALP is known to play role in heart transplantation failure 28. Liver function test biomarkers consisted of ALP, albumin, alanine-transaminase (ALT), aspartate transaminase (AST), and bilirubin (Table 2a). In addition, estimated eGFR and creatinine of each patient was also utilized in determining a biomarker for kidney health or kidney allograft rejection. The three dimensional (3D) data representation of eGFR (X-axis), ALP (Y-axis), and creatinine (Z-axis) in Fig.4. Data indicated that a heterogeneous distribution of the patient clusters which eventually represented a low correlation between these three parameters
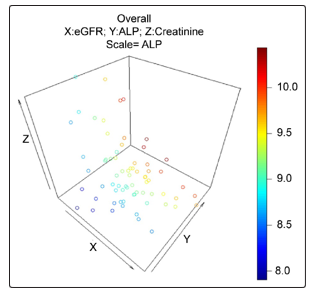
Figure 4: 3D correlation with estimated Glomerular Filtration Rate (eGFR), Creatinine, and Alkaline Phosphatase (ALP). Variation of ALP in terms of Creatinine and estimated eGFR.
The correlation between the clinically tested levels of common liver function test proteins were calculated and examined in order to determine any relationship between the differing biomarkers (Table 2c). Total protein and direct bilirubin has the highest correlation value (r=-0.824), followed by albumin and total protein correlation (r=0.783), followed by total protein and ALT (r=0.629), and then correlation between AST and total protein (r=0.432). However, with ALP and bilirubin direct had relatively strong negative correlation (r=-0.3), aspartate-transferase (r=0.213). The data indicated that the overall correlation coefficient values showed higher in between liver function markers including ALP within the kidney dysfunction study groups (Group 1, Group 2, and Group 3). It is important to mention that the within these three same study groups, the overall correlation values were comparatively low between kidney function markers and ALP (Table 2c).
Prediction of kidney transplant rejection with ALP, ALT, AST and other clinical values
Next, we compared our data with clinical outcomes related to rejection findings based on the allograft biopsy results and Group-1 and Group-2 individual patient data (Table 3). Rejection patients had lower ALP values (fluorescence intensities) when compared to the non-rejected (according to biopsy data; 20% lower ALP values in rejected patients) kidneys in the Group-1 patients. However, overall ALP values were higher (for both rejected, 10% elevated or non-rejected 40% higher) than in the Group-2 patients (Table 3, Median values). It is important to mention that the kidney rejected patients (n=6, based on biopsy report) have higher eGFR values (47.25) and low creatinine values (1.60) compared to its non-rejected kidneys in the same Group-1 patients (eGFR =37.1 and Creatinine =2.11). The eGFR and creatinine are the most acceptable kidney functionality markers, whereby, higher eGFR values are linked to healthy kidney, and creatinine values are inversely proportional to the healthy kidney. In contrast, the liver functions markers ALT (60%) and AST (40%) are higher in kidney rejected patients compared to the non-rejected patients in the same group (Group-1). These data indicated that the ALP along with level of liver function enzymes (ALT and AST) are better predictive markers in patients with kidney transplant rejection. It is also important to mention that the expression of ALT in different human tissues is more liver/kidney specific compared to ALP or AST in Fig 1.
Figure 4: correlation with estimated Glomerular Filtration Rate (eGFR), Creatinine, and Alkaline Phosphatase (ALP). Variation of ALP in terms of Creatinine and estimated eGFR.
|
ID#_Gr |
SEX |
Age |
Race |
BMI |
ALP (FI) |
ALT |
AST |
eGFR |
DM (Y/N) |
Crt |
BX Rejection |
|
991_1 |
M |
45 |
B |
29 |
621 |
133 |
53 |
71.5 |
N |
1.37 |
I & II |
|
742_1 |
F |
56 |
B |
33 |
239.5 |
13 |
28 |
35.5 |
N |
1.83 |
II |
|
130_1 |
F |
53 |
B |
36 |
530.5 |
18 |
19 |
59 |
Y |
1.25 |
II |
|
572_1 |
F |
24 |
B |
35 |
680 |
37 |
14 |
13.7 |
N |
4.78 |
II |
|
907_1 |
M |
61 |
W |
35 |
617.5 |
10 |
11 |
34.2 |
Y |
2.04 |
II |
|
881_1 |
F |
61 |
B |
29 |
600.5 |
54 |
27 |
63.3 |
N |
1.09 |
I |
|
Gr_1 n=6 |
2M:4 F |
54.5 |
5B:1 W |
34 |
609 |
27.5 |
23.0 |
47.25 |
1:05 |
1.60 |
Rejection |
|
Gr_1 n=19 |
14M: 5F |
56.0 |
13B: 4W:2 H |
32 |
773.5 |
17 |
15.0 |
37.1 |
6Y: 13N |
2.11 |
Normal |
|
Gr_2 n=25 |
15M: 10F |
56 |
14B: 7W:4 H |
30 |
550 |
20 |
16.5 |
57.3 |
10Y: 15N |
1.27 |
Stable Transpt. |
Discussion
Previous studies have suggested that ALP is associated with all-cause mortality and vascular calcification in CKD and ESRD [20-25, 29, 30]. High pre-ESRD ALP levels were independently associated with higher post-ESRD mortality risk [30], as well as post renal transplant all-cause cardiovascular death [25]. In the present study, we examined the relationship between ALP and kidney allograft dysfunction in transplant patients who required a kidney biopsy, stable transplant patients, non-transplant CKD patients, and control individuals. Our data supported prior-studies that described the correlation of high ALP levels with poor kidney health. The data presented herein also suggests that ALP could be a prognostic biomarker for kidney allograft rejection.
In addition to being a prognostic biomarker for kidney allograft rejection, ALP may also be a contributing factor to kidney failure, cardiovascular-related diseases and mortality [13, 17, 18]. In the blood, tissue-nonspecific ALP hydrolyzes pyrophosphate, an inhibitor of calcification, which in turn leads to excessive vascular calcification [19, 31-33]. In support of this hypothesis, in a previous study, after examining biomarkers of nutrition, inflammation, and bone and mineral disorders, high ALP was shown to be independently associated with coronary artery calcification (CAC) in maintenance hemodialysis (MHD) patients [24]. Furthermore, vascular calcification has been shown to be a pivotal component in cardiovascular-related diseases in patients suffering from CKD [33]. Over the course of 24 months, over half of patients with stage 4 or 5 CKD saw rapid progression of vascular which was associated with an incremental increase in arterial stiffness [30]. Interestingly, out of the 134 patients from the study, 20 out of 21 who died had vascular calcification, which stresses the importance of the relationship between ALP and vascular calcification in patients suffering from CKD [34, 35]. It is possible and some data suggested that kidney allograft rejection is associated with calcification [36-38], which is probably regulated by this elevated level of ALP. Moreover, increased ALP have also been associated with inflammation in CKD through a correlation with C-reactive protein, which could also contribute to ALP’s role in kidney health deterioration [39].
One theory for the origin of the increased ALP postulates that vascular smooth muscle (VSMC) cells may be transformed into osteoblastic cells, which then produce and secrete ALP in the blood [17]. While the theory of VSMC transformation into osteoblasts may not be accurate, later research has demonstrated that VSMC Trans-differentiate into calcifying vascular smooth muscle cells (C-VSMCs) under osteoblastic-stimuli [31]. C-VSMCs cells were shown to keep their identity as VSMC while simultaneously mimicking the same mechanisms that osteoblasts use to bio-mineralize, thus giving C-VSMCs the ability to cause vascular calcification [31]. The data from this current study demonstrated that liver function may be playing a role in kidney rejection occurrence. In the Group-1 patients, where the biopsies were performed, patients with allograft dysfunction (n=6), had higher level ALT and AST values compared to negative outcome patients (Table 3). However, ALP values were low for positive biopsy outcomes. Allograft dysfunction may inhibit kidney associated ALP secretion. ALP secretion is strongly associated with age. The average age of the rejected patients in this study is less than that non-rejected patients of same Group-1.
Our pilot-study has some limitations; small sample size (n=100) and the lack of frequent, long-term blood draws. Almost all patients with allograft rejection in this study had antibody-mediated rejection (n=5). Additional larger studies will be needed to better characterize these findings, however, our results provide evidence that ALP and liver function may play a role in the diagnosis of kidney allograft dysfunction and possibly rejection as well. Lastly, the patients are prescribed immunosuppressive agents which may increase their susceptibility to infections or increase their liver activity.
Conclusions
The liver ALP and other liver function enzymes are elevated in many different organ transplant rejections and/or failure. However, there is limited data available for ALP with regards to the kidney transplant rejection. In this current study, we sequentially and logically designed the study and measured the ALP and other liver function activities and correlated with different kidney function parameters. The findings indicated that ALP might be a putative biomarker to predict kidney allograft dysfunction and eventual rejection. Data also showed that liver function parameters play an essential role in the overall success of kidney transplantation.
Acknowledgement
This work was supported by the USUHS seed grant to Dr. Rahul M. Jindal. The work supported by the grant to Dr. Meera Srivastava (DoD, DAMD17-03-1-0107). The work was also supported by the Collaborative Health Initiative Research Program (CHIRP) funding (CHIRP ID# IAA-A-HL-14-007). The authors would also like to thanks Dr. Dustin J. Little for his critical comments and initial efforts for IRB approval and patient recruitment.
References
- Johns T, Jaar BG (2013) U.S. Centers for Disease Control and Prevention launches new chronic kidney disease surveillance system website. BMC Nephrol 14:196.
- Dharmarajan SH, Bragg-Gresham JL, Morgenstern H, Gillespie BW, Li Y, et al. (2017) State-Level Awareness of Chronic Kidney Disease in the U.S. Am J Prev Med 53: 300-307.
- Yarnoff BO, Hoerger TJ, Simpson SK, Leib A, Burrows NR, et al. (2017) The cost-effectiveness of using chronic kidney disease risk scores to screen for early-stage chronic kidney disease. BMC Nephrol 18: 85.
- Ghods AJ (2010) Living kidney donation: the outcomes for donors. Int J Organ Transplant Med 1: 63-71.
- Badve SV, Zhang L, Coombes JS, Pascoe EM, Cass A, et al. (2015) Association between serum alkaline phosphatase and primary resistance to erythropoiesis stimulating agents in chronic kidney disease: a secondary analysis of the HERO trial. Can J Kidney Health Dis 2: 33.
- Prakash S, Patel MR, Agrawal S, Jindal RM, Prasad N, et al. (2018) Vascular Endothelial Growth Factor Gene Polymorphism Is Associated With Long-term Kidney Allograft Outcomes. Kidney Int Rep 3: 321-327.
- Sharma U, Pal D, Prasad R (2014) Alkaline phosphatase: an overview. Indian J Clin Biochem 29: 269-278.
- Narayanan S (1991) Serum alkaline phosphatase isoenzymes as markers of liver disease. Ann Clin Lab Sci 21: 12-18.
- Brun-Heath I, Taillandier A, Serre JL, Mornet E (2005) Characterization of 11 novel mutations in the tissue non-specific alkaline phosphatase gene responsible for hypophosphatasia and genotype-phenotype correlations. Mol Genet Metab 84: 273-277.
- Mornet E, Stura E, Lia-Baldini AS, Stigbrand T, Menez A, et al. (2001) Structural evidence for a functional role of human tissue nonspecific alkaline phosphatase in bone mineralization. J Biol Chem 276: 31171-31178.
- Taillandier A, Lia-Baldini AS, Mouchard M, Robin B, Muller F, et al. (2001) Twelve novel mutations in the tissue-nonspecific alkaline phosphatase gene (ALPL) in patients with various forms of hypophosphatasia. Hum Mutat 18: 83-84.
- Millan JL (2006) Alkaline Phosphatases : Structure, substrate specificity and functional relatedness to other members of a large superfamily of enzymes. Purinergic Signal 2: 335-341.
- Wannamethee SG, Sattar N, Papcosta O, Lennon L, Whincup PH, et al. (2013) Alkaline phosphatase, serum phosphate, and incident cardiovascular disease and total mortality in older men. Arterioscler Thromb Vasc Biol 33: 1070-1076.
- Jain A, Sahota A, Alshak NS, Tung JK (2009) An unusual cause of elevated values on liver function tests in a liver transplant patient. Perm J 13: 58-60.
- Woo YS, Lee KH, Lee KT, Lee JK, Kim JM, et al. (2017) Postoperative changes of liver enzymes can distinguish between biliary stricture and graft rejection after living donor liver transplantation: A longitudinal study. Medicine (Baltimore) 96: e6892.
- Ndrepepa G, Xhepa E, Braun S, Cassese S, Fusaro M, et al. (2017) Alkaline phosphatase and prognosis in patients with coronary artery disease. Eur J Clin Invest 47: 378-387.
- Tonelli M, Curhan G, Pfeffer M, Sacks F, Thadhani R, et al. (2009) Relation between alkaline phosphatase, serum phosphate, and all-cause or cardiovascular mortality. Circulation 120: 1784-1792.
- Abramowitz M, Muntner P, Coco M, William Southern (2010) Serum alkaline phosphatase and phosphate and risk of mortality and hospitalization. Clin J Am Soc Nephrol 5: 1064-1071.
- Ishimura E, Okuno S, Okazaki H, Norimine K, Yamakawa K, et al. (2014) Significant association between bone-specific alkaline phosphatase and vascular calcification of the hand arteries in male hemodialysis patients. Kidney Blood Press Res 39: 299-307.
- Fan Y, Jin X, Jiang M, Fang N (2017) Elevated serum alkaline phosphatase and cardiovascular or all-cause mortality risk in dialysis patients: A meta-analysis. Sci Rep 7: 13224.
- Liu CT, Lin YC, Lin YC, Kao CC, Chen HH, et al. (2017) Roles of Serum Calcium, Phosphorus, PTH and ALP on Mortality in Peritoneal Dialysis Patients: A Nationwide, Population-based Longitudinal Study Using TWRDS 2005-2012. Sci Rep 7: 33.
- Regidor DL, Kovesdy CP, Mehrotra R, Mehdi Rambod, Jennie Jing, et al. (2008) Serum alkaline phosphatase predicts mortality among maintenance hemodialysis patients. J Am Soc Nephrol 19: 2193-2203.
- Rhee CM, Molnar MZ, Lau WL, Ravel V, Kovesdy CP, et al. (2014) Comparative mortality-predictability using alkaline phosphatase and parathyroid hormone in patients on peritoneal dialysis and hemodialysis. Perit Dial Int 34: 732-748.
- Shantouf R, Kovesdy CP, Kim Y, Ahmadi N, Luna A, et al. (2009) Association of serum alkaline phosphatase with coronary artery calcification in maintenance hemodialysis patients. Clin J Am Soc Nephrol 4: 1106-1114.
- Molnar MZ, Kovesdy CP, Mucsi I, Salusky IB, Kalantar-Zadeh K, et al. (2012) Association of pre-kidney transplant markers of mineral and bone disorder with post-transplant outcomes. Clin J Am Soc Nephrol 7: 1859-1871.
- Cheung BM, Ong KL, Cheung RV, Wong LY, Wat NM, et al. (2008) Association between plasma alkaline phosphatase and C-reactive protein in Hong Kong Chinese. Clin Chem Lab Med 46: 523-527.
- Kerner A, Avizohar O, Sella R, Peter Bartha, Oren Zinder, et al. (2005) Association between elevated liver enzymes and C-reactive protein: possible hepatic contribution to systemic inflammation in the metabolic syndrome. Arterioscler Thromb Vasc Biol 25: 193-197.
- Shamban L, Patel B, Williams M (2014) Significantly Elevated Liver Alkaline Phosphatase in Congestive Heart Failure. Gastroenterology Res 7: 64-68.
- Sumida K, Molnar MZ, Potukuchi PK, Thomas F, Lu JL, et al. Prognostic significance of pre-end-stage renal disease serum alkaline phosphatase for post-end-stage renal disease mortality in late-stage chronic kidney disease patients transitioning to dialysis. Nephrol Dial Transplant. 2018;33:264-273.
- Taliercio JJ, Schold JD, Simon JF, Arrigain S, Tang A, et al. (2013) Prognostic importance of serum alkaline phosphatase in CKD stages 3-4 in a clinical population. Am J Kidney Dis 62: 703-710.
- Alves RDAM, Eijken M, van de Peppel J, van Leeuwen JP (2014) Calcifying vascular smooth muscle cells and osteoblasts: independent cell types exhibiting extracellular matrix and biomineralization-related mimicries. BMC Genomics 15: 965.
- Ciancaglini P, Simao AM, Camolezi FL, Millan JL, Pizauro JM, et al. (2006) Contribution of matrix vesicles and alkaline phosphatase to ectopic bone formation. Braz J Med Biol Res 39: 603-610.
- Sigrist MK, Taal MW, Bungay P, McIntyre CW (2007) Progressive vascular calcification over 2 years is associated with arterial stiffening and increased mortality in patients with stages 4 and 5 chronic kidney disease. Clin J Am Soc Nephrol 2: 1241-1248.
- Mizobuchi M, Ogata H, Koiwa F, Kinugasa E, Akizawa T, et al. (2009) Vitamin D and vascular calcification in chronic kidney disease. Bone 45: 26-29.
- Mizobuchi M, Towler D, Slatopolsky E (2009) Vascular calcification: the killer of patients with chronic kidney disease. J Am Soc Nephrol 20: 1453-1464.
- Daly BD, Goldberg PA, Krebs TL, Wong-You-Cheong JJ, Drachenberg CI, et al. (1997) End stage renal transplant failure: allograft appearances on CT. Clin Radiol 52: 849-853.
- Keyzer CA, de Borst MH, van den Berg E, Jahnen-Dechent W, Arampatzis S, et al. (2016) Calcification Propensity and Survival among Renal Transplant Recipients. J Am Soc Nephrol 27: 239-248.
- Peces R, Sanchez RJ, Fernandez EJ, Peces C (2007) Calcificationin nonfunctioning transplanted kidneys. Nefrologia 27: 217-220.
- Damera S, Raphael KL, Baird BC, Cheung AK, Greene T, et al. (2011) Serum alkaline phosphatase levels associate with elevated serum C-reactive protein in chronic kidney disease. Kidney Int 79: 228-233.