


Research Article - (2016) Volume 1, Issue 1
Left Ventricular Diastolic Dysfunction Detected By Speckle Tracking In Hypertensive Patients with Preserved Ejection Fraction
Received Date: Nov 07, 2016 / Accepted Date: Nov 22, 2016 / Published Date: Nov 26, 2016
Copyright: ©Hosam HKA, et al. This is an open-access article distributed under the terms of the Creative Commons Attribution License, which permits unrestricted use, distribution, and reproduction in any medium, provided the original author and source are credited.
Abstract
Objectives: To detect early diastolic dysfunction in the left ventricle in hypertensive patients with preserved ejection fraction using 2D speckle tracking echocardiography.
Methods: This is a prospective study that was carried on (30) hypertensive patients referred to Al Azhar university hospital outpatient clinic for evaluation and treatment of hypertension and (20) age and sex matched healthy volunteers as a control group. All subjects underwent convential echocardiographic examination and Assesment of diastolic dysfunction by speckle tracking.
Conclusion: Impairment of diastolic function detected by speckle tracking in hypertensive patients (with and without LVH).
Keywords
Hypertension, Speckle tracking, Echocardiography
Introduction
Hypertension is a well-recognized risk factor for cardiovascular disease and a major contributor to a large percentage of heart failure cases as it causes left ventricular (LV) systolic pressure overload due to an increase in peripheral vascular resistance which results in various LV geometric changes that progresses to diastolic heart failure and/or heart failure with LV systolic dysfunction [1]. Early detection of LV dysfunction before the development of LVH may represent a clinical finding that would justify aggressive treatment aimed at reducing cardiovascular morbidity and mortality; it has to be considered in the assessment of global cardiovascular risk [2].
Advances in echocardiography over the last ten years have provided new methods of analysis particularly analysis of myocardial strain by speckle tracking which enables quantitative assessment of LV function with high level of diagnostic accuracy [3]. This technique can be used to study myocardial strain in all its dimensions longitudinal, circumferential, transversal, radial and twist. Strain analysis may detect subclinical cardiac involvement in hypertensive and thus identify asymptomatic patients at higher risk of developing adverse changes [4].
The Aim of The Study
To detect early diastolic dysfunction in the left ventricle in hypertensive patients with preserved ejection fraction using 2D speckle tracking echocardiography.
Patients and Methods
Study design
This is a prospective study that was carried from April 2015 to July 2016 on (30) hypertensive patients referred to Al Azhar university hospital outpatient clinic for evaluation and treatment of hypertension and (20) age and sex matched healthy volunteers as a control group. They were enrolled in the study after obtaining their written informed consent. Diagnosis of hypertension was based on ESH/ESC guidelines for management of hypertension if SBP P 140 mmHg and/or DBPP 90 mmHg on two or more hospital visits at one week interval [5].
The study population was divided into three groups:
Group I (Control Group): Included 20 normotensive healthy age and sex matched volunteers free from cardiovascular risk factors.
Group II: Included 15 hypertensive patients without echocardiographic criteria of LVH.
Group III: Included 15 hypertensive patients with echocardiographic criteria of LVH.
Exclusion criteria
It included patients with ejection fraction <50% or with symptoms or sign of heart failure, diabetes mellitus, patients with known coronary artery disease, patients with significant valvular disease and patients with atrial fibrillation or other rhythm disturbances.
Methods
The following data were collected:
• Complete and detailed medical History: With attention to Hypertension, DM and family history of premature coronary artery disease.
• Full clinical examination including body surface area [6], heart rate, rhythm, systolic, diastolic blood pressure, heart, and chest auscultation.
• Assessment of LV functions by conventional echocardiography.
Systolic function assessment
Measurement of LV ejection fraction (EF %) and LV fractional shortening (FS %) was performed to evaluate LV systolic function. By 2D echo, The LVEDV and LVESV were calculated from the apical 2-and 4-chamber views using a modified biplane Simpson’s method. Ejection fraction (EF %) was calculated as percentage change of LV chamber volumes between diastole and systole. The LV ejection fraction (EF %) was automatically calculated as follows [7] : (EF %) = (EDV−ESV)/EDV×100.
Diastolic Function assessment
Pulsed wave Doppler (PW) echocardiography was used to evaluate LV diastolic function; Doppler studies were recorded from apical 4-chamber view, with a sample volume positioned within the inflow portion of the LV, midway between the annular margins of mitral valve.
4-Two-dimensional speckle tracking echocardiography (2D STE)
Longitudinal strain rate was assessed in the 6 LV walls and the software algorithm automatically segmented the LV into 18 equidistant segments and each segment was individually analyzed. The average value of peak early diastolic SR (SRe s-1), peak late diastolic SR (SRa s-1) at each segment (basal, mid and apical) and global LV diastolic SR obtained from averaging the peak values of 18 LV segments were calculated and used for comparisons between control and hypertensive groups . All variables in this study represent the mean value of measurements taken in 3 consecutive cardiac cycles.
Statistical analysis
Data management and analysis were performed using SPSS program; version 17. The numerical data were statistically presented in terms of mean and standard deviation. Categorical data were summarized as percentages. Comparisons between numerical variables were done by unpaired Student’s t-test. Comparing categorical variables were done by Chi-square test or Fisher exact test for small sample size. A probability value p<0.05 was considered statistically significant, a P value <0.001 was considered highly significant and P value >0.05 was considered non-significant.
Results
Clinical, demographic and electrocardiographic characteristic
In the present study, there were no significant differences between the three groups as regards age and sex by inclusion criteria (Tables 1 and 2).
|
Data |
Group I (Control) |
Group II (No LVH) |
Group III (with LVH) |
ANOVA |
Tukey's test |
|||
|
Mean ± SD |
Mean ± SD |
Mean ± SD |
F |
P- Value |
P1 |
P2 |
P3 |
|
|
Age |
50.5 ± 6.0 |
51.6 ± 5.1 |
52.2 ± 6.0 |
6.138 |
0.130 |
0.29 |
0.36 |
0.12 |
Table 1: Comparison between three groups was according to Age.
|
Sex |
Groups |
Chi-square |
|||||
|
Group I (control) N =20 |
Group II (No LVH) N =40 |
|
|
|
|
||
|
Female |
N (%) |
12 (60%) |
9 (60%) |
8 |
29 |
|
|
|
(53.3%) |
(58%) |
1.515 |
0.469 |
||||
|
Male |
N (%) |
8 (40%) |
6 (40%) |
7 |
21 |
||
|
(46.6%) |
(42%) |
|
|
||||
Table 2: Comparison between three groups was according to Gender.
Conventional echocardiography
Left ventricular posterior wall thickness (PWd), LA dimensions, interventricular septal thickness (IVSd), left ventricular mass (LVM) and left ventricular mass index (LVMI) were higher in hypertensive patients with LVH (group III) than hypertensive patients without LVH (group II) and the control group (group I), while E/A ratio was lower in hypertensive patients (groups II and III) than in the control group (group I) (Tables 3 and 4).
2D-speckle tracking imaging
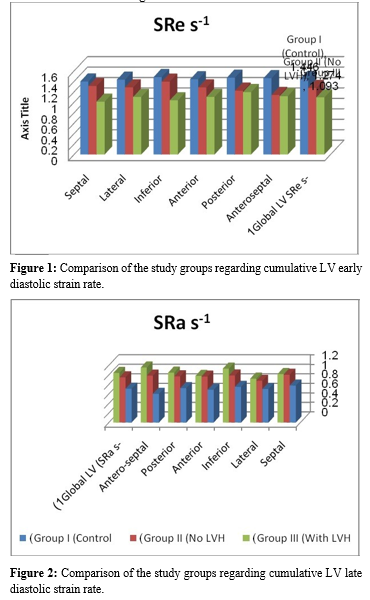
There was a stepwise reductin in the global early diastolic strain rate (SRe s_1) from group I (control) to group II (HTN without LVH) to group III (HTN with LVH) (Table 5) and Figure 1.
|
|
Group I (Control) |
Group II (No LVH) |
Group III (With LVH) |
ANOVA |
Tukey’s test |
|||
|
Mean ± SD |
Mean ± SD |
Mean ± SD |
F |
P-value |
P1 |
P2 |
P3 |
|
|
FS% |
36.30 ± 3.326 |
36.60 ±3.185 |
37.73 ± 3.588 |
1.629 |
0.201 |
0.301 |
0.944 |
0.277 |
|
EF% |
65.60 ± 4.547 |
66.23 ± 4.022 |
67.58 ± 4.437 |
1.719 |
0.185 |
0.342 |
0.856 |
0.219 |
|
PWD (cm) |
0.88 ± 0.120 |
0.93 ± 0.159 |
1.16 ± 0.087 |
46.675 |
0.0001 |
0.0001 |
0.323 |
0.0001 |
|
LVESD (cm) |
3.02 ± 0.324 |
2.95 ± 0.272 |
3.130± 0.465 |
2.387 |
0.097 |
0.081 |
0.770 |
0.526 |
|
LVEDD (cm) |
4.80 ± 0.494 |
4.55 ± 0.666 |
5.03 ± 0.328 |
8.544 |
0.0001 |
0.0001 |
0.208 |
0.222 |
|
IVSD (cm) |
0.90 ± 0.123 |
1.00 ± 0.339 |
1.25 ± 0.085 |
19.810 |
0.0001 |
0.0001 |
0.218 |
0.0001 |
Table 3: Comparison between three groups according to Echocardiographic parameters.
|
|
Group I |
Group II |
Group III |
ANOVA |
Tukey’s test |
|||
|
|
Mean ± SD |
Mean ± SD |
Mean ± SD |
F |
P- value |
P1 |
P2 |
P3 |
|
E (m/s) |
0.90 ± 0.20 |
0.70 ± 0.15 |
0.78 ± 0.16 |
8.950 |
0.0001 |
0.047 |
0.001 |
0.0001 |
|
A (m/s) |
0.67 ± 0.19 |
0.91 ± 0.14 |
0.80 ± 0.19 |
3.636 |
0.030 |
0.048 |
0.037 |
0.025 |
Table 4: Comparison between three groups according to E & A measurements.
|
|
Group I |
Group II |
Group III |
ANOVA |
Tukey’s test |
|||
|
|
(Control) Mean ± SD |
(No LVH) Mean ± SD |
(With LVH) Mean ± SD |
F |
P-value |
P1 |
P2 |
P3 |
|
Apical Septal |
1.711 ± 0.436 |
1.709 ± 0.541 |
1.139 ± 0.620 |
12.588 |
0.0001 |
0.0001 |
0.720 |
0.001 |
|
Mid Septal |
1.418 ± 0.387 |
1.161 ± 0.431 |
0.942 ± 0.310 |
10.880 |
0.0001 |
0.030 |
0.039 |
0.0001 |
|
Basal Septal |
1.057 ± 0.324 |
1.062 ± 0.446 |
0.950 ± 0.313 |
1.048 |
0.355 |
0.376 |
0.999 |
0.550 |
|
Basal Lateral |
1.345 ± 0.576 |
1.392 ± 0.494 |
1.074 ± 0.464 |
4.450 |
0.014 |
0.015 |
0.936 |
0.123 |
|
Mid Lateral |
1.217 ± 0.416 |
1.055 ± 0.366 |
0.996 ± 0.334 |
2.479 |
0.089 |
0.752 |
0.238 |
0.073 |
|
Apical Lateral |
1.730 ± 0.344 |
1.409 ± 0.562 |
1.232 ± 0.493 |
6.665 |
0.002 |
0.257 |
0.053 |
0.001 |
|
Apical Inferior |
1.578 ± 0.312 |
1.636 ± 0.573 |
1.103 ± 0.500 |
12.681 |
0.0001 |
0.0001 |
0.906 |
0.002 |
|
Mid Inferior |
1.355 ± 0.252 |
1.162 ± 0.390 |
0.964 ± 0.392 |
7.906 |
0.001 |
0.048 |
0.140 |
0.001 |
|
Basal Inferior |
1.510 ± 0.452 |
1.388 ± 0.530 |
1.043 ± 0.533 |
7.037 |
0.001 |
0.010 |
0.666 |
0.004 |
|
Basal Anterior |
1.500 ± 0.501 |
1.164± 0.506 |
1.122 ± 0.336 |
5.254 |
0.007 |
0.904 |
0.019 |
0.007 |
|
Mid Anterior |
1.423 ± 0.264 |
1.128± 0.431 |
1.049 ± 0.227 |
8.790 |
0.0001 |
0.538 |
0.005 |
0.0001 |
|
Apical Anterior |
1.399 ± 0.354 |
1.559± 0.594 |
1.134 ± 0.379 |
8.168 |
0.001 |
0.0001 |
0.437 |
0.106 |
|
Apical Posterior |
1.652 ± 0.581 |
1.229± 0.660 |
1.202 ± 0.488 |
4.531 |
0.013 |
0.977 |
0.025 |
0.016 |
|
Mid Posterior |
1.491 ± 0.337 |
1.088± 0.509 |
1.131 ± 0.216 |
8.144 |
0.001 |
0.869 |
0.001 |
0.002 |
|
Basal Posterior |
1.262 ± 0.252 |
1.345± 0.663 |
1.248 ± 0.429 |
0.393 |
0.676 |
0.676 |
0.826 |
0.994 |
|
Basal Anteroseptal |
1.320 ± 0.443 |
1.011± 0.483 |
0.950 ± 0.331 |
5.452 |
0.006 |
0.790 |
0.023 |
0.005 |
|
Mid Anteroseptal |
1.396 ± 0.423 |
1.114± 0.618 |
1.091 ± 0.370 |
2.836 |
0.064 |
0.976 |
0.099 |
0.068 |
|
Apical Anteseptal |
1.665 ± 0.515 |
1.296± 0.653 |
1.307 ± 0.536 |
3.119 |
0.049 |
0.996 |
0.059 |
0.069 |
Table 5: Comparison of the study groups regarding LV early diastolic strain rate of all analyzed segments. P2 = Between group I & II, P3 = Between
group I & III, P value > 0.05 = Highly significant.
|
|
Group I |
Group II |
Group III |
ANOVA |
Tukey’s test |
|||
|
|
(Control) Mean ± SD |
(No LVH) Mean ± SD |
(With LVH) Mean ± SD |
F |
P-value |
P1 |
P2 |
P3 |
|
Apical Septal |
0.787 ± 0.448 |
1.052± 0.338 |
1.111± 0.472 |
4.172 |
0.018 |
0.799 |
0.059 |
0.015 |
|
Mid Septal |
0.731 ± 0.267 |
0.973 ± 0.294 |
0.997± 0.174 |
8.579 |
0.0001 |
0.907 |
0.002 |
0.0001 |
|
Basal Septal |
0.814 ± 0.407 |
0.964 ± 0.329 |
0.974± 0.293 |
1.747 |
0.180 |
0.990 |
0.190 |
0.231 |
|
Basal Lateral |
0.738 ± 0.234 |
0.909 ± 0.416 |
0.969± 0.518 |
1.907 |
0.154 |
0.809 |
0.326 |
0.132 |
|
Mid Lateral |
0.698 ± 0.347 |
0.707 ± 0.359 |
0.787± 0.281 |
0.830 |
0.439 |
0.449 |
0.646 |
0.995 |
|
Apical Lateral |
0.673 ± 0.489 |
1.011± 0.469 |
1.025± 0.487 |
4.141 |
0.019 |
0.990 |
0.031 |
0.023 |
|
Apical Inferior |
0.876 ± 0.224 |
0.956 ± 0.435 |
1.165± 0.386 |
4.838 |
0.010 |
0.043 |
0.726 |
0.019 |
|
Mid Inferior |
0.780 ± 0.194 |
0.850 ± 0.308 |
1.073± 0.356 |
7.926 |
0.001 |
0.005 |
0.686 |
0.002 |
|
Basal Inferior |
0.654 ± 0.271 |
0.859 ± 0.391 |
1.058± 0.376 |
14.32 |
0.0001 |
0.105 |
0.0001 |
0.0001 |
|
Basal Anterior |
0.864 ± 0.455 |
1.030 ± 0.458 |
1.087± 0.399 |
1.782 |
0.174 |
0.825 |
0.151 |
0.348 |
|
Mid Anterior |
0.620 ± 0.133 |
0.854 ± 0.352 |
0.902± 0.225 |
7.559 |
0.001 |
0.709 |
0.006 |
0.001 |
|
Apical Anterior |
0.579 ± 0.228 |
0.960 ± 0.547 |
0.997± 0.344 |
7.258 |
0.001 |
0.918 |
0.001 |
0.004 |
|
Apical Posterior |
0.660 ± 0.385 |
1.059 ± 0.427 |
1.145 ±0.511 |
7.919 |
0.001 |
0.673 |
0.001 |
0.005 |
|
Mid Posterior |
0.737 ± 0.449 |
0.900 ± 0.307 |
0.930± 0.289 |
2.354 |
0.100 |
0.914 |
0.093 |
0.181 |
|
Basal Posterior |
0.769 ± 0.461 |
953 ± 0.517 |
1.064± 0.471 |
2.443 |
0.092 |
0.569 |
0.075 |
0.356 |
|
Basal AnteroSeptal |
0.714 ± 0.351 |
1.207 ± 0.385 |
0.994± 0.348 |
12.46 |
0.0001 |
0.027 |
0.0001 |
0.016 |
|
Mid AnteroSeptal |
0.584 ± 0.324 |
0.935 ± 0.373 |
1.085± 0.345 |
13.45 |
0.0001 |
0.143 |
0.001 |
0.0001 |
|
Apical AnteroSeptal |
0.512 ± 0.334 |
1.030± 0.492 |
1.157± 0.490 |
13.88 |
0.0001 |
0.348 |
0.0001 |
0.0001 |
Table 6: Comparison of the study groups regarding LV early diastolic strain rate of all analyzed segments. P1= Between group II & III, P2= Be- tween group I & II, > 0.05 = Insignificant, P < 0.05 = Significant, P < 0.001 = Highly significant.
On the other hand, the global late diastolic strain rate SRa s_1 was significantly increased in both group II (HTN without LVH) and group III (HTN with LVH) when compared to group I (control) as shown in Table 6 and Figure 2.
Discussion
Strain (ε) is a measure of tissue deformation. As the ventricle contracts, muscle shortens in longitudinal and circumferential dimensions (a negative strain) and thickens or lengthens in radial direction (a positive strain). Strain rate (SR) is the local rate of deformation that measures the time course of deformation or strain per unit time [8].
In contrast to TDI, speckle tracking echocardiography is an angle- independent technique that allows an accurate assessment of segmental myocardial deformation by grey-scale based imaging analysis frame by frame. Moreover, the lack of angle-dependency is of great advantage as myocardial strain (ε) could be tracked in two dimensional echo imaging along the direction of the wall and not along the ultrasound beam [9].
The present study was designed to evaluate LV diastolic functions in hypertensive patients using 2D-speckle tracking echocardiography based longitudinal strain rate.
Regarding LV diastolic function assessed by conventional pulsed wave Doppler
The findings of the present study demonstrated significant impairment of LV diastolic function in hypertensive patients when compared with control group, as shown by inversion of the E/A ratio, in hypertensive patients with and without LVH, and it was more evident in hypertensive patients with LVH (group III).
The high prevalence of diastolic impairment among hypertensive patients may be attributed to LV thickening and the ultimate myocardial fibrosis with progression of the disease. This was explained by Cuocolo, et al. who demonstrated that, LV relaxation is impaired in subjects with LVH arising from chronic pressure overload owing to increased myocardial mass and resultant increase in interstitial connective tissue leading to increased LV stiffness [10].
This goes in harmony with the findings of Zabalgoitia, who investigated 665 hypertensive patients; 62% of them had LVH, by conventional echocardiography to evaluate mitral flow patterns and its relationship to LV systolic and diastolic functions and found that the inversion of the E/A ratio was the most prevalent pattern (79%) [11].
This was also supported by M. Dekleva, et al. who studied 30 hypertensive patients and demonstrated that all patients had preserved systolic function but impaired LV relaxation [12]. This was further explained by López, et al. who stated that, serological evidence of myocardial fibrosis in hypertensive heart disease (HHD) was demonstrated by experimental and clinical data and directly linked to abnormalities in diastolic function and myocardial stiffness [13].
Regarding LV diastolic function assessed by diastolic strain rate The present study showed that the strain rate value was significantly reduced in both hypertensive patients with and without LVH in early diastole (at peak E) and in late diastole (at peak A) in comparison to control group. This goes with the results of Mu, et al. who studied 75 hypertensive patients with normal left ventricular geometry and 50 healthy persons and found that; early diastolic E′ peak value, late diastolic. A′ peak value and E′/A′ ratio of LV longitudinal strain rate, radial strain rate and circumferential strain rate were reduced in hypertensive patients compared with normal group [14].
This was in agreement with Goebel, et al. who found that, systolic strain rate and early diastolic strain rate quantified in longitudinal and circumferential directions were lower in hypertensive patients with LVH compared with those without LVH [15]. In addition, systolic twist rate and diastolic untwist rate were significantly lower in this patient group. They concluded that, LVH in hypertensive patients predominantly affected longitudinal and circumferential deformation rate.
Huang Chun Yan studied 88 patients with essential hypertension in comparison to 30 normotensive ages and gender matched healthy volunteers served as controls. His Analysis showed that the early diastolic longitudinal strain rate and circumferential strain rate were lower in the essential hypertension group than normal controls. Hence, it was concluded that, speckle tracking imaging may be helpful for early detection of subclinical changes in LV diastolic function in patients with hypertension.
References
- Cameli M, Lisi M, Righini FM, Massoni A, Mondillo S (2013) Left ventricular remodeling and torsion dynamics in hypertensive patients. Int J Cardiovasc Imaging 29: 79-86.
- Conen D, Pfisterer M, Martina B (2006) Substantial intraindividual variability of BNP concentrations in patients with hypertension. J Hum Hypertens 20: 387-391.
- van Dalen BM, Soliman OI, Vletter WB, Kauer F, van der Zwaan HB, et al. (2009) Feasibility and reproducibility of left ventricular rotation parameters measured by speckle tracking echocardiography. Eur J Echocardiogr 10: 669-676.
- Geyer H, Caracciolo G, Abe H, Wilansky S, Carerj S, et al. (2010) Assessment of myocardial mechanics using speckle tracking echocardiography: fundamentals and clinical applications. J Am Soc Echocardiogr 23: 351-369.
- Mancia G, Fagard R, Narkiewicz K, Redo´n J, Zanchetti A, et al. (2013) ESH/ESC guidelines for the management of arterial hypertension. The task force for the management of arterial hypertension of the European Society of Hypertension (ESH) and of the European Society of Cardiology (ESC). J Hypertens 31: 1281-1357.
- Du Bois D, Du Bois EF (1989) A formula to estimate the approximate surface area if height and weight be known. 1916. Nutrition 5: 303-311.
- Simpson IA (1997) Echocardiographic assessment of long axis function: a simple solution to a complex problem? Heart 78: 211-212.
- Weidemann F, Jamal F, Sutherland GR, Claus P, Kowalski M, et al. (2002) Myocardial function defined by strain rate and strain during alterations in inotropic states and heart rate. Am J Physiol Heart Circ Physiol 283: H792-799.
- Dandel M, Lehmkuhl H, Knosalla C, Suramelashvili N, Hetzer R (2009) Strain and strain rate imaging by echocardiography- basic concepts and clinical applicability. Curr Cardiol Rev 5: 133-148.
- Cuocolo A, Sax FL, Brus JE, Maron BJ, Bacharach SL, et al. (1990) Left ventricular hypertrophy and impaired diastolic filling in essential hypertension. Diastolic mechanisms for systolic dysfunction during exercise. Circulation 81: 978-986.
- Zabalgoitia M (1996) Left ventricular mass and function inprimary hypertension. Am J Hypertens 9: 55s-9s.
- Dekleva M, Pencic B, Bakic-Celic V, Kostic N, Ilic S, et al. (2003) Impact of left ventricular diastolic dysfunction on maximalexercise capacity in hypertensive patients. Eur J Echocardiography 03: 90791-90798.
- López B, Querejeta R, González A, Sánchez E, Larman M, et al. (2004) Effects of loop diuretics on myocardial fibrosis and collagen type I turnover in chronic heart failure. J Am Coll Cardiol 43: 2028-2035.
- Mu Y, Qin C, Wang C, Huojiaabudula G (2010) Two- dimensional ultrasound speckle tracking imaging in evaluation of early changes in left ventricular diastolic function in patients with essential hypertension. Echocardiography 27: 146-154.
- Goebel B, Gjesdal O, Kottke D, Otto S, Jung C, et al. (2011) Detection of irregular patterns of myocardial contraction in patients with hypertensive heart disease: A two-dimensional ultrasound speckle tracking study. Journal of Hypertension 11: 2255-2264.