

Research Article - (2025) Volume 3, Issue 2
Investigating Household Water Quality Concerns in Kumasi, Ghana: Health Risks and Potential Implications: A Case Study
Received Date: Jun 02, 2025 / Accepted Date: Jun 27, 2025 / Published Date: Jun 30, 2025
Copyright: ©Ã??Ã?©2025 Jonathan Awewomom, et al. This is an open-access article distributed under the terms of the Creative Commons Attribution License, which permits unrestricted use, distribution, and reproduction in any medium, provided the original author and source are credited.
Citation: Awewomom, J., Peasah, M. Y., Takyi, Y. D., Yaw, A.G., Antwi, S. A., et al. (2025). Investigating Household Water Quality Concerns in Kumasi, Ghana: Health Risks and Potential Implications: A Case Study. J Water Res, 3(2), 01-23.
Abstract
This research addresses the pressing issue of household water source quality and its associated health risks in Ghana. This considered the shift from traditional water sources to mechanized boreholes and hand-dug wells. This transition has prompted a need to assess water quality rigorously, given the potential health implications. Groundwater quality is susceptible to contamination from surface runoff and the condition of storage tanks, especially if they are improperly sealed, maintained, or protected. Neglecting regular cleaning and disinfection can lead to biofilm formation and microbial growth, posing a significant risk to water quality. To investigate this matter, water quality in 23 different households across the Kumasi Metropolis was analyzed. Findings exposed critical concerns, notably in the Appiadu area, where Cu and Pb concentrations surpassed World Health Organization (WHO) limits, implying potential toxicity. Similarly, elevated nitrite levels in Atonsu Kyepatre exceeded WHO standards. Conversely, some samples exhibited commendable water quality. "Microbial assessment" revealed varying total coliform counts, implying possible sewage contamination. Thirteen sites displayed undesirable counts, underlining the importance of regular monitoring and maintenance. Health risk estimates indicated hazardous levels of Cu ingestion for both children and adults, while Hazard Index (HI) values emphasized substantial health risks, particularly for children. This research offers valuable insights into water quality concerns and associated health risks in the Kumasi Metropolis, highlighting the importance of proactive monitoring, maintenance, and protection of water sources to safeguard community well-being in Ghana and analogous regions worldwide.
Keywords
Health, Household, Exposure, Water Quality, Contamination, Metals
Introduction
Water is an essential natural resource for human health and well-being. Access to safe and clean drinking water is crucial to prevent waterborne diseases and promote overall public health [1]. However, the quality of household water sources can vary significantly, particularly in regions with limited infrastructure and inadequate water treatment systems [2]. In Ghana, like many other developing countries, ensuring the provision of safe drinking water remains a significant challenge. Access to safe and clean water is a fundamental prerequisite for maintaining public health and well- being. In many regions around the world, including the Kumasi Metropolis in Ghana, the source and quality of household water can have significant implications on the health of the population. The availability of good quality water for domestic use is crucial in preventing waterborne diseases and reducing the burden of illness within communities [3].
Many parts of Ghana face challenges in providing access to safe and reliable water supply for domestic use. While the country has made commendable progress in improving water infrastructure and increasing access to pipe water in some urban areas, challenges persist, particularly in densely populated regions such as the Kumasi Metropolis. As a result, many households resort to alternative water sources, including boreholes, due to intermittent and inadequate pipe-borne water supply. Boreholes offer an alternative means of accessing water for domestic use. Borehole water is often perceived as a more reliable and accessible option for households facing water scarcity or inconsistent piped water supply. However, the quality of borehole water can vary significantly and is largely dependent on factors such as the geology of the area, proximity to potential contaminants, and maintenance of the boreholes [4]. Many studies have examined water quality in various global regions, yet few have specifically assessed household water quality, especially in Ghana [5-7]. This research placed a significant emphasis on this aspect, making it a central focus of the study.
Boreholes may be vulnerable to contamination from various sources, including microbial pathogens, chemical pollutants, and heavy metals [8]. Without adequate treatment, the consumption of contaminated borehole water can lead to waterborne diseases, such as diarrheal illnesses, cholera, typhoid fever, and parasitic infections. Long term exposure to water contaminated with heavy metals and other pollutants can lead to cancer and non- carcinogenic health concerns, serious public health implications, particularly in areas where access to healthcare facilities is limited [9]. The impact of these diseases are often felt most acutely by vulnerable populations, including children, the elderly, and those with compromised immune systems [10].
Water quality parameters provide valuable information about its composition and suitability for various purposes. Parameters such as pH, turbidity, nitrate, nitrite and hardness, influence water quality and can have an impact on human health. Understanding the concentrations and variations of these parameters is crucial for assessing water quality and determining the suitability of household water sources for domestic use [11]. The pH level of water indicates its acidity or alkalinity. Low pH values can affect the taste, corrosion of pipes, and mobility of heavy metals [12]. Excessive turbidity not only affects the aesthetic appeal of water but also indicates the presence of potential pathogens and other pollutants. High turbidity can interfere with disinfection processes and reduce the effectiveness of water treatment methods, thereby posing health risks to consumers [13]. Assessing the presence and abundance of pathogenic bacteria in household water is vital for the understanding of its bacteriological safety. Escherichia coli and faecal coliforms are one of the most commonly used indicators for fecal contamination [14].
Nutrients play a crucial role in water ecosystems and can influence water quality and ecological balance [15]. However, excessive nutrient levels, particularly nitrates, nitrites and phosphates, can result from agricultural runoff, improper waste management, and industrial activities [16]. The presence of nitrate and nitrite in drinking water can have potential public health impacts: high levels of nitrate in drinking water can pose a risk, particularly to infants. When consumed, nitrate is converted to nitrite in the body, which can lead to methemoglobinemia (blue baby syndrome). This condition reduces the blood's ability to carry oxygen, resulting in oxygen deprivation and potential health complications [17]. Nitrite can react with arsenic compounds in the body to form potentially harmful carcinogens such as nitrosamines [18]. Numerous studies have investigated water quality across various provinces, in a recent study by Abba et al conducted in the Eastern province of Saudi Arabia, their findings highlighted that a significant proportion of the samples in their study displayed notable and concerning long-term health risks linked to the presence of F− and NO − in the water [19]. A similar study by Agbasi et al in Nigeria, revealed that the presence of potentially toxic elements (PTEs) in water increases the likelihood of individuals developing cancer through the consumption of contaminated water [5].
Household water sources can be vulnerable to heavy metal contamination due to natural weathering of rocks and some anthropogenic activities such as mining, industrial discharges, and improper waste disposal [20]. Pb is a toxic heavy metal that can contaminate household water sources through improper waste disposal and industrial activities as well as weathering of parent rocks [21]. Exposure to Pb in drinking water can result in neurological and developmental issues, especially in children. As, another toxic heavy metal, often enters water sources through natural geological processes or industrial activities [20]. Chronic exposure to contaminated water has been linked to various health problems, including skin lesions, cardiovascular diseases, and an increased risk of cancer [22]. Prolonged exposure to Cd through drinking water has been linked to kidney damage, skeletal disorders, and potential reproductive issues [23]. Hg, often released into the environment through industrial pollution or improper waste disposal, is a toxic heavy metal that accumulates in aquatic ecosystems and causes severe neurological problems and harms fetal development in pregnant women. Cr, especially in its hexavalent form, Cr (VI), is of concern due to its carcinogenic properties [24].
Ensuring access to safe and clean drinking water in Ghanaian households is of utmost importance. There are several crucial methods that can be put into action to achieve this objective. It is vital to regularly maintain and clean water storage tanks, as periodic inspections and disinfections of these tanks can prevent harmful bacteria from growing and potentially contaminating the water quality [25]. Equally important is the maintenance of water pipes' integrity through frequent checks and repairs, as this prevents external contaminants from infiltrating the water supply. Moreover, educating households on proper hygiene and water handling practices, including handwashing and safe water storage, is imperative. Encouraging community-wide water treatment methods like chlorination or filtration at the source can substantially decrease waterborne diseases. When combined with public awareness campaigns, these methods can significantly enhance the overall well-being of Ghanaian households by providing a safer and healthier water supply [26].
In Ghana, mechanized boreholes and hand dug wells have become popular as a reliable water source for households, replacing traditional sources like rivers and shallow wells. However, it is important to assess the quality of water directly used in households and evaluate the potential health implications they may pose. One important factor affecting the quality of ground water is the infiltration of contaminated surface runoffs and surface water bodies. Storage tanks also play a role in altering water quality. If not properly sealed, maintained, or protected, they increase the risk of pathogens entering the stored water. Neglecting regular cleaning and disinfection can lead to biofilm and microbial growth, further compromising water quality [27]. This research aims to provide valuable insights into the state of water used in households and health risks associated with household water sources, helping policymakers, water management authorities, and communities implement appropriate measures to enhance water quality and protect public health. The findings will also contribute to advancing international knowledge on household drinking water quality, as they provide a valuable reference for other regions facing similar challenges. By examining the results of this study in Ghana, policymakers, researchers, and communities globally can learn valuable lessons on water quality monitoring, management, and treatment strategies. It is worthy to note that a preprint of this work has previously been published [28].
Materials and Methods
Study Area
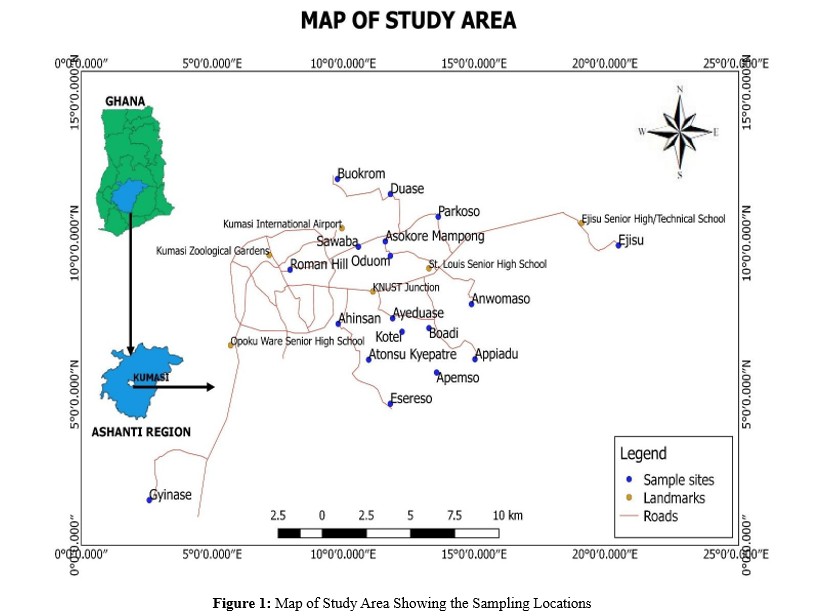
Kumasi is a metropolis and the capital of the Ashanti region of the republic of Ghana. The Kumasi Metropolis is located between
6.35° - 6.40′N latitude and 1.30° - 1.35′W longitude, covering an area of 254 km2. The aquifer in the area is a shallow type consisting of sand, with a thickness of approximately 7 – 10 m. The climate is classified as a wet sub-equatorial type, characterized by two peak periods of rainfall: in June and in September each year with an annual average high and low weather temperatures of 30.7°C and 21.5°C respectively. The average annual humidity is about 86% [29]. Kumasi is situated on a geologically diverse terrain characterized by an array of geological formations, including granite, metamorphic rocks, and sedimentary deposits. The region is known for its mineral-rich soils [30]. The fertile soil in Kumasi has been conducive for agricultural activities, playing a significant role in the local economy. The city holds a prominent position in terms of Ghana's economic, social, political, and cultural life. The population of the Kumasi Metropolis is approximately 2.5 million, including travelers from neighboring districts who engage in business activities. About half of the waste generated in Kumasi comes from households, while the remaining portion originates from industrial, institutional, and commercial sources [31].
Sampling and Analysis
This study focused on households which used boreholes and hand dug wells as their sole source of water. Households selected for this study were identified and mapped to ensure proper documentation of the sampling sites, and informed consent was obtained from the participants and ensured they understood the purpose of this study. Borehole water samples were collected from 23 households and coded as HS1 to HS23 representing the 23 different households as shown in Table 1 below. Figure 1 illustrates a map of the study area, delineating the specific locations from which the samples were collected.
|
Community |
Code |
Community |
Code |
|
Anwomaso |
HS1 |
Parkoso |
HS12 |
|
Ahinsa |
HS2 |
Atonsu Kyepatre |
HS13 |
|
Boadi |
HS3 |
Apemso |
HS14 |
|
Ejisu |
HS4 and HS15 |
Roman Hill |
HS16 |
|
Oduom |
HS5 |
Appiadu |
HS 17 |
|
Sawaba |
HS6 |
Kotei |
HS18 and HS19 |
|
Ayeduase |
HS7 |
Buokrom |
HS20, HS21, HS22 and HS23 |
|
Gyinase |
HS8 |
Asokore Mampong |
HS10 |
|
Esereso |
HS9 |
Duase |
HS11 |
Table 1: Sampling Communities with Assigned Codes
Sample containers were conditioned by washing with detergents and then soaked in 10% nitric acid for 24 hours, then rinsed with deionized water. The taps were allowed to flow for 5 minutes to purge all residues and stagnant water to obtain fresh samples for analysis. Pre-acidified sample bottles were used to collect water for the heavy metal analysis. The sample bottles were filled completely leaving no headspace to prevent oxidation and changes in the water quality during transportation. A total of 23 samples were collected from 23 households and taken to the laboratory for analysis. pH and conductivity were measured in situ with calibrated Hannah pH meter model 99171 and conductivity meter model LF 538 respectively.
The LP2000 turbidity meter was used to measure turbidity. The determination of water hardness was carried out using EDTA titration. Fluoride, alkalinity, total dissolved solids (TDS), phosphate, sulfate, nitrate and nitrite were also analyzed with Prime Lab 2.0 water testing photometer with the respective water testing tablets. The total oxidizable nitrogen (TON) was analyzed using the Aquakem 250 discrete analyzer. The preservation, preparation of the water samples for heavy metal analysis was based on the protocols described in the 22nd edition of the American Public Health Association (APHA) and metal concentrations were determined using the Inductively coupled mass spectrometer (ICP-MS) with The US EPA Method 200.2, revision 2.8 protocol, this method and details of instrument parameters are described by [33], after acid digestion [32,33]. E. coli, total coliforms, fecal coliforms and aerobic plate count were determined by the spread plate method. In this study, the microbial quality of water was assessed by examining the concentrations of total coliforms/100ml, faecal coliforms/100ml, E. coli/100ml, and total heterotrophic organisms/100ml using the MPN test method [34]. Additionally, the total counts of Enterobacteriaceae were determined using the Plate Count Method as outlined in ISO 21528-2:2017.
Quality Assurance
All the instruments used for the physicochemical analysis were properly calibrated to give accurate readings. The acid digestion of samples was done with analytical grade chemicals. Before analyzing the metals, the ICP - MS was calibrated using a set of standards to guarantee precise and reliable measurements. To identify interferences and contaminations from reagents and the sample matrix, a blank solution was employed. Replicate analyses were conducted to ensure the reproducibility and precision of the results. Additionally, certified reference materials were analyzed to verify the accuracy of the results.
Data Analysis
The data collected for this study was subjected to comprehensive analysis using IBM SPSS Statistics software (version 20) and Microsoft Excel 2016. Multicollinearity and descriptive statistics were carried out to uncover valuable insights into the underlying structure, relationships, and patterns within the dataset.
Health Risk Assessment
This study aimed to assess the health risk associated with household water used for drinking and other domestic purposes. The health risk evaluation utilized the United States Environmental Protection Agency (USEPA) risk assessment technique [35]. The assessment considered both ingestion and dermal contact as exposure routes for these metals in water. The chronic daily intake (CDI) and Dermal Absorbed Dose (DAD) all measured in mg/kg/day for the selected heavy metals were determined using equations 1 and 2 respectively [36,37].
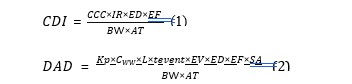
Where the concentration of the metal is Cw (mg/L), the oral ingestion rate of water (IR) measured in L/day, the exposure time (ET) in hours per event, the annual exposure frequency (EF) measured in days/year, the exposure duration (ED) in years, the skin surface area (SA) measured in cm², the skin permeability coefficient (Kp) in cm/hr, dermal permeability coefficient (kp) in cm/hr, the conversion factor (L) been unitless, the bodyweight (BW) in kg/person, event frequency (EV) in events/day, event duration (tevent) in hour/event and the average time (AT) in days.
|
PARAMETER |
UNIT |
ADULTS |
CHILDREN |
|
Body weight (BW) |
kg |
70 |
15 |
|
Ingestion rate (IR) |
L/day |
2.2 |
1 |
|
Skin surface area (SA) |
cm2 |
18,000 |
6,600 |
|
Exposure frequency (EF) |
days/year |
365 |
365 |
|
Exposure duration (ED) |
years |
30 |
6 |
|
Unit conversion factor (L) |
No unit |
1.00E-3 |
1.00E-3 |
|
Event duration (tevent) |
hr/event |
0.58 |
1 |
|
Event frequency (EV) |
events/day |
1 |
1 |
|
Average time (AT) |
days |
30 × 365 = 10,950 |
63 × 65 = 2,190 |
|
Dermal permeability coefficient (Kp) (cm/hr) |
|||
|
Se |
1.00E-3 |
As |
1.00E-3 |
|
Mn |
1.00E-3 |
Cu |
1.00E-3 |
|
Ni |
2.00E-4 |
Cr |
2.00E-3 |
|
Pb |
1.00E-4 |
Hg |
1.00E-3 |
|
Cd |
1.00E-3 |
|
|
|
Oral reference dose (RfDingestion) (mg/L/day) |
Dermal reference dose (RfDdermal) (mg/L/day) |
||
|
Cd |
5.00E-4 |
As |
1.23E-4 |
|
As |
5.00E-3 |
Cd |
5.00E-6 |
|
Cr |
3.00E-3 |
Cu |
1.20E-2 |
|
Cu |
4.00E-2 |
Cr |
6.00E-5 |
|
Hg |
3.00E-4 |
Hg |
2.10E-5 |
|
Mn |
4.60E-2 |
Mn |
1.84E-3 |
|
Ni |
2.00E-2 |
Ni |
8.00E-4 |
|
Pb |
3.60E-3 |
Pb |
5.25E-4 |
|
Se |
5.00E-3 |
Se |
2.20E-3 |
Table 2: Parameters Characterizing Health Risk Assessment
Non-carcinogenic risk, Hazard quotient (HQ) value for a single element was estimated using equation 3 [38].
![]()
The RfDing and RfDderm represents the chronic reference dose for oral and dermal exposure respectively. It is a daily estimated level of exposure to a substance that is considered safe for the human population, including vulnerable groups, over a lifetime. The specific values used for RfDing and RfDderm are shown in Table 2 [39,40].
The assessment of potential risk to humans from multiple heavy metals can be achieved by calculating the chronic hazard index (HI). The HI is obtained by summing up the individual oral/dermal hazard quotient (HQ) estimates of each heavy metal. If the HQ or HI value is less than one, it indicates that there are no significant non-carcinogenic risks. However, if the value is equal to or greater than one, it indicates the presence of significant non-carcinogenic risks, which increases as the HQ or HI value increases. The HI value was determined using equation 4 [41].
Here, CR = carcinogenic risk, CSF = cancer slope factor. The CSFing values for Cd, As, Cr, Ni and Pb are 0.38, 1.5, 0.5, 0.91 and 0.0085 (mg/kg/day)-1 respectively, and values for their CSF derm are 3.66, 38, 25, 22.8 and 0.085 (mg/kg/day)-1 respectively [36]. If the estimated CR value is lesser than and or greater than or equal to 1.00E-6, it indicates an acceptable condition. However, if this value exceeds or equals 1 × 10⁻⁴, the risk associated with that particular element is considered unacceptable [43]. It is important to consider the effects of multiple carcinogens when estimating CR. Therefore, the individual CR values for the heavy metals studied are summed to obtain the total cancer risk (CRT), as demonstrated in Equation (6):
CRT = ∑CR (6)
Water Quality Index
The Water Quality Index (WQI) evaluates the state of water based on its intended use for humans by comparing it to predefined benchmarks to ensure adherence. It assesses the suitability of water for drinking, human interaction, and the ecosystem. The quality of the household water samples was evaluated using the weighted arithmetic method [44]. The model generates a WQI with a scale of 0 to 300, where 0 represents the best water quality and 300 shows the water is unfit for consumption [45]. The model suggests five categories to classify water quality: water unfit for consumption (> 300), extremely poor water (200 - 300), poor water (100 - 200), good water (50 - 100) and excellent water (<
50) [45]. Equations 7 to 9 were used to determine the WQI;
Here, qi = Quality rating, Wi = Relative weight, wi = Assigned weight of each parameter, Ci = Concentration of each parameter, Si = Standard limit for each parameter, n = Number of parameters.
Results and Discussion
Occurrence of Heavy Metals in Water
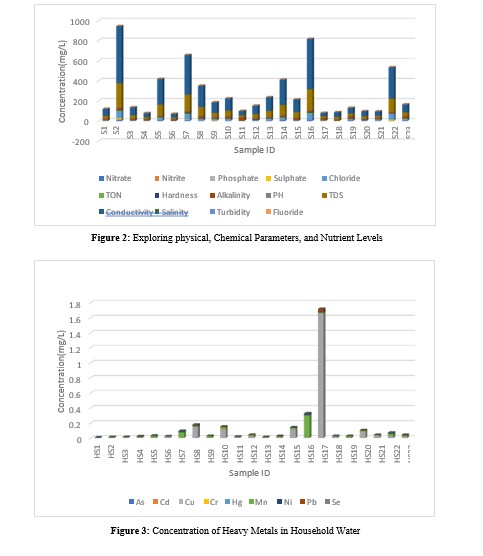
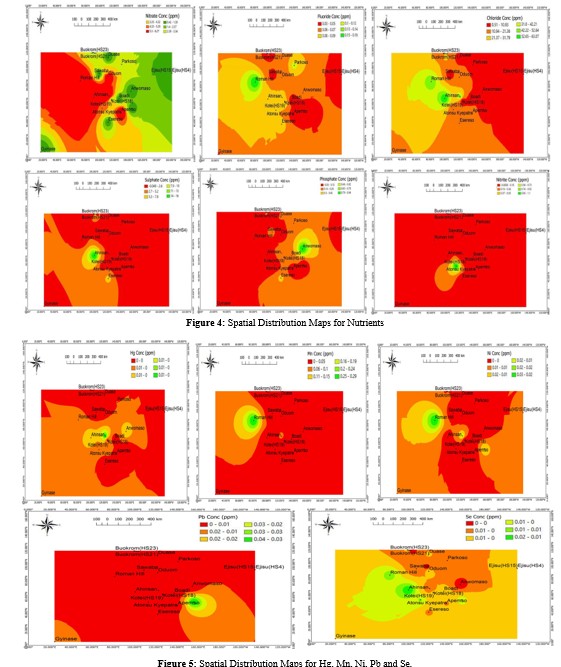
The concentration of heavy metals (As, Cd, Cu, Cr, Hg, Mn, Ni and Pb), nutrients and physicochemical parameters considered in this study and descriptive statistics as well as standard permissible limits are presented in Figure 3, Figure 2 and Table 3 respectively. The levels of As, Cd, Cr, Hg, Ni and Mn recorded in this study were well within the standard permissible limits of World Health Organization (WHO) as shown in Table 3. This suggests these metals in the water met recognized standards for domestic use. However, as shown in Table 3, the average levels of Cu (0.1 ± 0.34 mg/L) exceeded the WHO standard permissible limits of 0.05 mg/L, whereas average level of Pb in drinking water (0.0033 ± 0.0067 mg/L) did not exceed permissible limit of 0.01 mg/L [46]. A study by Appiah et al where N = 20, measured levels of Cu ranged between 0.012 to 0.073 mg/L with an average concentration of 0.117 mg/L. Average of measured Cu levels was consistent with findings in this study [47]. Concentration of Cu (1.66 mg/L) and Pb (0.032 mg/L) in sample HS17 from Appiadu exceeded their respective maximum acceptable limits for drinking water set by the WHO. This suggests possible contamination of the water from HS17, and which could adversely impact the health of individuals over time [48]. Both Cu and Pb are known to be toxic even in small concentrations. This finding implied a potential simultaneous increase in the levels of multiple toxic metal exposure to Ghana's household water. This raises concerns about the combined detrimental effects of Cu and Pb on the health of consumers. This is therefore an evident trend indicating an increasing possible toxicity of Cu and Pb in the water, which may have significant implications for the well-being of individuals. The exposed Ghanaian population and analogous regions in the world may suffer the following implications on Pb and Cu exposure; Ingesting excess amounts of Cu in water can result in symptoms such as nausea, vomiting, diarrhea, stomach issues, and headaches [49].
Prolonged exposure to Cu in drinking water can lead to liver damage. Individuals with Wilson's disease, a genetic disorder, may encounter Cu buildup, leading to hemolytic anemia, characterized by the destruction of red blood cells [50]. Lead exposure poses significant risks, especially to children, impacting their brain development and potentially causing learning disabilities [51]. The central nervous system can be affected by Pb resulting in neurological disorders, memory issues, and reduced coordination. Furthermore, Pb can harm the kidneys and impede their proper functioning. In pregnant women, lead exposure may lead to reproductive issues, affecting fertility and negatively impacting the developing fetus [48]. These results underscore the significance of adhering to regulatory standards and guidelines to prevent the harmful effects of heavy metals in household drinking water, not only in Ghana but also in other international regions facing similar challenges.
Physicochemical Characteristics of Water
The recorded levels of chemical and physical parameters, and nutrients are represented in Figure 2. The results revealed that, the pH levels in all the samples as shown in Figure 2 were within the WHO recommended pH range of 6.5 to 8.5 for drinking water, indicating that the household water sources had acceptable pH [52]. The pH values recorded in this study were all found to be slightly basic except for HS4, HS11, HS18 and HS19 which recorded slightly acidic pH levels, this could result from dissolved minerals and carbon dioxide [53]. Ground water pH in the wet and dry season in a study by Appiah et al ranged 6.83 – 7.50 and6.84 - 6.95 respectively [47]. In another study by Appiah et al , pH of borehole and hand dug wells were acidic [54]. pH ranged from 4.50 – 6.77 and 5.90 – 6.73 in borehole and hand dug wells respectively. In both studies, pH was within the acceptable range set by WHO as was the case in this study.
This study recorded a mean concentration of chloride at 16.54± 19.16 mg/L, with values ranging from 0.17 mg/L at sampling point HS18 to 63.07 mg/L at sampling point HS2. It is important to note that the WHO recommends a maximum limit of 250 mg/L for chloride in drinking water [55]. The results indicated that the chloride levels in all the samples were below this limit. The levels of chloride recorded in this study were however lower than the11.99 - 343.89 mg/L reported by Gyamfi et al on a study conducted in some suburbs of Accra, Ghana on potable water [56]. Chloride ions in potable water sources in Ghana measured 14.18 – 35.5 mg/L with a mean of 24.31 ± 9.02 at point of inlet (POI), whereas point of outlet (POU) recorded chloride ions of 10.27 – 92.17 mg/L with a mean of 28.85 ± 16.26. These recorded values were within the limit set by WHO. Very high levels of chloride ions were recorded by Safo, where measured levels were 495 – 1486 mg/L with an average of 826.61 ± 1.25 [57].
Total dissolved solids (TDS) and conductivity are indicators of the overall mineral content and salinity of water [58]. TDS of the water samples ranged from 15 – 240 mg/L with a mean of66.91 ± 64.68 mg/L, which was well within the WHO maximum threshold of 1000 mg/L, signifying a balanced mineral content in the water. Studies by Appiah et al on TDS in the wet and dry season on ground water bodies revealed ranges of 195.07±131.87- 523.02 ± 340.80mg/L (329.68 ± 270) and 307.07±374.26 -442.65 ± 241.60mg/L (364.90 ± 274.60) respectively [47]. In a similar study, TDS present in boreholes and hand dug wells ranged 41.67 – 594.67 mg/L (224.78 ± 149.38) and 58 – 92mg/L (70.89 ± 18.43) respectively [54]. The conductivity levels of the water samples ranged from 34.8 to 570.0 µS/cm, with a mean concentration of 159.1 ± 154.3 µS/cm. According to ( Appiah- Oppong et al. 2021) during the wet season and dry season in Ghana, conductivity in potable water ranges from 291.15 ± 196.05 to 780.64 ± 508.65 µS/cm and 516,83 ± 199.53 to 660.67 ± 360.60µS/cm respectively [47]. The mean of these range of values were reported to be 491.84 ± 402.80 and 574.29 ± 498.70 µS/cm in the wet and dry season respectively.
In another study by Appiah et al, conductivity in borehole and hand dug wells ranged 46.67 – 830 µS/cm ( 308.24 ± 213.14) and 73.33 – 103.33 µS/cm (84.44 ± 16.44) respectively. High conductivity can affect the taste and odor of water, making it unpleasant or undesirable to consume [54]. It may also impart a metallic or salty taste, affecting the overall drinking experience [59]. Turbidity levels in the household water samples ranged 0.07 - 0.43 NTU with an average of 0.05 ± 0.12 NTU as shown in Table 3. The WHO recommends a turbidity limit of 5 NTU for drinking water [60]. The results show that all the samples had turbidity levels well below this limit, suggesting that the water sources were free from significant particulate matter.
Turbidity levels in borehole water and hand dug wells ranged 0.22– 2.47 NTU and 0.34 – 2.15 NTU respectively by Appiah et al [54]. In another study by Yeboah et al, levels ranged 0.3 – 3.3 NTU and 0.57 – 13 NTU for POI (point of inlet) and POU (point of outlet) respectively [61]. Alkalinity is essential in preventing changes in pH, which can adversely affect the effectiveness of water treatment processes and impact the corrosiveness of household plumbing systems [62]. A mean alkalinity level of 13.91 ± 5.83 mg/L was recorded in the water samples. Alkalinity level in 17 boreholes ranged 8.67 – 114 mg/L with an average of 33.09 ± 33.15 [54]. In the same study, hand dug wells recorded alkalinity levels of 9.33– 17.33 with an average of 14.67 ± 4.62. In a study by Yeboah et al, alkalinity ranged 34 – 201 mg/L at POI and 10.6 – 233.3 mg/L at POU, with averages of 99 ± 55.30 and 103.5 ± 69.2 respectively [61]. Average of alkalinity in these studies significantly differed from findings in this study.
Alkalinity in water is often associated with water hardness due to the presence of bicarbonate ions. The levels of alkalinity and total hardness observed indicate a balanced relationship, further enhancing the overall suitability of the chemical quality of the various household water sources [63]. These findings emphasize the need for global implementation of effective measures to safeguard public health and access to clean drinking water, regardless of geographical location.
Concentration of Nutrients in Water
Figure 2 represents the recorded concentrations of nutrients in the water. Phosphate(PO -3) is an essential nutrient, but excessive levels in water can induce harmful algal blooms. A mean level of 0.14 ± 0.21 mg/L of phosphates was recorded in the water samples as shown by Table 3. Phosphate levels by Safo measured 0.50 –0.80 mg/L, with an average of 0.613 ± 0.063 [57]. In a different study also conducted in Ghana, at POI, levels of phosphate in samples ranged 0.01 – 0.07 mg/L, with a mean of 0.025 ± 0.021, whereas at POU levels ranged 0.006 – 0.085 mg/L with an average of 0.25 ± 0.0201. In Figure 2, the levels of phosphate in samples HS1 (0.94 mg/L), HS9 (0.33 mg/L) and HS23 (0.42 mg/L) exceeded the WHO limit of 0.3 mg/L, this suggests potential PO -3 pollution. The application of fertilizers and surface runoffs might had contributed to the higher levels of phosphate in the environment which end up in these water sources [64]. Fluoride (F-) concentration in the water ranged from 0.03 mg/L - 0.16 mg/L with a mean level of 0.06 ± 0.03 mg/L. The F- levels in all the samples were below the WHO standard permissible limit of 1.5 mg/L for drinking water.
The concentration of F- observed in this study was found to be lower than the ranges reported by Dongzagla et al in the Kassena- Nankana and Jirapa Municipalities of Ghana [65]. In those areas, the fluoride levels in household water sources were reported to be within the range of 0.6 - 2.0 mg/L and 0.6 - 1.5 mg/L, respectively. A study conducted on 21 samples for levels of fluoride revealed levels of 0.0002 – 0.06 at POI with an average level of 0.005 ± 0.014 [61]. Levels by Safo ranged 0.45 – 0.54 with an average of 0.48 ± 0.001 [57]. In another study, levels ranged 0.04 – 0.12 with an average of 0.087 ± 0.042 [66]. F- plays a crucial role in maintaining dental health when present in appropriate concentrations in drinking water [67].
Nitrite (NO -) is a product of nitrate reduction and can adversely affect the health of individuals, particularly infants [68]. A mean concentration of 0.05 ± 0.23 mg/L of NO - was detected in the water samples, and the maximum permissible limit of NO - in drinking water is 0.1 mg/L. Nitrite levels were below detection limit (BDL) in all samples in the study by Bowan [66]. This study showed that, the 1.10 mg/L of NO - recorded in HS13 from Atonsu Kyepatre exceeded the recommended limit as shown in Table 3, this suggests that drinking water from this source could result in blue baby syndrome and other cardiovascular diseases [69]. Total oxidizable nitrogen (TON) in water measures the presence of nitrogen compounds that can be oxidized or converted into nitrate or other oxidized nitrogen species. The water samples analyzed in this study showed notable levels of TON, with a mean concentration of 3.69 ± 4.46 mg/L. The recorded range of TON concentrations varied from 0.00 mg/L to 14.90 mg/L. The levels of TON recorded in this study could contribute to microbial growth and contamination hence increasing the risk of waterborne diseases [70]. Households with high TON content in water can be treated with activated carbon to help reduce organic nitrogen compounds, pathogens, and other contaminants [71].
Levels of sulphate (SO 2-), chloride and nitrate (NO -), in all the water samples were well below the WHO-recommended limits of 250 mg/L, 250 mg/L and 50 mg/L respectively. It is however crucial to monitor these parameters regularly. Elevated sulphate levels can impact the taste of water and have laxative effects, whereas high chloride levels can also alter the taste of water and accelerate the corrosion of metallic pipes and storage containers. NO - levels exceeding 10 mg/L could adversely affect the health of humans especially infants. Samples HS2, HS7 and HS16 recorded NO - levels of 12.76, 10.82 and 14.90 mg/L respectively.
These recorded levels of nitrate in the household water could negatively impact the health of infants [17]. The levels of nitrate recorded in this study were however lower than the levels reported by Abba et al in the Eastern provinces of Saudi Arabia [19]. Nitrate levels by Yeboah et al measured 0.06 – 1.04 mg/L with an average of 0.49 ± 0.43 at POI, whilst samples sampled at POU measured 0.077 – 1.334 mg/L with an average of 0.66 ± 0.43 [61]. Another study with a much larger sample size (N=72) recorded 0.04 – 1.38 mg/L with an average of 0.49 ± 0.013. In another study, levels measured for nitrate in all samples were below detection limit [66]. These research findings from Ghana could inform international communities and enhance understanding of water quality challenges to adopt proactive measures to ensure access to clean and safe drinking water worldwide.
Microbial Assessment of Water
The results of the microbial assessment of the water samples are represented in Table 4. Total coliform count obtained from different sampling sites ranged <1 from to TCC to 6131. MPN/100ml, notably, sampling sites HS3, HS4, HS6, HS12, HS15 and HS18 - 22 showed counts <1 for total coliforms. This result suggests water samples from these sites met the required microbial quality criteria stated by Wen et al [72]. Nonetheless, the remaining 13 sampling sites (HS1, HS2, HS5, HS7, HS8, HS9, HS10, HS11, HS13, HS14, HS16, HS17 and HS23) displayed noteworthy coliform counts as shown in Table 4, which are considered undesirable for potable water. Microbial assessment on ground water bodies revealed total coliform count of 0.0 – 30600 MPN/100ml and 22 – 40 MPN/100ml in Ghana respectively [57,66]. Studies by Ahmed et al have all reported incidence of coliforms and faecal coliforms in groundwater from various locations [34, 37, 76]. Microbial assessment for E. coli in ground water revealed counts of 0.0 – 25500 MPN/100mL in a study in Ghana by [57].
Another study recorded loads as low as 1 to 5 MPN/100mL in ground water [66]. It is important to note that the absence of E. coli in all 23 samples, as well as faecal coliforms (except in HS8) does not necessarily guarantee the absence of their cysts. Faecal cysts, although smaller in size, ranging from 3 to 10 microns, could potentially persist in water sources [77].
It is therefore necessary to incorporate filtration stages that are capable of effectively dealing with such small-sized cysts. These filtration processes play a crucial role in removing or reducing the concentration of fecal cysts, contributing to the overall safety and quality of household water. The levels of coliform bacteria recorded in some of the water can be attributed to the leaching of sand into wells, which serve as a predominant habitat for certain coliform bacteria. This study reveals the presence of total coliforms in water samples from 13 households, while E. coli, which serves as an indicator for faecal coliforms, was not detected. Faecal coliforms were however recorded in sample HS8, this makes the water unwholesome for drinking and other domestic use.
This observation together with the many microbes found in some of the water samples may be attributed to several factors. Firstly, the proximity of the borehole water sources to sewage systems in households and the possibility of cracks in pipe lines can lead to the infiltration of soil and contaminants into the water supply [78]. These findings underscore the importance of maintaining proper sanitation practices and the disinfection of water sources regularly to ensure the safety and quality of water supply. The absence of E. coli in the collected data from all sampling sites is a desirable outcome. It is notable that most of the samples (HS3, HS4, HS6, HS10 - 12 and HS15 - HS23) had low levels (<1 CFU) of enterobacteriaceae. However, Locations HS1, HS2, HS7, HS8, HS9, HS13 and HS14 showed relatively higher counts of enterobacteriaceae.
The high levels of enterobacteriaceae in these locations indicate potential fecal contamination and the presence of harmful bacteria, suggesting a higher risk of waterborne diseases for consumers [79]. The high total plate counts recorded for all the water samples indicate a higher overall bacterial load; which may include both harmful and non-harmful bacteria. While not all bacteria are pathogenic, the high microbial load can increase the likelihood of waterborne illnesses and infections, particularly for individuals with weakened immune systems, infants, and the elderly. The microbial levels recorded for all the household water samples make the water unfit for domestic use and consumption without treatment. The water used in Ghanaian households therefore has the potential to cause water borne diseases such as malaria, skin problems, and fever.
Multicollinearity and Linear Regression
Multicollinearity assessment and multiple linear regression models were used to explore the relationships between the sampling sites as independent variables and the levels of water quality parameters as dependent variables. This assessed the magnitude of impact, identified significant factors, and established statistical significance by using information about sampling sites to predict variations in water quality parameters. Multicollinearity is when there is a correlation between variables used for prediction in a model, its presence can adversely affect the regression results. Variance inflation factor (VIF) detects multicollinearity in regression results by estimating how much of a regression coefficient is inflated due to regression analysis [80]. In this study the VIF was calculated by regressing each independent variable against every other dependent variable in the model, the R-squared values were then plugged into the formula for VIF as shown in equation 10.

VIF is categorized as follows: 1= (not correlated), 1-5 = (moderately correlated), and > 5 = (highly correlated) [81].
The results indicated a VIF of 1.69 for heavy metals and 6.25 for nutrients and physicochemical parameters. VIF values for nutrients and physiochemical parameters fell within the range of moderate to high correlation. This analysis therefore revealed some level of multicollinearity, which can therefore be used as a caution in interpreting the relationships between sampling sites and water quality parameters. The regression analysis showed a relatively weak relationship between the levels of heavy metals and the various sampling sites.
This conclusion was supported by the low F-statistic (0.95) and the relatively high p-value (0.52), suggesting that sampling sites, on their own, may not significantly explain variations in water quality parameters. Instead, other factors, such as storage conditions, anthropogenic sources, environmental conditions, or temporal variations, are likely more substantial water quality determinants. On the other hand, the combined levels of nutrients and physicochemical parameters displayed a more promising relationship, although the associated p-value slightly exceeded the conventional significance level of 0.05, it still hinted at a close- to-significant relationship. The high F-statistic (2.75) and the associated p-value (0.09) indicated a possible collective impact of the sampling sites on nutrient levels, and physical and chemical parameters.
Water Quality Index
The water quality index (WQI) results, as shown in Table 5, indicate that the water quality indices of all water samples, except for HS13 and 17, were below 50. This suggests that the water is likely not harmful to human health. WQI according to studies by Safo ranged 78.03 to 204.43 in Ghana on ground water bodies [57]. Therefore, considering the physicochemical, heavy metals and nutrient content of the water, the majority of the samples met acceptable quality standards, hence pose no significant risks to individuals consuming them. HS1 – HS12, HS14 – HS16 and HS18 – HS23 can be said to have excellent water quality. However, total water quality is influenced by several other factors such as bacteria and microbial levels. Several sampling sites (HS1, HS2, HS5, HS7 - 11, HS13, HS14, HS16, HS17 and HS23) exhibited significant total coliform counts, which are considered unacceptable for potable water. Sample HS17 from Appiadu had a WQI of 180 and therefore has a poor quality [45]. The poor quality of sample HS17 could be attributed to high concentrations of Pb and Cu recorded.
Health Risk Assessment
Calculated values for hazard quotients via ingestion and dermal absorption are presented in Tables 6 and 7 respectively for adults and children. Hazard indices through ingestion of water and dermal absorption for children and adults are also represented in Table 8. The risk estimates of the household water sample through oral exposure suggests that there could be non - cancer detrimental effect on the health of individuals through the ingestion of water from HS17. Sample HS17 recorded oral HI values of 1.67 and 3.54 for adults and children respectively as shown in Table 8. This exceeded the safe limit of 1, indicating that water from HS17 may not be safe for drinking purposes.
The results obtained from the health risk assessment also revealed that, through dermal absorption, all the water sampled for this study may not adversely affect the health of both adults and children since the hazard quotients and hazard indices were all below the safe limit of 1. According to the provided categorization, a cancer risk (CR) lesser than or exceeding 1 × 10⁻⁶ is considered acceptable, whilst a risk equal to or greater than 1 × 10⁻⁴ is considered unacceptable. Presented by Table 10, ingested total cancer risk (TCR) for adults As shown in HS1, 4, 5, 7, 8, 16, 17, 22 and 23 exceeded the safe limit of 1 × 10⁻⁴, hence a potential for cancer risk may exist from consumption of water from these sources.
Again, estimated ingested TCR values of children for HS1, 2, 4, 5, 7, 8, 10, 13-17, 19, 20, 22 and 23 did exceed the maximum safe limit, informing of potential cancer risk when water from any of these sources is consumed. Much more sampling sites were shown to have the potential to cause cancer risk in children than in adults. In addition, children are often more vulnerable to the health effects of contaminants due to their developing bodies and behaviors. However, it is notable to mention that, portions of the metals consumed may be expelled from the body, resulting in a smaller amount being absorbed by the body tissues, which might not necessarily cause harm [82]. TCR assessment of samples through dermal contact as represented in Table 10 revealed that none of the samples may result in potential cancer risk in both adults and children, except for HS4 in children. Dermal TCR values for adults and children ranged from 1.52E-6 to 5.03E-5 and 47E-6 to 1.48E-4 respectively.
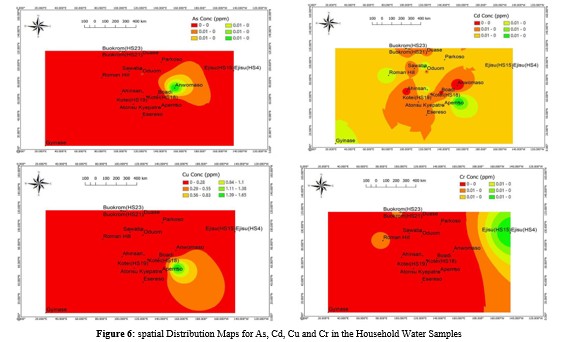
Spatial Distribution of Nutrients and Heavy Metal Concentration
Spatial distribution was performed in this study to understand the variation in concentrations, identify hotspots and distribution patterns of nutrients and heavy metals in the household water system across different sampling locations. Figures 4, 5 and 6 illustrates the spatial distribution of essential nutrients and heavy metals in the water samples. Spatially, the concentration of most nutrients displayed an increase towards the roman hill sampling area as shown in Figure 4, however, a notable observation is that the presence of NO - is more widespread in Atonsu Kyepatre (HS13) as illustrated in Figure 4, this suggests that this area and HS13 is a hotspot for NO - contamination in household water within the study area.
The presence of widespread NO - contamination in Atonsu Kyepatre (HS13) raises concerns about the safety of the household water in that area. These levels of NO - when consumed, may react with hemoglobin in the blood, forming methemoglobin hence affecting the effective carriage of oxygen leading to a condition known as methemoglobinemia, this can be particularly harmful to infants and young children [83]. Spatially, the distribution of heavy metals in the water, as depicted in Figures 5 and 6, exhibited a significant prevalence along the Apemso-Appiadu area where there is little to no mining and industrial activities. Agricultural practices and natural weathering may had largely influenced the trend of distribution of heavy metals in this location. The significant heavy metal prevalence in water along the Apemso-Appiadu area, raises concerns for potential health implications.
|
Parameter (SI unit) |
Minimum |
Maximum |
Mean ± SD |
WHO Limit |
|
As (mg/L) |
nd |
0.0048 |
0.00045 ± 0.001 |
0.01 |
|
Cd (mg/L) |
0.000087 |
0.00054 |
0.00026 ± 0.00011 |
0.005 |
|
Cr (mg/L) |
nd |
0.006 |
0.00047 ± 0.0012 |
0.05 |
|
Cu (mg/L) |
0.0008 |
1.66 |
0.1 ± 0.34 |
0.05 |
|
Hg (mg/L) |
nd |
0.000042 |
0.0000066± 0.00001 |
0.01 |
|
Ni (mg/L) |
0.00032 |
0.021 |
0.0041 ± 0.0054 |
0.07 |
|
Pb (mg/L) |
0.000094 |
0.032 |
0.0033 ± 0.0067 |
0.01 |
|
Se (mg/L) |
0.0012 |
0.0059 |
0.003 ± 0.0011 |
0.01 |
|
Mn (mg/L) |
nd |
0.29 |
0.027 ± 0.059 |
0.4 |
|
Nitrate (mg/L) |
0.10 |
14.90 |
3.64 ± 4.44 |
50 |
|
Nitrite (mg/L) |
0.002 |
1.10 |
0.05 ± 0.23 |
0.1 |
|
Phosphate (mg/L) |
0.01 |
0.94 |
0.14 ± 0.21 |
0.3 |
|
Sulphate (mg/L) |
0.01 |
15.68 |
1.76 ± 4.02 |
250 |
|
Chloride (mg/L) |
0.17 |
63.07 |
16.54 ± 19.16 |
250 |
|
Fluoride (mg/L) |
0.03 |
0.16 |
0.06 ± 0.03 |
1.5 |
|
TON (mg/L) |
nd |
14.90 |
3.69 ± 4.46 |
|
|
Hardness mg/L |
0.70 |
9.00 |
2.12 ± 1.99 |
|
|
Alkalinity (mg/L) |
10.0 |
30.0 |
13.91 ± 5.83 |
|
|
Turbidity (NTU) |
0.07 |
0.43 |
0.05 ± 0.12 |
5 |
|
Conductivity µS/cm |
34.80 |
570.00 |
159.1 ± 154.3 |
|
|
TDS mg/L |
15.00 |
240 |
66.91 ± 64.68 |
1000 |
|
pH |
5.96 |
7.32 |
6.97 ± 0.39 |
|
nd=not detected
Table 3: Descriptive Statistics of Water Quality Parameters
|
Sample ID |
Total coliform (MPN/100 ml) |
Faecal coliform (MPN/100m) |
E. coli (MPN/100mL) |
Total Plate Count (MPN/100ml) |
Enterobacteriaceae (CFU) |
|
HS1 |
235.9 |
<1 |
<1 |
507 |
20 |
|
HS2 |
866.4 |
<1 |
<1 |
470 |
130 |
|
HS3 |
<1 |
<1 |
<1 |
555 |
<1 |
|
HS4 |
<1 |
<1 |
<1 |
623 |
<1 |
|
HS5 |
56.5 |
<1 |
<1 |
738 |
10 |
|
HS6 |
<1 |
<1 |
<1 |
507x10 |
<1 |
|
HS7 |
613.1x10 |
<1 |
<1 |
738x10 |
820 |
|
HS8 |
613.1x10 |
2 |
<1 |
507 |
1100 |
|
HS9 |
39.9x10 |
<1 |
<1 |
507x10 |
420 |
|
HS10 |
49.5 |
<1 |
<1 |
738 |
<1 |
|
HS11 |
8.6 |
<1 |
<1 |
738 |
<1 |
|
HS12 |
<1 |
<1 |
<1 |
738 |
<1 |
|
HS13 |
185.0 |
<1 |
<1 |
623 |
20 |
|
HS14 |
613.1 |
<1 |
<1 |
40 |
40 |
|
HS15 |
<1 |
<1 |
<1 |
623 |
<1 |
|
HS16 |
7.5 |
<1 |
<1 |
470 |
<1 |
|
HS17 |
1.0 |
<1 |
<1 |
623 |
<1 |
|
HS18 |
<1 |
<1 |
<1 |
623 |
<1 |
|
HS19 |
<1 |
<1 |
<1 |
738 |
<1 |
|
HS20 |
<1 |
<1 |
<1 |
287 |
<1 |
|
HS21 |
<1 |
<1 |
<1 |
738 |
<1 |
|
HS22 |
<1 |
<1 |
<1 |
738 |
<1 |
|
HS23 |
24.1 |
<1 |
<1 |
623 |
<1 |
Table 4: Microbial Assessment of Water Quality
|
PARAMETER |
ASSIGNED WEIGHT |
RELATIVE WEIGHT |
Sample ID |
WQI |
|
Nitrate |
4 |
0.04706 |
HS1 |
23.8 |
|
Nitrite |
4 |
0.04706 |
HS2 |
20.5 |
|
Phosphate |
4 |
0.04706 |
HS3 |
13.6 |
|
Sulphate |
4 |
0.04706 |
HS4 |
9.23 |
|
Chloride |
5 |
0.05882 |
HS5 |
13.5 |
|
Total hardness |
3 |
0.03529 |
HS6 |
11.5 |
|
Fluoride |
5 |
0.059 |
HS7 |
19.3 |
|
Alkalinity |
3 |
0.03529 |
HS8 |
29.7 |
|
pH |
4 |
0.04706 |
HS9 |
14.9 |
|
TDS |
5 |
0.05882 |
HS10 |
23.8 |
|
Conductivity |
4 |
0.04706 |
HS11 |
11.9 |
|
Turbidity |
4 |
0.04706 |
HS12 |
15.2 |
|
Salinity |
2 |
0.02353 |
HS13 |
61.6 |
|
As |
4 |
0.04706 |
HS14 |
13.8 |
|
Cd |
5 |
0.05882 |
HS15 |
23.8 |
|
Cu |
4 |
0.04706 |
HS16 |
24 |
|
Cr |
5 |
0.05882 |
HS17 |
180 |
|
Hg |
5 |
0.05882 |
HS18 |
12.9 |
|
Ni |
4 |
0.04706 |
HS19 |
10.9 |
|
Pb |
4 |
0.04706 |
HS20 |
16.7 |
|
Se |
4 |
0.04706 |
HS21 |
11.9 |
|
Mn |
4 |
0.04706 |
HS22 |
14.9 |
|
|
Total = 90 |
|
HS23 |
18.9 |
Table 5: Determination of Water Quality Index
|
TABLE 6 HAZARD QUOTIENT (HQ) VIA INGESTION |
||||||||||||||||||
|
|
ADULTS |
CHILDREN |
||||||||||||||||
|
Sam ple |
As |
Cd |
Cu |
Cr |
Hg |
Mn |
Ni |
Pb |
Se |
As |
Cd |
Cu |
Cr |
Hg |
Mn |
Ni |
Pb |
Se |
|
HS1 |
3.05 E-2 |
5.48 E-3 |
8.18 E-4 |
1.69 E-3 |
2.20 E-3 |
0.00 E+0 |
1.40 E-3 |
8.25 E-4 |
8.88 E-3 |
6.47 E-2 |
1.16 E-2 |
1.73 E-3 |
3.59 E-3 |
4.66 E-3 |
0.00 E+0 |
2.96 E-3 |
1.75 E-3 |
1.88 E-2 |
|
HS2 |
7.39 E-4 |
8.59 E-3 |
6.30 E-4 |
4.11 E-3 |
2.20 E-3 |
5.07 E-3 |
2.82 E-3 |
1.61 E-3 |
3.74 E-2 |
1.57 E-3 |
1.82 E-2 |
1.34 E-3 |
8.72 E-3 |
4.67 E-3 |
1.07 E-2 |
5.99 E-3 |
3.41 E-3 |
7.93 E-2 |
|
HS3 |
8.81 E-4 |
9.11 E-3 |
6.99 E-3 |
3.84 E-4 |
5.58 E-5 |
1.17 E-3 |
9.32 E-4 |
7.05 E-3 |
2.04 E-2 |
1.87 E-3 |
1.93 E-2 |
1.48 E-2 |
8.15 E-4 |
1.18 E-4 |
2.49 E-3 |
1.98 E-3 |
1.49 E-2 |
4.33 E-2 |
|
HS4 |
0.00 E+0 |
9.13 E-3 |
3.76 E-3 |
6.25 E-2 |
0.00 E+0 |
3.95 E-3 |
1.14 E-2 |
1.94 E-3 |
1.42 E-2 |
0.00 E+0 |
1.94 E-2 |
7.99 E-3 |
1.33 E-1 |
0.00 E+0 |
8.39 E-3 |
2.42 E-2 |
4.12 E-3 |
3.01 E-2 |
|
HS5 |
5.39 E-3 |
1.39 E-2 |
4.19 E-3 |
0.00 E+0 |
7.35 E-4 |
1.40 E-2 |
4.12 E-3 |
1.44 E-2 |
2.09 E-2 |
1.14 E-2 |
2.94 E-2 |
8.88 E-3 |
0.00 E+0 |
1.56 E-3 |
2.96 E-2 |
8.73 E-3 |
3.06 E-2 |
4.43 E-2 |
|
HS6 |
2.41 E-4 |
1.08 E-2 |
1.31 E-2 |
4.34 E-4 |
0.00 E+0 |
1.90 E-3 |
4.97 E-4 |
9.37 E-3 |
1.26 E-2 |
5.12 E-4 |
2.28 E-2 |
2.78 E-2 |
9.21 E-4 |
0.00 E+0 |
4.03 E-3 |
1.05 E-3 |
1.99 E-2 |
2.68 E-2 |
|
HS7 |
7.52 E-5 |
2.41 E-2 |
4.70 E-3 |
1.26 E-3 |
4.43 E-3 |
4.93 E-2 |
2.28 E-2 |
4.14 E-3 |
1.33 E-2 |
1.59 E-4 |
5.10 E-2 |
9.98 E-3 |
2.68 E-3 |
9.39 E-3 |
1.05 E-1 |
4.83 E-2 |
8.79 E-3 |
2.82 E-2 |
|
HS8 |
3.89 E-4 |
2.37 E-2 |
1.18 E-1 |
2.61 E-3 |
8.27 E-4 |
6.71 E-3 |
1.06 E-2 |
7.93 E-2 |
2.08 E-2 |
8.25 E-4 |
5.03 E-2 |
2.49 E-1 |
5.54 E-3 |
1.76 E-3 |
1.42 E-2 |
2.25 E-2 |
1.68 E-1 |
4.41 E-2 |
|
HS9 |
0.00 E+0 |
1.36 E-2 |
2.00 E-3 |
1.30 E-3 |
0.00 E+0 |
1.45 E-2 |
1.76 E-3 |
1.35 E-2 |
1.69 E-2 |
0.00 E+0 |
2.88 E-2 |
4.25 E-3 |
2.76 E-3 |
0.00 E+0 |
3.09 E-2 |
3.73 E-3 |
2.87 E-2 |
3.58 E-2 |
|
HS1 0 |
2.29 E-4 |
2.73 E-2 |
9.08 E-2 |
0.00 E+0 |
0.00 E+0 |
1.93 E-2 |
4.34 E-3 |
4.87 E-2 |
1.01 E-2 |
4.85 E-4 |
5.80 E-2 |
1.93 E-1 |
0.00 E+0 |
0.00 E+0 |
4.09 E-2 |
9.22 E-3 |
1.03 E-1 |
2.14 E-2 |
|
HS1 1 |
3.01 E-3 |
1.41 E-2 |
1.13 E-2 |
1.14 E-3 |
0.00 E+0 |
1.29 E-3 |
5.73 E-4 |
1.01 E-2 |
1.85 E-2 |
6.38 E-3 |
2.98 E-2 |
2.39 E-2 |
2.42 E-3 |
0.00 E+0 |
2.73 E-3 |
1.21 E-3 |
2.13 E-2 |
3.91 E-2 |
|
HS1 2 |
0.00 E+0 |
1.60 E-2 |
1.99 E-2 |
0.00 E+0 |
7.42 E-4 |
8.97 E-3 |
1.53 E-3 |
1.94 E-2 |
1.49 E-2 |
0.00 E+0 |
3.38 E-2 |
4.22 E-2 |
0.00 E+0 |
1.57 E-3 |
1.90 E-2 |
3.24 E-3 |
4.11 E-2 |
3.17 E-2 |
|
HS1 3 |
1.11 E-3 |
1.43 E-2 |
6.71 E-4 |
3.02 E-3 |
7.58 E-4 |
4.88 E-3 |
2.19 E-3 |
2.66 E-3 |
2.81 E-2 |
2.36 E-3 |
3.02 E-2 |
1.42 E-3 |
6.41 E-3 |
1.61 E-3 |
1.03 E-2 |
4.64 E-3 |
5.64 E-3 |
5.96 E-2 |
|
HS1 4 |
2.47 E-3 |
1.66 E-2 |
8.06 E-3 |
2.79 E-3 |
4.11 E-4 |
6.03 E-3 |
1.86 E-3 |
2.73 E-2 |
1.73 E-2 |
5.24 E-3 |
3.53 E-2 |
1.71 E-2 |
5.92 E-3 |
8.72 E-4 |
1.28 E-2 |
3.95 E-3 |
5.78 E-2 |
3.66 E-2 |
|
HS1 5 |
2.68 E-4 |
2.34 E-2 |
9.18 E-2 |
7.25 E-4 |
0.00 E+0 |
1.30 E-2 |
3.01 E-3 |
2.90 E-2 |
2.55 E-2 |
5.69 E-4 |
4.97 E-2 |
1.95 E-1 |
1.54 E-3 |
0.00 E+0 |
2.75 E-2 |
6.38 E-3 |
6.15 E-2 |
5.40 E-2 |
|
HS1 6 |
1.78 E-3 |
2.36 E-2 |
8.13 E-3 |
6.93 E-3 |
1.11 E-3 |
1.99 E-1 |
3.37 E-2 |
5.88 E-3 |
2.95 E-2 |
3.77 E-3 |
5.00 E-2 |
1.73 E-2 |
1.47 E-2 |
2.36 E-3 |
4.21 E-1 |
7.14 E-2 |
1.25 E-2 |
6.26 E-2 |
|
HS1 7 |
0.00 E+0 |
3.42 E-2 |
1.30 E+0 |
0.00 E+0 |
0.00 E+0 |
9.64 E-3 |
1.69 E-2 |
2.83 E-1 |
2.47 E-2 |
0.00 E+0 |
7.26 E-2 |
2.76 E+0 |
0.00 E+0 |
0.00 E+0 |
2.04 E-2 |
3.58 E-2 |
6.01 E-1 |
5.23 E-2 |
|
HS1 8 |
1.76 E-3 |
1.55 E-2 |
1.05 E-2 |
0.00 E+0 |
0.00 E+0 |
7.01 E-3 |
6.02 E-4 |
9.18 E-3 |
1.78 E-2 |
3.74 E-3 |
3.29 E-2 |
2.23 E-2 |
0.00 E+0 |
0.00 E+0 |
1.49 E-2 |
1.28 E-3 |
1.95 E-2 |
3.77 E-2 |
|
HS1 9 |
1.56 E-3 |
1.19 E-2 |
2.40 E-3 |
5.14 E-3 |
1.63 E-3 |
1.42 E-2 |
2.78 E-3 |
4.20 E-3 |
1.81 E-2 |
3.30 E-3 |
2.53 E-2 |
5.09 E-3 |
1.09 E-2 |
3.46 E-3 |
3.00 E-2 |
5.89 E-3 |
8.91 E-3 |
3.83 E-2 |
|
HS2 0 |
4.13 E-3 |
1.35 E-2 |
6.22 E-2 |
2.05 E-3 |
0.00 E+0 |
1.14 E-2 |
1.88 E-3 |
3.78 E-2 |
2.11 E-2 |
8.77 E-3 |
2.85 E-2 |
1.32 E-1 |
4.36 E-3 |
0.00 E+0 |
2.42 E-2 |
3.98 E-3 |
8.02 E-2 |
4.48 E-2 |
|
HS2 1 |
0.00 E+0 |
1.38 E-2 |
2.57 E-2 |
0.00 E+0 |
0.00 E+0 |
3.40 E-3 |
1.03 E-3 |
2.48 E-2 |
7.54 E-3 |
0.00 E+0 |
2.92 E-2 |
5.46 E-2 |
0.00 E+0 |
0.00 E+0 |
7.21 E-3 |
2.18 E-3 |
5.26 E-2 |
1.60 E-2 |
|
HS2 2 |
3.40 E-3 |
1.52 E-2 |
1.89 E-2 |
0.00 E+0 |
7.59 E-4 |
2.42 E-2 |
1.28 E-2 |
6.63 E-3 |
1.10 E-2 |
7.22 E-3 |
3.22 E-2 |
4.00 E-2 |
0.00 E+0 |
1.61 E-3 |
5.14 E-2 |
2.71 E-2 |
1.41 E-2 |
2.34 E-2 |
|
HS2 3 |
7.55 E-3 |
1.60 E-2 |
1.38 E-2 |
1.77 E-2 |
0.00 E+0 |
9.35 E-3 |
1.00 E-2 |
1.85 E-2 |
1.75 E-2 |
1.60 E-2 |
3.39 E-2 |
2.93 E-2 |
3.75 E-2 |
0.00 E+0 |
1.98 E-2 |
2.13 E-2 |
3.92 E-2 |
3.71 E-2 |
Table 6: Hazard Quotient (Hq) Via Ingestion
|
|
ADULTS |
CHILDREN |
||||||||||||||||
|
Sam ple |
As |
Cd |
Cu |
Cr |
Hg |
Mn |
Ni |
Pb |
Se |
As |
Cd |
Cu |
Cr |
Hg |
Mn |
Ni |
Pb |
Se |
|
HS1 |
5.89 E-3 |
2.60 E-3 |
1.29 E-5 |
8.03 E-4 |
1.49 E-4 |
0.00 E+0 |
3.31 E-5 |
2.68 E-6 |
9.58 E-5 |
1.74 E-2 |
7.67 E-3 |
3.82 E-5 |
2.37 E-3 |
4.40 E-4 |
0.00 E+0 |
9.77 E-5 |
7.92 E-6 |
2.83 E-4 |
|
HS2 |
1.43 E-4 |
4.08 E-3 |
9.97 E-6 |
1.95 E-3 |
1.49 E-4 |
6.01 E-4 |
6.70 E-5 |
5.22 E-6 |
4.03 E-4 |
4.21 E-4 |
1.20 E-2 |
2.94 E-5 |
5.76 E-3 |
4.40 E-4 |
1.77 E-3 |
1.98 E-4 |
1.54 E-5 |
1.19 E-3 |
|
HS3 |
1.70 E-4 |
4.32 E-3 |
1.11 E-4 |
1.82 E-4 |
3.79 E-6 |
1.39 E-4 |
2.21 E-5 |
2.29 E-5 |
2.20 E-4 |
5.01 E-4 |
1.28 E-2 |
3.26 E-4 |
5.38 E-4 |
1.12 E-5 |
4.11 E-4 |
6.52 E-5 |
6.76 E-5 |
6.49 E-4 |
|
HS4 |
0.00 E+0 |
4.33 E-3 |
5.96 E-5 |
2.97 E-2 |
0.00 E+0 |
4.69 E-4 |
2.70 E-4 |
6.33 E-6 |
1.53 E-4 |
0.00 E+0 |
1.28 E-2 |
1.76 E-4 |
8.76 E-2 |
0.00 E+0 |
1.38 E-3 |
7.97 E-4 |
1.87 E-5 |
4.52 E-4 |
|
HS5 |
1.04 E-3 |
6.59 E-3 |
6.62 E-5 |
0.00 E+0 |
4.98 E-5 |
1.66 E-3 |
9.76 E-5 |
4.70 E-5 |
2.25 E-4 |
3.07 E-3 |
1.94 E-2 |
1.95 E-4 |
0.00 E+0 |
1.47 E-4 |
4.88 E-3 |
2.88 E-4 |
1.39 E-4 |
6.65 E-4 |
|
HS6 |
4.65 E-5 |
5.10 E-3 |
2.07 E-4 |
2.06 E-4 |
0.00 E+0 |
2.26 E-4 |
1.18 E-5 |
3.05 E-5 |
1.36 E-4 |
1.37 E-4 |
1.51 E-2 |
6.11 E-4 |
6.08 E-4 |
0.00 E+0 |
6.65 E-4 |
3.48 E-5 |
8.99 E-5 |
4.02 E-4 |
|
HS7 |
1.45 E-5 |
1.14 E-2 |
7.44 E-5 |
5.99 E-4 |
3.00 E-4 |
5.85 E-3 |
5.41 E-4 |
1.35 E-5 |
1.44 E-4 |
4.28 E-5 |
3.37 E-2 |
2.20 E-4 |
1.77 E-3 |
8.85 E-4 |
1.73 E-2 |
1.60 E-3 |
3.98 E-5 |
4.24 E-4 |
|
HS8 |
7.50 E-5 |
1.12 E-2 |
1.86 E-3 |
1.24 E-3 |
5.61 E-5 |
7.96 E-4 |
2.52 E-4 |
2.58 E-4 |
2.24 E-4 |
2.21 E-4 |
3.32 E-2 |
5.49 E-3 |
3.65 E-3 |
1.65 E-4 |
2.35 E-3 |
7.43 E-4 |
7.61 E-4 |
6.61 E-4 |
|
HS9 |
0.00 E+0 |
6.45 E-3 |
3.17 E-5 |
6.17 E-4 |
0.00 E+0 |
1.73 E-3 |
4.17 E-5 |
4.40 E-5 |
1.82 E-4 |
0.00 E+0 |
1.90 E-2 |
9.35 E-5 |
1.82 E-3 |
0.00 E+0 |
5.09 E-3 |
1.23 E-4 |
1.30 E-4 |
5.38 E-4 |
|
HS1 0 |
4.41 E-5 |
1.30 E-2 |
1.44 E-3 |
0.00 E+0 |
0.00 E+0 |
2.29 E-3 |
1.03 E-4 |
1.58 E-4 |
1.09 E-4 |
1.30 E-4 |
3.83 E-2 |
4.24 E-3 |
0.00 E+0 |
0.00 E+0 |
6.74 E-3 |
3.04 E-4 |
4.68 E-4 |
3.20 E-4 |
|
HS1 1 |
5.80 E-4 |
6.67 E-3 |
1.78 E-4 |
5.40 E-4 |
0.00 E+0 |
1.53 E-4 |
1.36 E-5 |
3.27 E-5 |
1.99 E-4 |
1.71 E-3 |
1.97 E-2 |
5.26 E-4 |
1.59 E-3 |
0.00 E+0 |
4.50 E-4 |
4.01 E-5 |
9.65 E-5 |
5.87 E-4 |
|
HS1 2 |
0.00 E+0 |
7.57 E-3 |
3.15 E-4 |
0.00 E+0 |
5.03 E-5 |
1.06 E-3 |
3.62 E-5 |
6.30 E-5 |
1.61 E-4 |
0.00 E+0 |
2.23 E-2 |
9.28 E-4 |
0.00 E+0 |
1.48 E-4 |
3.14 E-3 |
1.07 E-4 |
1.86 E-4 |
4.75 E-4 |
|
HS1 3 |
2.15 E-4 |
6.76 E-3 |
1.06 E-5 |
1.43 E-3 |
5.14 E-5 |
5.79 E-4 |
5.20 E-5 |
8.65 E-6 |
3.03 E-4 |
6.34 E-4 |
2.00 E-2 |
3.13 E-5 |
4.23 E-3 |
1.52 E-4 |
1.71 E-3 |
1.53 E-4 |
2.55 E-5 |
8.93 E-4 |
|
HS1 4 |
4.77 E-4 |
7.90 E-3 |
1.27 E-4 |
1.32 E-3 |
2.79 E-5 |
7.16 E-4 |
4.42 E-5 |
8.87 E-5 |
1.86 E-4 |
1.41 E-3 |
2.33 E-2 |
3.76 E-4 |
3.91 E-3 |
8.22 E-5 |
2.11 E-3 |
1.31 E-4 |
2.62 E-4 |
5.50 E-4 |
|
HS1 5 |
5.17 E-5 |
1.11 E-2 |
1.45 E-3 |
3.44 E-4 |
0.00 E+0 |
1.54 E-3 |
7.13 E-5 |
9.44 E-5 |
2.74 E-4 |
1.53 E-4 |
3.28 E-2 |
4.28 E-3 |
1.01 E-3 |
0.00 E+0 |
4.54 E-3 |
2.10 E-4 |
2.78 E-4 |
8.10 E-4 |
|
HS1 6 |
3.43 E-4 |
1.12 E-2 |
1.29 E-4 |
3.29 E-3 |
7.55 E-5 |
2.36 E-2 |
7.99 E-4 |
1.91 E-5 |
3.18 E-4 |
1.01 E-3 |
3.30 E-2 |
3.80 E-4 |
9.70 E-3 |
2.23 E-4 |
6.95 E-2 |
2.36 E-3 |
5.64 E-5 |
9.39 E-4 |
|
HS1 7 |
0.00 E+0 |
1.62 E-2 |
2.06 E-2 |
0.00 E+0 |
0.00 E+0 |
1.14 E-3 |
4.01 E-4 |
9.22 E-4 |
2.66 E-4 |
0.00 E+0 |
4.79 E-2 |
6.07 E-2 |
0.00 E+0 |
0.00 E+0 |
3.37 E-3 |
1.18 E-3 |
2.72 E-3 |
7.85 E-4 |
|
HS1 8 |
3.40 E-4 |
7.35 E-3 |
1.67 E-4 |
0.00 E+0 |
0.00 E+0 |
8.32 E-4 |
1.43 E-5 |
2.99 E-5 |
1.92 E-4 |
1.00 E-3 |
2.17 E-2 |
4.92 E-4 |
0.00 E+0 |
0.00 E+0 |
2.45 E-3 |
4.21 E-5 |
8.81 E-5 |
5.65 E-4 |
|
HS1 9 |
3.00 E-4 |
5.67 E-3 |
3.79 E-5 |
2.44 E-3 |
1.11 E-4 |
1.68 E-3 |
6.59 E-5 |
1.37 E-5 |
1.95 E-4 |
8.85 E-4 |
1.67 E-2 |
1.12 E-4 |
7.19 E-3 |
3.26 E-4 |
4.96 E-3 |
1.95 E-4 |
4.03 E-5 |
5.75 E-4 |
|
HS2 0 |
7.97 E-4 |
6.38 E-3 |
9.84 E-4 |
9.74 E-4 |
0.00 E+0 |
1.35 E-3 |
4.45 E-5 |
1.23 E-4 |
2.28 E-4 |
2.35 E-3 |
1.88 E-2 |
2.90 E-3 |
2.87 E-3 |
0.00 E+0 |
3.99 E-3 |
1.31 E-4 |
3.63 E-4 |
6.73 E-4 |
|
HS2 1 |
0.00 E+0 |
6.54 E-3 |
4.07 E-4 |
0.00 E+0 |
0.00 E+0 |
4.03 E-4 |
2.44 E-5 |
8.06 E-5 |
8.14 E-5 |
0.00 E+0 |
1.93 E-2 |
1.20 E-3 |
0.00 E+0 |
0.00 E+0 |
1.19 E-3 |
7.20 E-5 |
2.38 E-4 |
2.40 E-4 |
|
HS2 2 |
6.56 E-4 |
7.21 E-3 |
2.99 E-4 |
0.00 E+0 |
5.15 E-5 |
2.87 E-3 |
3.03 E-4 |
2.16 E-5 |
1.19 E-4 |
1.94 E-3 |
2.13 E-2 |
8.81 E-4 |
0.00 E+0 |
1.52 E-4 |
8.48 E-3 |
8.93 E-4 |
6.36 E-5 |
3.52 E-4 |
|
HS2 3 |
1.46 E-3 |
7.59 E-3 |
2.19 E-4 |
8.39 E-3 |
0.00 E+0 |
1.11 E-3 |
2.38 E-4 |
6.01 E-5 |
1.88 E-4 |
4.30 E-3 |
2.24 E-2 |
6.46 E-4 |
2.48 E-2 |
0.00 E+0 |
3.27 E-3 |
7.02 E-4 |
1.77 E-4 |
5.56 E-4 |
Table 7: Hazard Quotient (Hq) Via Dermal
|
Sample |
ADULT |
CHILDREN |
ADULTS |
CHILDREN |
|
HS1 |
5.18E-2 |
1.10E-1 |
9.58E-3 |
2.83E-2 |
|
HS2 |
6.31E-2 |
1.34E-1 |
7.40E-3 |
2.18E-2 |
|
HS3 |
4.70E-2 |
9.97E-2 |
5.19E-3 |
1.53E-2 |
|
HS4 |
1.07E-1 |
2.27E-1 |
3.50E-2 |
1.03E-1 |
|
HS5 |
7.76E-2 |
1.65E-1 |
9.77E-3 |
2.88E-2 |
|
HS6 |
4.89E-2 |
1.04E-1 |
5.97E-3 |
1.76E-2 |
|
HS7 |
1.24E-1 |
2.63E-1 |
1.90E-2 |
5.59E-2 |
|
HS8 |
2.62E-1 |
5.57E-1 |
1.60E-2 |
4.72E-2 |
|
HS9 |
6.36E-2 |
1.35E-1 |
9.09E-3 |
2.68E-2 |
|
HS10 |
2.01E-1 |
4.26E-1 |
1.71E-2 |
5.05E-2 |
|
HS11 |
5.98E-2 |
1.27E-1 |
8.37E-3 |
2.47E-2 |
|
HS12 |
8.14E-2 |
1.73E-1 |
9.26E-3 |
2.73E-2 |
|
HS13 |
5.76E-2 |
1.22E-1 |
9.42E-3 |
2.78E-2 |
|
HS14 |
8.28E-2 |
1.76E-1 |
1.09E-2 |
3.21E-2 |
|
HS15 |
1.87E-1 |
3.96E-1 |
1.49E-2 |
4.41E-2 |
|
HS16 |
3.09E-1 |
6.56E-1 |
3.97E-2 |
1.17E-1 |
|
HS17 |
1.67E+0 |
3.54E+0 |
3.96E-2 |
1.17E-1 |
|
HS18 |
6.24E-2 |
1.32E-1 |
8.93E-3 |
2.63E-2 |
|
HS19 |
6.19E-2 |
1.31E-1 |
1.05E-2 |
3.10E-2 |
|
HS20 |
1.54E-1 |
3.27E-1 |
1.09E-2 |
3.21E-2 |
|
HS21 |
7.63E-2 |
1.62E-1 |
7.54E-3 |
2.22E-2 |
|
HS22 |
9.29E-2 |
1.97E-1 |
1.15E-2 |
3.40E-2 |
|
HS23 |
1.10E-1 |
2.34E-1 |
1.93E-2 |
5.68E-2 |
Table 8: Hazard Index (HI)
|
|
INGESTION |
DERMAL |
||||||||||||||||||
|
|
ADULTS |
CHILDREN |
ADULTS |
CHILDREN |
||||||||||||||||
|
Sam ple |
As |
Cd |
Cr |
Ni |
Pb |
As |
Cd |
Cr |
Ni |
Pb |
As |
Cd |
Cr |
Ni |
Pb |
As |
Cd |
Cr |
Ni |
Pb |
|
HS1 |
2.29 E-4 |
1.04 E-6 |
2.54 E-6 |
2.54 E-5 |
2.52 E-8 |
4.85 E-4 |
2.21 E-6 |
5.39 E-6 |
5.39 E-5 |
5.35 E-8 |
2.65 E-6 |
4.94 E-7 |
1.20 E-6 |
6.03 E-7 |
#### ### |
7.81 E-6 |
1.46 E-6 |
3.55 E-6 |
1.78 E-6 |
3.53 E-10 |
|
HS2 |
5.54 E-6 |
1.63 E-6 |
6.17 E-6 |
5.14 E-5 |
4.91 E-8 |
1.18 E-5 |
3.46 E-6 |
1.31 E-5 |
1.09 E-4 |
1.04 E-7 |
6.42 E-8 |
7.74 E-7 |
2.93 E-6 |
1.22 E-6 |
#### ### |
1.89 E-7 |
2.28 E-6 |
8.63 E-6 |
3.60 E-6 |
6.88 E-10 |
|
HS3 |
6.61 E-6 |
1.73 E-6 |
5.77 E-7 |
1.70 E-5 |
2.16 E-7 |
1.40 E-5 |
3.67 E-6 |
1.22 E-6 |
3.60 E-5 |
4.57 E-7 |
7.65 E-8 |
8.21 E-7 |
2.74 E-7 |
4.02 E-7 |
1.02 E-9 |
2.26 E-7 |
2.42 E-6 |
8.07 E-7 |
1.19 E-6 |
3.02 E-9 |
|
HS4 |
0.00 E+0 |
1.74 E-6 |
9.38 E-5 |
2.07 E-4 |
5.95 E-8 |
0.00 E+0 |
3.68 E-6 |
1.99 E-4 |
4.40 E-4 |
1.26 E-7 |
0.00 E+0 |
8.23 E-7 |
4.45 E-5 |
4.92 E-6 |
#### ### |
0.00 E+0 |
2.43 E-6 |
1.31 E-4 |
1.45 E-5 |
8.33 E-10 |
|
HS5 |
4.04 E-5 |
2.64 E-6 |
0.00 E+0 |
7.49 E-5 |
4.42 E-7 |
8.58 E-5 |
5.60 E-6 |
0.00 E+0 |
1.59 E-4 |
9.37 E-7 |
4.68 E-7 |
1.25 E-6 |
0.00 E+0 |
1.78 E-6 |
2.10 E-9 |
1.38 E-6 |
3.69 E-6 |
0.00 E+0 |
5.24 E-6 |
6.19 E-9 |
|
HS6 |
1.81 E-6 |
2.04 E-6 |
6.51 E-7 |
9.04 E-6 |
2.87 E-7 |
3.84 E-6 |
4.33 E-6 |
1.38 E-6 |
1.92 E-5 |
6.08 E-7 |
2.09 E-8 |
9.70 E-7 |
3.09 E-7 |
2.15 E-7 |
1.36 E-9 |
6.18 E-8 |
2.86 E-6 |
9.12 E-7 |
6.33 E-7 |
4.01 E-9 |
|
HS7 |
5.64 E-7 |
4.57 E-6 |
1.89 E-6 |
4.15 E-4 |
1.27 E-7 |
1.20 E-6 |
9.70 E-6 |
4.01 E-6 |
8.80 E-4 |
2.69 E-7 |
6.53 E-9 |
2.17 E-6 |
8.98 E-7 |
9.84 E-6 |
#### ### |
1.93 E-8 |
6.40 E-6 |
2.65 E-6 |
2.90 E-5 |
1.77 E-9 |
|
HS8 |
2.92 E-6 |
4.50 E-6 |
3.92 E-6 |
1.93 E-4 |
2.43 E-6 |
6.19 E-6 |
9.55 E-6 |
8.31 E-6 |
4.10 E-4 |
5.15 E-6 |
3.38 E-8 |
2.14 E-6 |
1.86 E-6 |
4.59 E-6 |
1.15 E-8 |
9.96 E-8 |
6.30 E-6 |
5.48 E-6 |
1.35 E-5 |
3.40 E-8 |
|
HS9 |
0.00 E+0 |
2.58 E-6 |
1.95 E-6 |
3.20 E-5 |
4.14 E-7 |
0.00 E+0 |
5.48 E-6 |
4.14 E-6 |
6.79 E-5 |
8.77 E-7 |
0.00 E+0 |
1.23 E-6 |
9.26 E-7 |
7.60 E-7 |
1.96 E-9 |
0.00 E+0 |
3.62 E-6 |
2.73 E-6 |
2.24 E-6 |
5.79 E-9 |
|
HS1 0 |
1.72 E-6 |
5.19 E-6 |
0.00 E+0 |
7.91 E-5 |
1.49 E-6 |
3.64 E-6 |
1.10 E-5 |
0.00 E+0 |
1.68 E-4 |
3.16 E-6 |
1.99 E-8 |
2.47 E-6 |
0.00 E+0 |
1.88 E-6 |
7.07 E-9 |
5.86 E-8 |
7.27 E-6 |
0.00 E+0 |
5.53 E-6 |
2.09 E-8 |
|
HS1 1 |
2.25 E-5 |
2.67 E-6 |
1.71 E-6 |
1.04 E-5 |
3.08 E-7 |
4.78 E-5 |
5.67 E-6 |
3.62 E-6 |
2.21 E-5 |
6.53 E-7 |
2.61 E-7 |
1.27 E-6 |
8.11 E-7 |
2.47 E-7 |
1.46 E-9 |
7.70 E-7 |
3.74 E-6 |
2.39 E-6 |
7.29 E-7 |
4.31 E-9 |
|
HS1 2 |
0.00 E+0 |
3.03 E-6 |
0.00 E+0 |
2.78 E-5 |
5.93 E-7 |
0.00 E+0 |
6.43 E-6 |
0.00 E+0 |
5.89 E-5 |
1.26 E-6 |
0.00 E+0 |
1.44 E-6 |
0.00 E+0 |
6.59 E-7 |
2.81 E-9 |
0.00 E+0 |
4.24 E-6 |
0.00 E+0 |
1.94 E-6 |
8.30 E-9 |
|
HS1 3 |
8.35 E-6 |
2.71 E-6 |
4.53 E-6 |
3.99 E-5 |
8.13 E-8 |
1.77 E-5 |
5.74 E-6 |
9.61 E-6 |
8.45 E-5 |
1.73 E-7 |
9.67 E-8 |
1.29 E-6 |
2.15 E-6 |
9.46 E-7 |
#### ### |
2.85 E-7 |
3.79 E-6 |
6.34 E-6 |
2.79 E-6 |
1.14 E-9 |
|
HS1 4 |
1.85 E-5 |
3.16 E-6 |
4.19 E-6 |
3.39 E-5 |
8.34 E-7 |
3.93 E-5 |
6.71 E-6 |
8.88 E-6 |
7.20 E-5 |
1.77 E-6 |
2.15 E-7 |
1.50 E-6 |
1.99 E-6 |
8.05 E-7 |
3.96 E-9 |
6.33 E-7 |
4.43 E-6 |
5.86 E-6 |
2.38 E-6 |
1.17 E-8 |
|
HS1 5 |
2.01 E-6 |
4.45 E-6 |
1.09 E-6 |
5.47 E-5 |
8.87 E-7 |
4.27 E-6 |
9.45 E-6 |
2.31 E-6 |
1.16 E-4 |
1.88 E-6 |
2.33 E-8 |
2.11 E-6 |
5.16 E-7 |
1.30 E-6 |
4.21 E-9 |
6.87 E-8 |
6.23 E-6 |
1.52 E-6 |
3.83 E-6 |
1.24 E-8 |
|
HS1 6 |
1.33 E-5 |
4.48 E-6 |
1.04 E-5 |
6.13 E-4 |
1.80 E-7 |
2.83 E-5 |
9.50 E-6 |
2.20 E-5 |
1.30 E-3 |
3.81 E-7 |
1.54 E-7 |
2.12 E-6 |
4.93 E-6 |
1.45 E-5 |
#### ### |
4.55 E-7 |
6.27 E-6 |
1.45 E-5 |
4.29 E-5 |
2.52 E-9 |
|
HS1 7 |
0.00 E+0 |
6.51 E-6 |
0.00 E+0 |
3.07 E-4 |
8.67 E-6 |
0.00 E+0 |
1.38 E-5 |
0.00 E+0 |
6.52 E-4 |
1.84 E-5 |
0.00 E+0 |
3.09 E-6 |
0.00 E+0 |
7.30 E-6 |
4.11 E-8 |
0.00 E+0 |
9.11 E-6 |
0.00 E+0 |
2.15 E-5 |
1.21 E-7 |
|
HS1 8 |
1.32 E-5 |
2.94 E-6 |
0.00 E+0 |
1.10 E-5 |
2.81 E-7 |
2.80 E-5 |
6.24 E-6 |
0.00 E+0 |
2.32 E-5 |
5.96 E-7 |
1.53 E-7 |
1.40 E-6 |
0.00 E+0 |
2.60 E-7 |
1.33 E-9 |
4.51 E-7 |
4.12 E-6 |
0.00 E+0 |
7.67 E-7 |
3.93 E-9 |
|
HS1 9 |
1.17 E-5 |
2.27 E-6 |
7.71 E-6 |
5.06 E-5 |
1.29 E-7 |
2.47 E-5 |
4.81 E-6 |
1.64 E-5 |
1.07 E-4 |
2.73 E-7 |
1.35 E-7 |
1.08 E-6 |
3.66 E-6 |
1.20 E-6 |
#### ### |
3.98 E-7 |
3.18 E-6 |
1.08 E-5 |
3.54 E-6 |
1.80 E-9 |
|
HS2 0 |
3.10 E-5 |
2.56 E-6 |
3.08 E-6 |
3.41 E-5 |
1.16 E-6 |
6.58 E-5 |
5.42 E-6 |
6.53 E-6 |
7.24 E-5 |
2.45 E-6 |
3.59 E-7 |
1.21 E-6 |
1.46 E-6 |
8.10 E-7 |
5.49 E-9 |
1.06 E-6 |
3.58 E-6 |
4.31 E-6 |
2.39 E-6 |
1.62 E-8 |
|
HS2 1 |
0.00 E+0 |
2.62 E-6 |
0.00 E+0 |
1.87 E-5 |
7.58 E-7 |
0.00 E+0 |
5.56 E-6 |
0.00 E+0 |
3.97 E-5 |
1.61 E-6 |
0.00 E+0 |
1.24 E-6 |
0.00 E+0 |
4.44 E-7 |
3.60 E-9 |
0.00 E+0 |
3.67 E-6 |
0.00 E+0 |
1.31 E-6 |
1.06 E-8 |
|
HS2 2 |
2.55 E-5 |
2.89 E-6 |
0.00 E+0 |
2.32 E-4 |
2.03 E-7 |
5.41 E-5 |
6.12 E-6 |
0.00 E+0 |
4.93 E-4 |
4.30 E-7 |
2.95 E-7 |
1.37 E-6 |
0.00 E+0 |
5.51 E-6 |
#### ### |
8.71 E-7 |
4.04 E-6 |
0.00 E+0 |
1.63 E-5 |
2.84 E-9 |
|
HS2 3 |
5.66 E-5 |
3.04 E-6 |
2.65 E-5 |
1.82 E-4 |
5.65 E-7 |
1.20 E-4 |
6.44 E-6 |
5.63 E-5 |
3.87 E-4 |
1.20 E-6 |
6.56 E-7 |
1.44 E-6 |
1.26 E-5 |
4.33 E-6 |
2.68 E-9 |
1.93 E-6 |
4.25 E-6 |
3.71 E-5 |
1.28 E-5 |
7.91 E-9 |
Table 9: Likely Cancer Risk (CR)
|
|
INGESTION |
|
DERMAL |
|
|
Sample |
ADULTS |
CHILDREN |
ADULTS |
CHILDREN |
|
HS1 |
2.58E-4 |
5.47E-4 |
4.95E-6 |
1.46E-5 |
|
HS2 |
6.48E-5 |
1.37E-4 |
4.98E-6 |
1.47E-5 |
|
HS3 |
2.61E-5 |
5.53E-5 |
1.57E-6 |
4.65E-6 |
|
HS4 |
3.03E-4 |
6.43E-4 |
5.03E-5 |
1.48E-4 |
|
HS5 |
1.18E-4 |
2.51E-4 |
3.50E-6 |
1.03E-5 |
|
HS6 |
1.38E-5 |
2.93E-5 |
1.52E-6 |
4.47E-6 |
|
HS7 |
4.22E-4 |
8.95E-4 |
1.29E-5 |
3.81E-5 |
|
HS8 |
2.07E-4 |
4.39E-4 |
8.63E-6 |
2.54E-5 |
|
HS9 |
3.70E-5 |
7.84E-5 |
2.91E-6 |
8.59E-6 |
|
HS10 |
8.75E-5 |
1.86E-4 |
4.37E-6 |
1.29E-5 |
|
HS11 |
3.77E-5 |
7.99E-5 |
2.59E-6 |
7.64E-6 |
|
HS12 |
3.14E-5 |
6.66E-5 |
2.10E-6 |
6.20E-6 |
|
HS13 |
5.55E-5 |
1.18E-4 |
4.48E-6 |
1.32E-5 |
|
HS14 |
6.07E-5 |
1.29E-4 |
4.51E-6 |
1.33E-5 |
|
HS15 |
6.32E-5 |
1.34E-4 |
3.96E-6 |
1.17E-5 |
|
HS16 |
6.41E-4 |
1.36E-3 |
2.18E-5 |
6.42E-5 |
|
HS17 |
3.23E-4 |
6.84E-4 |
1.04E-5 |
3.08E-5 |
|
HS18 |
2.74E-5 |
5.81E-5 |
1.81E-6 |
5.34E-6 |
|
HS19 |
7.23E-5 |
1.53E-4 |
6.07E-6 |
1.79E-5 |
|
HS20 |
7.19E-5 |
1.53E-4 |
3.85E-6 |
1.14E-5 |
|
HS21 |
2.21E-5 |
4.69E-5 |
1.69E-6 |
4.99E-6 |
|
HS22 |
2.61E-4 |
5.53E-4 |
7.18E-6 |
2.12E-5 |
|
HS23 |
2.69E-4 |
5.71E-4 |
1.90E-5 |
5.61E-5 |
Table 10: Total Likely Cancer Risk (TCR)
Limitations and Future Perpectives
It is important to acknowledge the limitations of this study. First, this research primarily focused on a specific geographical area, which might limit the generalizability of our findings to broader regions. To overcome this limitation, future research could involve multi-site studies across diverse environments. Additionally, this study predominantly employed traditional water quality assessment methods, and although they provided valuable insights, integrating advanced technologies such as sensor networks or remote sensing could enhance the accuracy and timeliness of our assessments.
Furthermore, the temporal scope was limited to a specific time frame, and future work could explore long-term trends and the impact of seasonal variations on water quality. Lastly, the study recognizes the importance of incorporating stakeholder engagement and community-based participatory research approaches to better understand local concerns and promote sustainable water management practices.
Conclusion
The research has uncovered a pressing need for public health concern within the Kumasi Metropolis, Ghana, in terms of household water quality. Significant findings with possible consequence on human health concerns were identified, notably the alarming presence of excessive levels of copper (Cu) and lead (Pb) alongside the widespread distribution of nitrite ions (NO2-) in specific water sources.
These findings not only raise serious concerns but also demand immediate attention and action from both local authorities and the broader scientific community. The levels of Cu, Pb, and NO - highlights the potential detrimental effects on consumers, with Household 17, in particular, likely to pose significant health risks, especially to children because of high levels of NO - .
Furthermore, microbial assessment revealed the presence of harmful microbes, and high microbial load which could increase likelihood of waterborne illnesses and infections, particularly for individuals with weakened immune systems, infants, and the elderly, further emphasizing the urgency of implementing effective water treatment processes, robust monitoring programs, and public awareness campaigns.
Multicollinearity and regression analysis revealed that sampling sites, on their own, may not significantly explain variations in water quality parameters. Instead, other factors, such as storage conditions, anthropogenic sources, environmental conditions, or temporal variations, are likely more substantial water quality determinants in the sampling sites. Strengthening regulations and investing in water supply infrastructure improvements are imperative steps forward.
In essence, the research offers a unique perspective on the public health implications of household water sources in Kumasi Metropolis, Ghana, emphasizing not only the gravity of the issue but also the actionable steps needed to mitigate these concerns. By addressing these challenges, Kumasi Metropolis and Ghana can safeguard the well-being of their population and serve as a model for regions facing similar water quality challenges. There is the need for a continued research and intervention in ensuring access to safe drinking water and promoting a healthier future for all.
Statements and Declarations
Conflict of Interest
The authors declare that there is no conflict of interest regarding the publication of this article
Consent for Publication
All authors carefully read and approved the study.
Data Availability
The data that support the findings of this study are available from the corresponding author upon reasonable request
Authors Contribution
J.A- Conceptualization, project administration, investigation, formal analysis, Data curation, methodology, editing and reviewing, writing-original draft. M.Y.P- formal analysis, methodology, data curation, writing—original draft. A.G.Y, A.L.S, A.A.A, E.A.D, I.K and A.A.A-methodology, data curation, writing—original draft. Y.D.T- data curation, editing, writing—original draft. J.S- GIS curation, writing-original draft. K.A.O-GIS, mapping, study area design. F.O, D.A- data curation, formal analysis, writing-original draft and editing. O.A: supervision, project administration, writing- All the authors reviewed the manuscript.
References
- Mazhar, M. A., Khan, N. A., Ahmed, S., Khan, A. H., Hussain, A., Changani, F., ... & Vambol, V. (2020). Chlorination disinfection by-products in municipal drinking water–a review. Journal of Cleaner Production, 273, 123159.
- Baghel, V. S., Gopal, K., Dwivedi, S., & Tripathi, R. D. (2005). Bacterial indicators of faecal contamination of the Gangetic river system right at its source. Ecological Indicators, 5(1), 49-56.
- Tulchinsky, T. H. (2018). John Snow, cholera, the broad street pump; waterborne diseases then and now. Case studies in public health, 77.
- Takavada, I., Hoko, Z., Gumindoga, W., Mhizha, A., Nuttinck, J. Y., Faure, G., & Malik, D. (2022). An assessment on the effectiveness of the sanitary seal in protecting boreholes from contamination: A case of Mbare Suburb, Harare. Physics and Chemistry of the Earth, Parts A/B/C, 126, 103107.
- Agbasi, J. C., Chukwu, C. N., Nweke, N. D., Uwajingba, H. C., Khan, M. Y. A., & Egbueri, J. C. (2023). Water pollution indexing and health risk assessment due to PTE ingestion and dermal absorption for nine human populations in Southeast Nigeria. Groundwater for Sustainable Development, 21, 100921.
- Martínez-Oviedo, A., Monterrubio-Martínez, E., & Tuxpan- Vargas, J. (2024). Assessing the water contaminants in San Luis Potosi and its effects on its inhabitants: An interdisciplinary study on environmental contamination and public health. Journal of Hazardous Materials, 464, 132828.
- Obasi, P. N., & Akudinobi, B. B. (2020). Potential health risk and levels of heavy metals in water resources of lead–zinc mining communities of Abakaliki, southeast Nigeria. Applied Water Science, 10(7), 1-23.
- Matsa, M. M., Chokuda, F., Mupepi, O., & Dzawanda, B. (2021). An assessment of groundwater quality in Zimbabwe’s urban areas: case of Mkoba 19 suburb, Gweru. Environmental Monitoring and Assessment, 193, 1-15.
- Pal, M., Ayele, Y., Hadush, M., Panigrahi, S., & Jadhav, V. J. (2018). Public health hazards due to unsafe drinking water. Air Water Borne Dis, 7(1000138), 2.
- Hussain, S., & Reza, M. (2023). Environmental damage and global health: understanding the impacts and proposing mitigation strategies. Journal of Big-Data Analytics and Cloud Computing, 8(2), 1-21.
- Ogundiran, O. O., & Afolabi, T. A. (2008). Assessment of the physicochemical parameters and heavy metals toxicity of leachates from municipal solid waste open dumpsite. International Journal of Environmental Science & Technology, 5, 243-250.
- Wakawa, R. J., Uzairu, A., Kagbu, J. A., & Balarabe, M.L. (2010). Seasonal variation assessment of impact of industrial effluents on physicochemical parameters of surface water of River Challawa, Kano, Nigeria. Toxicological & Environmental Chemistry, 92(1), 27-38.
- Bozorg-Haddad, O., Delpasand, M., & Loáiciga, H. A. (2021). Water quality, hygiene, and health. In Economical, political, and social issues in water resources (pp. 217-257). Elsevier.
- Abdullah, M., Riaz, A., Rafique, M. A., Baig, H., Nawaz, S., Shah, M. T., ... & Yaseen, G. (2022). Water contamination and its effects on humans: A review. NeuroQuantology, 20(15), 188-201.
- Nazneen, S., Raju, N. J., Madhav, S., & Ahamad, A. (2019). Spatial and temporal dynamics of dissolved nutrients and factors affecting water quality of Chilika lagoon. Arabian Journal of Geosciences, 12, 1-23.
- Kanownik, W., Policht-Latawiec, A., & FudaÅ?a, W. (2019). Nutrient pollutants in surface water—Assessing trends in drinking water resource quality for a regional city in Central Europe. Sustainability, 11(7), 1988.
- Shuval, H. I., & Gruener, N. (2013, January). Infant methemoglobinemia and other health effects of nitrates in drinking water. In Proceedings of the Conference on Nitrogen as a Water Pollutant (pp. 183-193). Pergamon.
- Morran, J., Whittle, M., Fabris, R. B., Harris, M., Leach, J. S., Newcombe, G., & Drikas, M. (2011). Nitrosamines from pipeline materials in drinking water distribution systems. Journalâ?American Water Works Association, 103(10), 76-83.
- Abba, S. I., Egbueri, J. C., Benaafi, M., Usman, J., Usman, A. G., & Aljundi, I. H. (2023). Fluoride and nitrate enrichment in coastal aquifers of the Eastern Province, Saudi Arabia: The influencing factors, toxicity, and human health risks. Chemosphere, 336, 139083.
- Akhtar, N., Syakir Ishak, M. I., Bhawani, S. A., & Umar, K. (2021). Various natural and anthropogenic factors responsible for water quality degradation: A review. Water, 13(19), 2660.
- Dahiya, V. (2022). Heavy metal toxicity of drinking water: A silent killer. GSC Biological and Pharmaceutical Sciences, 19(1), 020-025.
- Rahaman, M. S., Rahman, M. M., Mise, N., Sikder, M.T., Ichihara, G., Uddin, M. K., ... & Ichihara, S. (2021). Environmental arsenic exposure and its contribution to human diseases, toxicity mechanism and management. Environmental Pollution, 289, 117940.
- Rahimzadeh, M. R., Rahimzadeh, M. R., Kazemi, S., & Moghadamnia, A. A. (2017). Cadmium toxicity and treatment: An update. Caspian journal of internal medicine, 8(3), 135.
- Ungureanu, E. L., & Mustatea, G. (2022). Toxicity of heavy metals. In Environmental impact and remediation of heavy metals. IntechOpen.
- Artiola, J. F., Rock, C., & Fix, G. (2012). Water storage tank disinfection, testing, and maintenance.
- Berhe, A. A., Aregay, A. D., Abreha, A. A., Aregay, A. B.,Gebretsadik, A. W., Negash, D. Z., ... & Mamo, N. B. (2020). Knowledge, attitude, and practices on water, sanitation, and hygiene among rural residents in Tigray Region, Northern Ethiopia. Journal of Environmental and Public Health, 2020(1), 5460168.
- Martel, K. D., Kirmeyer, G. J., Murphy, B. M., Noran, P. F., Kirby, L., Lund, T. W., ... & Caprara, M. (2002). Preventing water quality deterioration in finished water storage facilities. Journalâ?American Water Works Association, 94(4), 139-148.
- Jonathan, A., Peasah, M. Y., Yaw, A. G., Duodu, T. Y., Antwi,S. A., Stephen, A. L., ... & Akoto, O. (2023). Public Health Implications of Household Water Sources in the Kumasi Metropolis, Ghana. A Case Study.
- Boateng, T. K., Opoku, F., & Akoto, O. (2019). Heavy metal contamination assessment of groundwater quality: a case study of Oti landfill site, Kumasi. Applied water science, 9(2), 33.
- Kwang, C., Twumasi, Y. D., Boakye, L., Oppong-Twum, J. E., & Agyei-Frimpong, S. (2017). Optimal Landfill Sites for Kumasi Metropolis using Geographic Information Systems and Multi Criteria Decision Analysis. Geoinfor Geostat: An Overview 5: 4. of, 5, 2.
- Abane, A. M. (2011). Travel behaviour in Ghana: empirical observations from four metropolitan areas. Journal of Transport Geography, 19(2), 313-322.
- Rice, E. W., Baird, R. B., Eaton, A. D., & Clesceri, L. S. (2012). Standard methods for the examination of water and wastewater.
- Peasah, M. Y., Awewomom, J., Osae, R., & Agorku, E.S. (2024). Trace elements determination and health risk assessment of groundwater sources in Kumasi Metropolis, Ghana. Environmental Monitoring and Assessment, 196(9), 857.
- Ahmed, T., Baidya, S., Acharjee, M., & Rahman, T. (2013). Qualitative analysis of drinking water through the most probable number (MPN) method. Stamford Journal of Microbiology, 3(1), 9-16.
- ASSESSment, E. R. P. R. (1989). Guidance for superfund. Human Health Evaluation Manual (Part a), Interim Final, 11989.
- Fakhri, Y., Saha, N., Ghanbari, S., Rasouli, M., Miri, A., Avazpour, M., ... & Khaneghah, A. M. (2018). Carcinogenic and non-carcinogenic health risks of metal (oid) s in tap water from Ilam city, Iran. Food and chemical toxicology, 118, 204- 211.
- Qu, L., Huang, H., Xia, F., Liu, Y., Dahlgren, R. A., Zhang, M., & Mei, K. (2018). Risk analysis of heavy metal concentration in surface waters across the rural-urban interface of the Wen- Rui Tang River, China. Environmental pollution, 237, 639- 649.
- Qasemi, M., Farhang, M., Biglari, H., Afsharnia, M., Ojrati, A., Khani, F., ... & Zarei, A. (2018). Health risk assessments due to nitrate levels in drinking water in villages of Azadshahr, northeastern Iran. Environmental Earth Sciences, 77, 1-9.
- Nkpaa, K. W., Amadi, B. A., & Wegwu, M. O. (2018). Hazardous metals levels in groundwater from Gokana, Rivers State, Nigeria: non-cancer and cancer health risk assessment. Human and Ecological Risk Assessment: An International Journal, 24(1), 214-224.
- Wongsasuluk, P., Chotpantarat, S., Siriwong, W., & Robson, M. (2014). Heavy metal contamination and human health risk assessment in drinking water from shallow groundwater wells in an agricultural area in Ubon Ratchathani province, Thailand. Environmental geochemistry and health, 36, 169- 182.
- Razzaghi, N., Ziarati, P., Rastegar, H., Shoeibi, S., Amirahmadi, M., Conti, G. O., ... & Khaneghah, A. M. (2018). The concentration and probabilistic health risk assessment of pesticide residues in commercially available olive oils in Iran. Food and chemical toxicology, 120, 32-40.
- Ezugwu, C. K., Onwuka, O. S., Egbueri, J. C., Unigwe, C. O., & Ayejoto, D. A. (2019). Multi-criteria approach to water quality and health risk assessments in a rural agricultural province, southeast Nigeria. HydroResearch, 2, 40-48.
- Briki, M., Zhu, Y., Gao, Y., Shao, M., Ding, H., & Ji, H. (2017). Distribution and health risk assessment to heavy metals near smelting and mining areas of Hezhang, China. Environmental monitoring and assessment, 189, 1-19.
- Jonathan, A., Opoku, F., & Akoto, O. (2023). Health risk assessment, bioaccumulation factors and ecological indices of heavy metals in sediment, fish and water along asuoyeboah river, Kumasi: a case study. Chemistry Africa, 6(2), 1103- 1115.
- Jehan, S., Ullah, I., Khan, S., Muhammad, S., Khattak, S. A., & Khan, T. (2020). Evaluation of the Swat River, Northern Pakistan, water quality using multivariate statistical techniques and water quality index (WQI) model. Environmental Science and Pollution Research, 27, 38545-38558.
- Akter, T., Jhohura, F. T., Akter, F., Chowdhury, T. R., Mistry,S. K., Dey, D., ... & Rahman, M. (2016). Water Quality Index for measuring drinking water quality in rural Bangladesh: a cross-sectional study. Journal of Health, Population and Nutrition, 35, 1-12.
- Appiah-Opong, R., Ofori, A., Ofosuhene, M., Ofori-Attah, E., Nunoo, F. K., Tuffour, I., ... & Fosu-Mensah, B. Y. (2021). Heavy metals concentration and pollution index (HPI) in drinking water along the southwest coast of Ghana. Applied Water Science, 11, 1-10.
- Mohod, C. V., & Dhote, J. (2013). Review of heavy metals in drinking water and their effect on human health. International Journal of Innovative Research in Science, Engineering and Technology, 2(7), 2992-2996.
- Ashish, B., Neeti, K., & Himanshu, K. (2013). Copper toxicity: a comprehensive study. Research Journal of Recent Sciences ISSN, 2277, 2502.
- CzÅ?onkowska, A., Litwin, T., Dusek, P., Ferenci, P., Lutsenko, S., Medici, V., ... & Schilsky, M. L. (2018). Wilson disease. Nature reviews Disease primers, 4(1), 21.
- Ara, A., & Usmani, J. A. (2015). Lead toxicity: a review.Interdisciplinary toxicology, 8(2), 55.
- Ondieki, J. K., Akunga, D. N., Warutere, P. N., & Kenyanya,O. (2021). Bacteriological and physico-chemical quality of household drinking water in Kisii Town, Kisii County, Kenya. Heliyon, 7(5).
- Singh, R. (2011). Chapter-4-Water chemistry & characteristics. National Institute of Hydrology.
- Appiah-Effah, E., Ahenkorah, E. N., Duku, G. A., & Nyarko, K. B. (2021). Domestic drinking water management: quality assessment in Oforikrom municipality, Ghana. Science Progress, 104(3), 00368504211035997.
- World Health Organization. (2008). Guidelines for Drinking- Water Quality, Incorporating the First and Second Addenda. Volume 1: Recommendations. Geneva: World Health Organization.
- Gyamfi, E. T., Ackah, M., Anim, A. K., Hanson, J. K., Kpattah,L., Enti-Brown, S., ... & Nyarko, E. S. (2012). Chemical analysis of potable water samples from selected suburbs of Accra, Ghana. Proceedings of the international academy of ecology and environmental sciences, 2(2), 118.
- Safo-Adu, G. (2022). Water quality index model application in evaluation of groundwater quality in a waste treatment facility. International Journal of Sustainable Engineering, 15(1), 286-298.
- Corwin, D. L., & Yemoto, K. (2020). Salinity: Electrical conductivity and total dissolved solids. Soil science society of America journal, 84(5), 1442-1461.
- Saana, S. B. B. M., Fosu, S. A., Sebiawu, G. E., Jackson, N., & Karikari, T. (2016). Assessment of the quality of groundwater for drinking purposes in the Upper West and Northern regions of Ghana. SpringerPlus, 5, 1-15.
- Mohamed, H., Brown, J., Njee, R. M., Clasen, T., Malebo,H. M., & Mbuligwe, S. (2015). Point-of-use chlorination of turbid water: results from a field study in Tanzania. Journal of water and health, 13(2), 544-552.
- Yeboah, S. I. I. K., Antwi-Agyei, P., & Domfeh, M. K. (2022). Drinking water quality and health risk assessment of intake and point-of-use water sources in Tano North Municipality, Ghana. Journal of Water, Sanitation and Hygiene for Development, 12(2), 157-167.
- Tam, Y. S., & Elefsiniotis, P. (2009). Corrosion control in water supply systems: Effect of pH, alkalinity, and orthophosphate on lead and copper leaching from brass plumbing. Journal of Environmental Science and Health Part A, 44(12), 1251- 1260.
- Zanacic, E., Stavrinides, J., & McMartin, D. W. (2016). Field- analysis of potable water quality and ozone efficiency in ozone-assisted biological filtration systems for surface water treatment. Water Research, 104, 397-407.
- Manjare, S. A., Vhanalakar, S. A., & Muley, D. V. (2010). Analysis of water quality using physicochemical parameters Tamdalge tank in Kolhapur district, Maharashtra. International journal of advanced biotechnology and research, 1(2), 115- 119.
- Dongzagla, A., Jewitt, S., & O'Hara, S. (2019). Assessment of fluoride concentrations in drinking water sources in the Jirapa and Kassena-Nankana Municipalities of Ghana. Groundwater for sustainable development, 9, 100272.
- Bowan, P. A. (2022). Evaluation of borehole water quality in Bole District, Ghana. Journal of Multidisciplinary Engineering Science and Technology (JMEST), 9(7).
- Buzalaf, M. A. R., & Levy, S. M. (2011). Fluoride intake of children: considerations for dental caries and dental fluorosis. Monographs in oral science, 22, 1-19.
- NujiÄ?, M., & Habuda-StaniÄ?, M. (2017). Nitrates and nitrites,metabolism and toxicity.
- Panneerselvam, B., Muniraj, K., Duraisamy, K., Pande, C., Karuppannan, S., & Thomas, M. (2023). An integrated approach to explore the suitability of nitrate-contaminated groundwater for drinking purposes in a semiarid region of India. Environmental Geochemistry and Health, 45(3), 647- 663.
- Barakat, A., Meddah, R., Afdali, M., & Touhami, F. (2018). Physicochemical and microbial assessment of spring water quality for drinking supply in Piedmont of Béni-Mellal Atlas (Morocco). Physics and Chemistry of the Earth, Parts A/b/c, 104, 39-46.
- Sharma, S., & Bhattacharya, A. J. A. W. S. (2017). Drinking water contamination and treatment techniques. Applied water science, 7(3), 1043-1067.
- Wen, X., Chen, F., Lin, Y., Zhu, H., Yuan, F., Kuang, D., ... & Yuan, Z. (2020). Microbial indicators and their use for monitoring drinking water quality—A review. Sustainability, 12(6), 2249.
- Aulya, W., Fadhliani, F., & Mardina, V. (2020). Analysis of coliform and colifecal total pollution test on various types of drinking water using the MPN (most probable number) method. Serambi Journal of Agricultural Technology (SJAT), 2(2), 64-72.
- Lutterodt, G., Miyittah, M. K., Addy, B., Ansa, E. D., & Takase, M. (2021). Groundwater pollution assessment in a coastal aquifer in Cape Coast, Ghana. Heliyon, 7(4).
- Sawyerr, H. O., Oluwaseun, O. E., Asabi, O. S., & Olalekan,R. M. (2019). Bacteriological assessment of selected hand dug wells in students’ residential area: A case study of osun state college of health technology, Ilesa, Nigeria. Global Scientific Journal, 7(1).
- Sehar, S., Naz, I., Ali, M. I., & Ahmed, S. (2011). Monitoring of physico-chemical and microbiological analysis of under ground water samples of district Kallar Syedan, Rawalpindi- Pakistan. Research Journal of Chemical Sciences ISSN, 2231, 606X.
- Leclerc, H., & Moreau, A. (2002). Microbiological safety of natural mineral water. FEMS Microbiology Reviews, 26(2), 207-222.
- Nyamekye, E. (2013). An investigation into quality of water from private hand dug wells sited in close proximity to on-site sanitation systems in households of small towns: A case study of Kintampo municipality in Brong-Ahafo Region, Ghana (Doctoral dissertation).
- Salamandane, A., Vila-Boa, F., Malfeito-Ferreira, M., & Brito, L. (2021). High fecal contamination and high levels of antibiotic-resistant Enterobacteriaceae in water consumed in the city of Maputo, Mozambique. Biology, 10(6), 558.
- Kyriazos, T., & Poga, M. (2023). Dealing with multicollinearity in factor analysis: the problem, detections, and solutions. Open Journal of Statistics, 13(3), 404-424.
- Gregorich, M., Strohmaier, S., Dunkler, D., & Heinze,G. (2021). Regression with highly correlated predictors: variable omission is not the solution. International journal of environmental research and public health, 18(8), 4259.
- Arhin, T. Y., Jonathan, A., Opoku, F., Tandoh, M. A., Amankwah, E. A., & Akoto, O. (2023). Exposure and health risk assessment of transition metals in rice found on the Ghanaian market. Environmental Monitoring and Assessment, 195(5), 587.
- Umbreit, J. (2007). Methemoglobinit's not just blue: a concise review. American journal of hematology, 82(2), 134-144.