


Review Article - (2019) Volume 4, Issue 4
Importance of Agriculture Intervention in Improving Nutritional Status of Women and Children: An Indian Scenario
2Ph.D Scholar, CCAS, MPUAT, Udaipur, India
Received Date: Jun 11, 2019 / Accepted Date: Jul 28, 2019 / Published Date: Aug 26, 2019
Copyright: ©Nikita Wadhawan. This is an open-access article distributed under the terms of the Creative Commons Attribution License, which permits unrestricted use, distribution, and reproduction in any medium, provided the original author and source are credited.
Abstract
Agriculture is the process of producing food, feed, fiber and many other desired products by the cultivation of certain plants and the raising of domesticated animals (livestock). The practice of agriculture is also known as “farming”, while scientists, inventors and others devote to improving farming methods and implements are also said to be engaged in agriculture. Subsistence farming is one in which the farmer farms a small area with limited resource inputs and produces only enough food to meet the needs of his/her family. To ensure good health and wellbeing, good nutrition is the key.
Introduction
Agriculture is the process of producing food, feed, fiber and many other desired products by the cultivation of certain plants and the raising of domesticated animals (livestock). The practice of agriculture is also known as “farming”, while scientists, inventors and others devote to improving farming methods and implements are also said to be engaged in agriculture. Subsistence farming is one in which the farmer farms a small area with limited resource inputs and produces only enough food to meet the needs of his/her family. To ensure good health and wellbeing, good nutrition is the key. Despite of various developments, lack of access to nutritious foods, negatively impact the health of women and children. Among the reasons advanced for the poor nutritional status of Indian women, an enduring explanation relates to the intra-household status of women. Several indicators of women’s status in the literature consistently rank women in the countries of South Asia as lower in comparison to their counterparts in Asia, Africa, Latin America and the Caribbean [1]. These indicators are used to measure nutritional imbalance resulting in under-nutrition (assessed from underweight, wasting and stunting) and overweight. Child growth is internationally recognized as an important indicator of nutritional status and health in populations.
Achieving the Sustainable Development Goals (SDGs) related to food and nutrition will security requires translating agricultural and food production into nutrition security for whole populations. This basic tenet drives the recent search for strategic approaches to improving agriculture-nutrition linkages in developing countries [2]. The agriculture sector, therefore, also has an essential role in improving health outcomes. Agriculture and nutrition share a common entry point: “food.”Food is a key outcome of agricultural activities, and, in turn, is a key input into good nutrition. Collectively, malnutrition is responsible for more ill health than any other cause-good health is not possible without good nutrition. Without agriculture there is little food or nutrition, but availability of food from agriculture doesn’t ensure good nutrition. Common sense would utter a reinforcing relationship between the two fields of agriculture and nutrition but, in fact, there is often a significant disconnect.
Method
This paper is based on a desk review of available literature. Studies and various reports related to nutrition indicator and agriculture intervention for different purpose have been included.
1. NutritionalIndicators
Nutritional indicators are those anthropometric measurements, clinical sign and symptoms and biochemical measures either single or combined and show short term and long term effect of nutrition and different forms of malnutrition. Most population nutritional indicators can be presented as prevalence. That is, the proportion of the population subgroup (young children, adult women, etc.) which has a specific form of malnutrition.
When presenting prevalence, the population group must always be specified because the prevalence of some forms of malnutrition, such as acute protein-energy malnutrition and anaemia, differ a great deal between age and sex specific groups. Indicators are used to measure nutritional imbalance resulting in under-nutrition (assessed from underweight, wasting and stunting) and overweight. Child growth is internationally recognized as an important indicator of nutritional status and health in populations. The selection and identification of nutrition indicators should be based on precise criteria: measurability, appropriateness, comprehensiveness, relevance, sensitivity, and impact orientation.
a. In Children
Child growth is globally accepted as an important indicator of nutritional status and health in populations. These indicators are used to measure nutritional imbalance resulting in under-nutrition (assessed from underweight, wasting and stunting) and overweight.
(i) Underweight/ low weight for age (acute or chronic malnutrition, or both). Underweight children are too light for their age. Children may become underweight either because of wasting or stunting or both. Underweight: weight for age < –2 standard deviations (SD) of the WHO Child Growth Standards median.
(ii) Wasting (acute malnutrition/ low weight-for-height). Wasted children are too light for their height (very thin). Wasting is the result of recent rapid weight loss or a failure to gain weight. Wasting can be reversed when conditions improve. Wasting: weight for height < –2 SD of the WHO Child Growth Standards median.
(iii) Stunting (chronic malnutrition) Stunted children are too short for their age. Stunting develops over a long period as a result of inadequate dietary intake and/or repeated infections. Stunting: height for age < –2 SD of the WHO Child Growth Standards median.
(iv) Overweight and obesity are defined as abnormal or excessive fat accumulation that may impair health. They are major risk factors for a number of chronic diseases, including diabetes, cardiovascular diseases and cancer. Overweight: weight for height > +2 SD of the WHO Child Growth Standards median.
(iv) Low birth weight has been defined by WHO as weight at birth of < 2500 grams (5.5 pounds).
Table 1: Cut-off values for public health significance for children
|
Indicators |
Prevalence cut-off values for public health significance |
|
Underweight |
< 10%: Low prevalence |
|
10-19%: Medium prevalence |
|
|
20-29%: High prevalence |
|
|
> 30%: Very high prevalence |
|
|
Stunting |
< 20%: Low prevalence |
|
20-29%: Medium prevalence |
|
|
30-39%: High prevalence |
|
|
>40%: Very high prevalence |
|
|
Wasting |
< 5%: Acceptable |
|
5-9%: Poor |
|
|
10-14%: Serious |
|
|
>15%: Critical |
WHO [3]
Status of Malnutrition in Children
Malnutrition rates in India remain high in comparison to other countries and regions with similar and even lower income levels. Many countries in Africa south of the Sahara and south Asia show better performance in child malnutrition indicators.
Table 2: Malnutrition in Africa south of the Sahara and South Asia
|
Region/Countries |
Stunting |
Wasting |
Underweight |
|
Africa south of Sahara[4] |
33.2 |
7.8 |
16 |
|
Nepal [5] |
36 |
10 |
27 |
|
Bangladesh [6] |
36 |
14 |
33 |
|
Sri Lanka [7] |
17 |
15 |
20.5 |
|
Pakistan [8] |
45 |
11 |
30 |
|
India (NHFS- 2015-16) |
38.4 |
21 |
35.7 |
Table 2 shows the prevalence of malnutrition in children Africa south of the Sahara and South Asia which shows the among all these countries India stands second after Pakistan having highest level of stunted childrenwhich suggests the prevalence of malnutrition amongst children is highest as compare to other countries.
Malnutrition Rates in India
Table 3: Change in prevalence of malnutrition, micronutrient deficiency and figures in India (2005-06 to 2015-16)
|
Prevalence |
NFHS-3 (2005-06) |
NFHS- 4 (2015-16) |
Percentage Change |
|
Stunting (children <5) |
48 |
38.4 |
-20.00 |
|
Wasting (children <5) |
19.8 |
21 |
6.06 |
|
Underweight (children <5) |
42.5 |
35.7 |
-16.00 |
|
Anemia (children 6- 59 months) |
69.4 |
58.5 |
-15.71 |
According to NFHS-3 and NFHS-4 for the year of 2005-06 and 2015-16 it was found that there is increased rate of wasting children from 19.8 to 21 with 6.06 % change and in the other parameters though there has been a decline but not significant. Hence it can be said that in spite of constant efforts by al there has not been much improvement and still high percentage of malnutrition exists amongst children (under 5) in India.So it becomes imperative for the policy makers to take measures for satisfactory reduction.
b. Indicatorsin women
In developing countries especially in India women make important contributions to the agricultural and rural economies. Women usually take care of household needs and most of the agricultural work.Only 63 percent of all economically active men are engaged in agriculture as compared to 78 per cent of women. Almost 50 percent of rural female workers are classified as agricultural labourers and 37% as cultivators. About 70 percent of farm work was performed by women[9]. Because of workload, lack of education and knowledge they cannot take proper nutrients so the prevalence of malnutrition amongstthem should be taken care and BMI is one measure to check it.
(i) Body Mass Index
The values for body mass index (BMI) are age-independent for adult populations and are the same for both genders. BMI may not, however, correspond to the same degree of fatness in different populations due, in part, to different body proportions. The health risks associated with increasing BMI are continuous, and the interpretation of BMI grading in relation to riskmay differ for different populations. BMI is a simple index of weight-to-height commonly used to classify underweight, overweight and obesity in adults.
BMI < 17.0 indicates moderate and severe thinness
BMI < 18.5 indicates underweight
BMI 18.5–24.9 indicates normal weight
BMI > 25.0 indicates overweight
BMI > 30.0 indicates obesity
a) Moderate and severe thinness: A BMI < 17.0 indicates moderate and severe thinness in adult populations. It has been linked to clear-cut increases in illness in adults studied in three continents and is therefore a further reasonable value to choose as a cut-off point for moderate risk. A BMI < 16.0 is known to be associated with a markedly increased risk for ill health, poor physical performance, lethargy and even death; this cut-off point is therefore a valid extreme limit.
b) Underweight: The cut-off point of 18.5 for underweight in both genders has less experimental validity as a cut-off point for moderate and severe thinness but is a reasonable value for use pending further, comprehensive studies. The proportion of the population with a low BMI that is considered a public health problem is closely linked to the resources available for correcting.
c) Abdominal obesity (AO): Abdominal obesity (AO) was defined as a waist circumference (WC) ≥ 90 cm for men and ≥ 80 cm for women with or without General Obesity
Table 4: Cut-off values for public health significance
|
Indicator |
Prevalence cut-off values for public health significance |
|
Adult BMI < 18.5 (underweight) |
5-9%: Low prevalence (warning sign, monitoring required) |
|
10-19%: Medium prevalence (poor situation) |
|
|
20-39%: High prevalence (serious situation) |
|
|
> 40%: Very high prevalence (critical situation) |
WHO [3]
(ii) Vitamin and mineral deficiencies
a) Anaemia
Anaemia is a major health problem amongst the females of reproductive age in India and the prevalence of anaemia being 52% [10]. Although iron deficiency is probably the commonest cause of anaemia, other causes include acute and chronic infections that result in inflammation and haemorrhages; deficiencies of other vitamins and minerals, especially folate, vitamin B12 and vitamin A; and genetically inherited traits, such as thalassaemia. Other conditions (malaria and other infections, genetic disorders, cancer) also play a role.
Anaemia is defined as a haemoglobin concentration below a specified cut-off point, which can change according to the age, gender, physiological status, smoking habits and altitude atwhich the population being assessed lives. WHO defines anaemia in children less than 5 years of age and pregnant women as a haemoglobin concentration < 110 g/l at sea level? The finger-prick blood sample test is easy to administer in the field. The test could be easily integrated in regular health or prenatal visit to capture all women in reproductive ages, though cost of equipment may be prohibitive
Table 5: Cut-off values of anaemia for public health significance
|
Indicator |
Prevalence cut-off values for public health significance |
|
Anaemia |
<4.9: No public health problem |
|
5.0–19.9: Mild public health problem |
|
|
20.0–39.9: Moderate public health problem |
|
|
> 40.0: Severe public health problem |
Table 5: Change in prevalence of malnutrition, micronutrient deficiency and obesity figures in India (2005-06 to 2015-16)
|
Prevalence |
NFHS-3 (2005-06) |
NFHS- 4 (2015-16) |
Percentage Change |
|
Anaemia (Women) |
55.3 |
53 |
-4.16 |
|
Women with BMI < 18.5 kg/M2 |
35.5 |
22.9 |
-35.49 |
|
Overweight Women |
12.6 |
20.7 |
64.29 |
Vitamin A deficiency
Vitamin A deficiency can be defined clinically or sub-clinically. The stages of xerophthalmia [clinical spectrum of ocular manifestations of vitamin A deficiency, from the milder stages of night blindness and Bitot spots to the potentially blinding stages of corneal xerosis, ulceration and necrosis (keratomalacia)] are regarded both as disorders and clinical indicators of vitamin A deficiency. Blood concentrations of retinol (the chemical name for vitamin A) in plasma or serum are used to assess subclinical vitamin A deficiency. A plasma or serum retinol concentration < 0.70 µmol/l indicates subclinical vitamin A deficiency in children and adults, and < 0.35 µmol/l indicates severe vitamin A deficiency.
Table 4: Cut-off values for public health significance
|
Indicator |
Prevalence cut-off values for public health significance |
|
Serum or plasma retinol |
1.9: No public health problem |
|
< 0.70 µmol/l in preschool-age children |
>2%-< 10% Mild |
|
|
> 10%-< 20%: Moderate |
|
|
> 20%: Severe |
|
Night blindness (XN) |
> 5: Moderate |
|
Pregnant women |
|
WHO [12]
(a) Iodine deficiency
This indicator allows an assessment of iodine deficiency at population level: Iodine is anessential trace element that is present on the thyroid hormones, thyroxine and triiodotyronine. It occurs most frequently in areas where there is little iodine in the diet—typically remote inland areas where no marine foods are eaten. Surveys conducted by the Central and State Health Directorates, Indian Council of Medical Research (ICMR) and medical institutes since 1950s have clearly demonstrated that IDD is a public health problem in all States and union territories in India. Of the 325 districts surveyed in India so far, 263 districts are IDD-endemic, i.e. the prevalence of IDD is above 10 per cent in the population [13].
The median urinary iodine concentration is the main indicator of iodine status in all age groups.The indicator is the median concentration of iodine in urine in a population of children aged 6–12 years. Adequate iodine nutrition is considered to pertain when the median urinary iodine concentration is 100–199 µg/l. A median urinary iodine concentration in a population of < 100 µg/l indicates that the iodine intake is insufficient. When the median is < 20 µg/l, the population is described as having severe iodine deficiency; at 20–49 µg/l, the public health problem is moderate, and at 50–99 µg/l, the population has mild iodine deficiency. A population’s median urinary iodine concentration should be at least 100 µg/l, with less than 20% of values < 50 µg/l. For pregnant women, the median urinary iodine should be 150–249 µg/l.
Table 5: Cut-off values for public health significance
|
Indicator |
Prevalence cut-off values for public health significance |
|
Iodine deficiency |
Median UI concentration: |
|
(Median UI concentration µg/l) |
< 20 µg/l: Severe deficiency |
|
|
20–49 µg/l: Moderate |
|
|
50–99 µg/l: Mild deficiency |
|
|
100–199 µg/l: Optimal |
|
|
200–299 µg/l: Risk of iodine- |
|
|
induced hyper-thyroidism |
|
|
>300 µg/l: Risk of adverse health |
|
|
consequences |
WHO [11]
(i) Health services
Beside these malnutrition indicators some other factors also play important roleaffecting the nutritional status.They are as follows:
(a) Births attended by skilled health personnel
This indicator is used in the NLIS as a proxy for access to health services and maternal care. The indicator gives the percentage of live births attended by skilled health personnel in a given period. A skilled birth attendant is an accredited health professional—such as a midwife, doctor or nurse— who has been educated and trained to proficiency in the skills needed to manage normal (uncomplicated) pregnancies, childbirth and the immediate postnatal period, and in the identification, management and referral of women and newborns for complications. Traditional birth attendants, whether trained or not, are excluded from the category of ‘skilled attendant at delivery’.
In developed countries and in many urban areas in developing countries, skilled care atdelivery is usually provided in health facilities. Births do, however, take place in various otherappropriate places, from home to tertiary referral centres, depending on availability and need. WHO does not recommend a particular setting for giving birth? Home delivery may beappropriate for normal births, provided that the person attending the delivery is suitablytrained and equipped and that referral to a higher level of care is an option.
(b )Improved drinking-water and sanitation sources
These indicators are the percentage of population with access to an improved drinking-water Improved drinking-water sources are defined in terms of the kind of technology and levels offacilities that are likely to provide safe water. Improved water sources include householdconnections, public standpipes, boreholes, protected dug wells, protected springs andrainwater collection. ‘Reasonable access’ is broadly defined asthe availability of at least 20 litres per person per day from a source within 1 kilometre of theuser’s dwelling.
Improved sanitation facilities are defined in terms of the types of technology and levels ofservices that are likely to be sanitary. Improved sanitation includes connection to a publicsewers, connection to septic systems, pour-flush latrines, simple pit latrines and ventilatedimproved pit latrines. Service or bucket latrines (from which excreta are removed manually), public latrines and open latrines are not considered to be improved sanitation.
(c) Iron and folate supplements during pregnancy
This indicator reflects the percentage of women who were given supplements of both iron andfolic acid during pregnancy. It would give information about the quality of and coverage ofperinatal medical services. Unfortunately, there are no readily available data on this indicator,which is maintained in the NLIS to encourage countries to collect and compile data on theseaspects.
The current WHO recommendation is universal supplementation with 60 mg of iron and 400 µg of folic acid daily during pregnancy, as soon as possible after the beginning ofgestation and no later than the third month and continuing for the rest of pregnancy. Whereasthere is no internationally accepted indicator for these concerns, the indicator could bedefined as the percentage of mothers who received daily iron and folic acid supplements forat least 6 months of pregnancy.
How the Nutritional Indicators should be: Ideal qualities of a nutritional indicator include:
1. Validity: It means that the indicators present an accurate and as undeviating as possible measurement of the phenomenon considered.
2. Ease and rapidity of measurement: These are qualities that are related to both the measurer and the individuals being measured. Ease of measurement for the subject is also important. If the measurement is too time consuming or, in the case of measuring the weight-for-age of a child, if it causes the child to become upset, then this can be problematic. Most invasive assessment tools, e.g. collecting information on blood levels of vitamins or vitamin markers, can be one step too far in some contexts.
3. Reproducibility: It corresponds to the indicator’s ability not to be influenced by the person or instrument measuring the data, so that the value obtained will be the same whatever the operator, the place or the measurement instrument. Reproducibility guarantees that an indicator can be measured at repeated intervals in a comparable manner - a quality which is crucial when using the indicator to assess and monitor the situation. For instance, indicators like weight for height are less influenced by a measurer who does not have high-quality skills; on the other hand, even though indicators which require laboratory assessment, e.g. haemoglobin levels, markers for niacin status, are not so prone to inter-individual measurer error, however, high quality skills are needed to take these measurements.
4. Costs and training requirements : Costs of collecting information on various indicators do not just depend upon the equipment needed to take measurements but also on the time it takes to collect the information, salaries of enumerators, infrastructure in the area where the information is being collected, dispersal of population, etc. For example, assessing MUAC is likely to be cheaper than assessing weight-for-height. The former involves using a light and fairly cheap tape, while the latter requires weighing scales and a standio-meter (to measure height), which also need some form of transport. Costs increase further when blood or urine samples are needed: they need to be refrigerated and usually transported long distances to a laboratory [14].
ii. Agricultural and food-based interventions to improve nutrition
Agriculture and food are the foundations of good nutrition. They make contributions to good nutrition through what people eat. Knowledge, attitudes, practices and resources affect the quantity of food consumed and the quality of diets. These elements of individual choice and circumstance mean that nutrition education and communication are fundamental to almost every investment that aims to improve nutrition.
There are three main ways through which agriculture influence the nutritional status of individuals:
(1) Increased incomes and lower food prices, which permit increased food consumption
(2) Effects on the health andsanitation environment at the household and communitylevels, whichmay increase or reducemorbidity; and (3) Effects on time allocation patterns particularly of mothers which may reduce time spent on nurturing activities – time that is often related to women’s control over household income and is an important determinant of woman’s nutritional status [15].
In a study in India conducted by on linkages between nutrition and household incomes, as well as agricultural production, showed that the income gradient for under nutrition is indeed quite weak, although non-income determinants such as female secondary education, access to safe water and sanitation facilities, antenatal check-ups, and children’s vaccinations all have significant effects on child nutrition [16]. It also found some evidence that agricultural production conditions particularly irrigation and ownership of live stock substantially influenced household dietary diversity. The UNICEF framework, illustrating pathways, was built on the understanding ‘food alone is not enough’ and it has conceptualized linkages between agriculture and nutrition. Subsequently these linkages have been modified for specific pathways and to generate testable hypotheses, as following [17,18]:
1. Source of food: Agricultural produce by the farmers is also used for their own household food consumption.
2. Source of income of households engaged in agriculture, for food and non-food expenses:Agricultural income may be earned either through wages earned as agricultural workers or through the sale of produce. The income spent on nutritious food may have impact on malnutrition.
3. Agricultural policy and food prices: Agricultural policies can affect the relative prices and affordability of various marketed food and non-food crops.
4. Women in agriculture and their socio-economic status: The socio-economic status of women in intra-household decision making and resource allocation may influence the nutritional status of the mothers and their children.
5. Maternal employment in agriculture, child care and feeding: The involvement of mothers in agriculture may influence their ability to manage child care and feeding.
6. Women in agriculture, maternal nutrition, and health status: The maternal nutritional outcomes and health may be compromised due to involvement in agriculture. The work-related energy expenditure may exceed the intake, or the dietary diversity may be compromised. Some of the agricultural practices may be hazardous to their health. These factors, consequently, affect the nutritional status of the children.
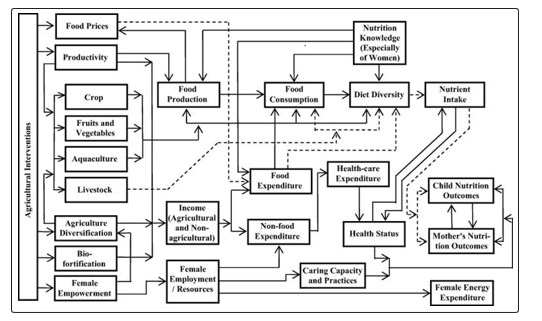
Figure 1: Agriculture and Nutrition Pathway Source [19]
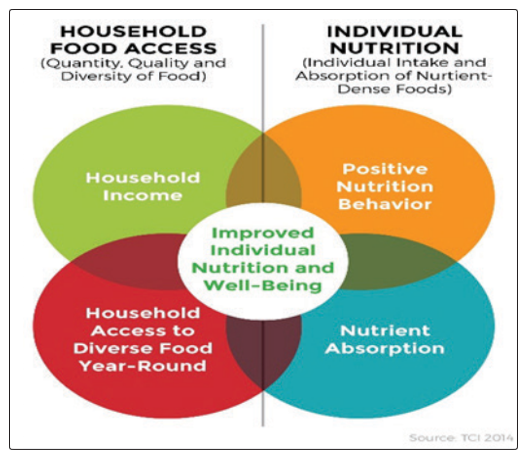
Figure 2: Household Food Access and Individual Nutrition Source [20]
These pathways as shown in Agriculture and Nutrition pathway (Figure 1) and Household Food Access and Individual Nutrition (Figure 2) are considerably influenced by different factors such as the type of agriculture, market and consumer demands, inequalities in the system, tastes and preferences, and nutrition-relevant policies and programmes. Therefore, the pathways from agriculture to nutrition are evolving and dynamic; and are not linearly associated [18,21].
Conclusion
India’s slow progress in deal with hunger and malnutrition is of grave concern, revealing the challenge of meeting the Sustainable Development Goal (SDG) 2 of eradicating hunger and malnutrition by the year 2030. To understand the nature and pattern of malnutrition in India, indicators of nutrition should be true, reliable.Measures must be evidence based, implemented at scale, and include both broad based and targeted actions aimed at the most nutritionally vulnerable people. The evidence to support such actions is growing, but it is already plentiful and compelling; there is no need for delay. The rapidly escalating threats posed by malnutrition represent a planetary challenge on at par with poverty and climate change. National and global evidence shows that ensuring an adequate food supply is still an important contribution to eradicating hunger. An appropriate response at the required scale is top priority for decision makers at national level and globally.
Recommendations
• Allow each communityto addressits own unique nutrition education needs;
• Ensure local wellness policies are implemented and evaluated.
• Consumers ultimately determine what they eat and therefore what the food system produces.But governments, international organizations, the private sector and civil society can all help consumers make healthier decisions, reduce waste andcontribute to the sustainable use of resources, by providing clear, accurate information and ensuring access to diverse and nutritious foods.
• Expand early childhood education programs that stimulate cognitive development and address nutrition. This can help offset developmental delays caused by under-nutrition.
References
- Haddad, Lawrence (1999) Women’s Status: Levels, Determinants, Consequences for Malnutrition, Interventions, and Policy.Asian Development Review 17: 96-131.
- Máirtín S McDermott, Madalyn Oliver, Alexander Svenson, Thomas Simnadis, Eleanor J Beck, et al. (2015) The theory of planned behaviour and discrete food choices: a systematic review and meta-analysis. International Journal of Behavioral Nutrition and Physical Activity 12: 162.
- WHO (1995) Physical status: the use and interpretation of anthropometry. Report of a WHO ExpertCommittee. World Health Organization. Technical Report Series. Geneva No. 854.
- South Africa Demographic and Health Survey (2016) Report, National Department of Health (NDoH), Statistics South Africa (Stats SA), South African Medical Research Council (SAMRC), and ICF Published by National Department of Health, Civitas Building, Corner Struben and Thabo Sehume Streets, PRETORIA 0001 www.health.gov.za.
- Nepal Demographic And Health Survey (2016) Ministry of Health Ramshah Path, Kathmandu Nepal New ERA Kathmandu, Nepal The DHS Program ICF Rockville, Maryland, USA.
- Bangladesh Demographic And Health Survey (2014) National Institute of Population Research and Training Ministry of Health and Family Welfare Dhaka, Bangladesh Mitra and Associates Dhaka, Bangladesh The DHS Program ICF International Rockville, Maryland, USA.
- Sri Lanka Demographic and Health Survey (2016) Department of Census and Statistics Ministry of National Policies and Economic Affairs Health Sector Development Project Ministry of Health, Nutrition and Indigenous Medicine.
- Pakistan Demographic and Health Survey (2013) 2012-13 National Institute of Population Studies Islamabad, Pakistan MEASURE DHS ICF International Calverton, Maryland, USA.
- E. Krishna Rao (2006) “Role of Women in Agriculture: A Micro Level Study,” Journal of Global Economy, Research Centre for Social Sciences,Mumbai, India 2: 107-118.
- Rita Panyang, AnjuBarhaiTeli, SidharthaProtimSaikia (2018) Prevalence of anemia among the women of childbearing age belonging to the tea garden community of Assam, India: A community-based study. J Family Med Prim Care 7: 734-738.
- WHO (2018) Worldwide prevalence of anaemia 1993-2005 WHO Global Database on Anaemia. Geneva, World Health Organizationhttp://whqlibdoc.who.int/publications/2008/9789241596657_eng.pdf.
- WHO (2009) Global prevalence of vitamin A deficiency in populations at risk 1995–2005. WHO. Global Database on Vitamin A Deficiency. Geneva, World Health Organization. http://whqlibdoc.who.int/publications/2009/9789241598019_ eng.pdf.
- Ministry of Health and Family Welfare, Government of India; 2011. Department of Health and Family Welfare. Annual Report 2010-2011.
- Charles Larson and Alec Mercer (2004) Global health indicators: an overview CMAJ 171: 1199-1200.
- Kennedy E, Bouis H (1993) Linkages between agriculture and nutrition: implications for policy and research. Washington DC. International Food Policy Research Institute (IFPRI).
- Bhagowalia P, Headey D, Kadiyala S (2012) Agriculture, Income, and Nutrition Linkages in India. The International Food Policy Research Institute, IFPRI Discussion Paper 01195.
- Headey D, Chiu A, Kadiyala S (2012) Agriculture’s role in the Indian enigma: Help or hindrance to the crisis of undernutrition? Food Security 4: 87-102.
- Kadiyala S, Harris J, Headey D, Yosef S, Gillespie S (2014) Agriculture and nutrition in India: mapping evidence to pathways. Ann. N.Y. Acad. Sci 1331: 43-56.
- https://www.ncbi.nlm.nih.gov/core/lw/2.0/html/
- Pingali P, Ricketts KD (2014) Mainstreaming nutrition metrics in household surveys-toward a multidisciplinary convergence of data systems. Annals of the New York Academy of Sciences1331: 249-257.
- Bhatia R, Blanton C, Brennan M, Garzon C, Phelan M, et al. (2004) Emergency Nutrition Assessment of Crisis Affected Populations Darfur Region, Sudan. CDC and WFP p.47.