
International Journal of Women's Health Care(IJWHC)
ISSN: 2573-9506 | DOI: 10.33140/IJWHC
Impact Factor: 1.011

Research Article - (2021) Volume 6, Issue 3
Hematological Characteristics During the Third Trimester of Pregnancy in a Population of Low and High Socio-Economic Levels in Lubumbashi
2Department of biomedical sciences, Faculty of Medicine, University of Lubumbashi, Lubumbashi, Democratic, Republic of the Congo
Received Date: Jun 28, 2021 / Accepted Date: Jul 12, 2021 / Published Date: Jul 19, 2021
Copyright: ©Chola Mwansa Joseph, et al. This is an open-access article distributed under the terms of the Creative Commons Attribution License, which permits unrestricted use, distribution, and reproduction in any medium, provided the original author and source are credited.
Citation: Chola Mwansa Joseph, Mwembo Tambwe Albert, Ngwe Thaba Jules, Kapya Mukeya Gabriel, Munkana Ndudula Arthur, Cham Lubamba Chamy, Kinenkinda Kalume Xavier, Kakudji Luhete Prosper, Kakoma Sakatolo Zambeze Jean-Baptiste, Kalenga Muenze Kayamba Prosper. (2021). Hematological Characteristics During the Third Trimester of Pregnancy in a Population of Low and High Socio-Economic Levels in Lubumbashi. Int J Women's Health Care, 6(3): 190-196.
Abstract
Background: During pregnancy, many hematologic changes occur to meet the demands of the developing fetus. The objective of this study was to describe the hematological characteristics in the third trimester in a population of low and high socioeconomic levels in Lubumbashi, in relation to the WHO and China reference values.
Methodology: A descriptive cross-sectional observational study was carried out in Lubumbashi, among pregnant women received during the third trimester antenatal consultations in apparent good health. A total of 128 pregnant women with a monofetal pregnancy of at least 27 weeks of amenorrhea in apparent good health were selected and divided into two groups of low and high socioeconomic levels. Blood was drawn and analyzed on the CYANHEMATO machine.
Results: Hemoglobin (HB) averages were 9.63 ± 1.52 and 11.19 ± 1.07 g / dl respectively in the low and high socioeconomic levels population. The majority of patients in the two populations were in the reference range for red blood cell (RBC) count from 2.75 to 4.64 1012 / l. The average values of hematocrit (HCT), mean corpuscular volume (MCV) and mean corpuscular hemoglobin (MCH) in Lubumbashi were lower than in the China population : 28.39 ± 4.21 versus 32.47 ± 3.46% ; 67.34 ± 9.50 versus 74.38 ± 8.15 fl and 22.96 ± 3.56 versus 25.71 ± 3.23 pg for reference values of 36% ; 90.8 fl and 30.5 pg, respectively. As for the red blood cell distribution width (RDW), it was higher in the low socio-economic level population (16.86 ± 3.40%) than in the high socio-economic level population (14.90 ± 2.25%) with a difference highly significant (p <0.0001).
Conclusion: The RBC and RDW were significantly increased in Lubumbashi, while HB. HCT, MCV and MCH were decreased. The mean corpuscular hemoglobin concentration (MCHC) did not present any particularity.
Keywords
Erythrocyte Constants, Low and High Socio-economic Levels, Lubumbashi, DRC
Introduction
During pregnancy, the hematological constants are different from those observed outside of pregnancy. Many physiological changes occurring during pregnancy affect hematological parameters di¬rectly or indirectly [1]. The Knowledge of these changes in the maternal body by biologists and clinicians allows the detection of possible abnormalities [2]. Indeed, the hematological constants observed during pregnancy should not be considered abnormali- ties as long as they do not alter maternal and perinatal outcomes. The hematologic system of the pregnant woman must adapt in sev¬eral ways, such as the supply of vitamins and minerals for fetal he-matopoiesis (iron, vitamin B12, folic acid), which can exacerbate maternal anemia and preparation for bleeding during childbirth requires improved hemostatic function [3]. One of the most sig¬nificant hematological changes in pregnant women is anemia due to independent and unequal variations in plasma volume (+ 40%) and corpuscular volume (+ 15%) [4]. The hemodilution phenome¬non further contributes to a reduction in the hematocrit (HCT) and hemoglobin (HB) level, leading to anemia. For the pregnant wom¬an, such a modification is physiological and proves the adoption of a different threshold for the definition of anemia of pregnancy. Regarding hemoglobin and according to the Centers for Disease Control and Prevention (CDC) in the United States, HB should be less than 11.0 g / dl in the 1st and 3rd trimester and less than 10.5 g / dl in the 2nd [5]. For WHO, the threshold of anemia during preg-nancy is a condition in which the total concentration of circulating HB is less than 11g / dl, or HCT less than 33% at any time during pregnancy [6].
In addition to hemoglobin and hematocrit, erythrocyte indices : red blood cell count (RBC), mean corpuscular volume (MCV), mean corpuscular hemoglobin (MCH), mean corpuscular he-moglobin concentration (MCHC) and red blood cell distribution width (RDW) are also altered during normal pregnancy [7]. Due to the high levels of erythropoietin and the increased activity of erythropoiesis, the percentage of reticulocytes increases and the erythrocytes become larger and less dense, indicating a younger red blood cell population. This is reflected in certain red blood cell indices, including mean blood cell volume, red blood cell dis-tribution width, mean corpuscular hemoglobin content, and mean corpuscular hemoglobin concentration [8]. In short, the increase in erythropoetic activity, the increased need for iron and the phe¬nomenon of dilution contribute to making changes in the entire erythrocyte line in pregnant women [9-11].
In our city, where populations have different standard of living, it is possible that the hematological constants are influenced during pregnancy, not only by physiological conditions but also by so-cio-economic level. A study by Glover-Amenyo et al. Reported that rural housing was a strong predisposing factor to anemia during pregnancy, compared to urban housing, further suggesting the need to focus on rural areas as à focal point for studying the in-cidence and management of anemia because of the low socio-eco-nomic level frequent in this environment [12]. The prevalence of anemia among poor rural Brazilian women was 12% higher than national estimates for women of reproductive age. The prevalence of anemia and average hemoglobin levels among indigent women appear to be partly explained by some previously recognized risk factors, such as socioeconomic status, body mass index and ma¬laria [13]. In view of the above, the objective of this study was to describe the hematological constants observed in Lubumbashi in populations of low and high socio-economic levels.
Methodology
Description of the study population
A descriptive cross-sectional observational study was carried out in Lubumbashi, among pregnant women received during the third tri¬mester antenatal consultations in apparent good health. The study was conducted in June 2020. Several maternities were included in this work ; these are the maternities of the University Clinics of Lubumbashi, the Jason Sendwe General Provincial Hospital of Reference, the Polyclinic of olive trees, the Salama Organisation and the Sainte Bernadette Clinic. Regarding the socio-economic level, two classes were defined : the low level (less than 100 USD of monthly income) and the high socio-economic level (more than 500 USD monthly income). This breakdown was taken from the Demographic and health survey [14]. The present study collected 52 patients of low socioeconomic level and 76 patients of high socioeconomic level, making a total of 128 pregnant women. All pregnant women who presented with complaints or pathologies on admission were excluded from the study. This was the case with hypertension in pregnancy, bleeding in the third trimester and or febrile illnesses.
Maternal Data
Certain sociodemographic and obstetrical data were collected before the laboratory sample. These data included maternal age, obstetric identity, provenance (rural or urban), the notion of geoph-agy, the number of antenatal consultations, the history of newborns with low birth weight or macrosomes, anthropometric parameters (weight and height), iron supplementation, folic acid or intermit¬tent preventive treatment for malaria (Fansidar), socio-economic level and level of study. The level of study included the following six categories : illiterate, primary, secondary, bachelor and post-graduate level.
Collecting Blood Samples
The collection was made by a team of doctors trained for this purpose. Four milliliters of blood were drawn through a venous catheter and stored in a tube containing ethylenediaminetetraacetic acid (EDTA). Care was taken not to leave the tourniquet in place for more than a minute. The sample was kept cool after collection and was analyzed within 24 hours of collection at the latest. The number of the card containing the maternal data was written on the tube. The tube had a purple cap.
Analysis Technique
Once the samples arrived at the laboratory, the analysis began by mentioning the sample number in the machine. The samples were placed on the blender before proceeding with the actual analysis. Manual mixing was also carried out. CYANHEMATO is used to analyze the blood by the coulter technique, which consists of counting cells passing through an orifice and measuring the hemo¬globin content of red blood cells by photometry. This device was able to analyze 20 hematological parameters giving a leukocyte Formula in 3 populations and only needs 25 μl of whole blood.
The 20 hematological parameters analyzed were as follows: for the leukocyte line, WBC: total white blood cell count, LYM: lym¬phocyte count, MON: monocyte count, GRA: granulocyte count, LYM%: percentage of lymphocytes, MON%: percentage of mono-cytes, GRA%: percentage of granulocytes; for the erythrocyte line, HB: hemoglobin, RBC: red blood cell count, HCT: hematocrit, MCV: average corpuscular volume, MCH: average corpuscular hemoglobin, MCHC: average corpuscular hemoglobin concentra¬tion, RDW: red blood cell distribution width; and for the platelet line, PLT: platelet count, THT: thrombocrit, VMP: average plate¬let volume, PDI: platelet distribution index, P-LCC: large platelet cell count, P-LCR: large platelet cell ratio. The results were print¬ed and appended to the card containing the antenatal data. In this work, only the erythrocyte line was exploited.
Statistical Analysis
The data were recorded using Excel and processed by STATA, XL-STAT and EPIINFO software. The point clouds were constructed to observe the distribution of the values obtained. The averages with their standard deviations as well as their extremes were cal-culated. The comparison of the averages was made using the stu-dent’s t test. The reference constants were taken from the WHO for the definition of anemia, the lower normal threshold of which is set at 11 g / dl. For other parameters, reference was made to the tables established in China in 2017 fixing the ranges of variation and the averages of the hematological constants during normal pregnancy [1]. The confidence interval was 95% and the significance cancel-ing the null hypothesis that of the non-existence of the difference between the two averages, was retained when p was less than 0.05.
Results
Distribution of Hemoglobin Levels in Populations of Low and High Socioeconomic Levels
The figure 1 indicates that in the low socioeconomic level pop-ulation, the majority, i.e. 44 out of the 52 patients had a hemo-globin level below 11 g / dl against 32 out of 76 patients in the high socio-economic level population. In the latter population, the distribution was concentrated around 11 g / dl while it was concen¬trated below 11g / dl in the population at low socioeconomic level. Hemoglobin averages were 9.63 ± 1.52 and 11.19 ± 1.07 g / dl in the low and high socioeconomic levels populations, respectively. Two out of 52 patients of low socioeconomic level had a hemo¬globin level below 7 g/dl. Referring to the threshold of 12 g / dl, the majority of patients were below in both populations (48 of 52 patients in the low socioeconomic level population and 60 out of 76 patients in the high socioeconomic level population

Figure 1: Distribution of hemoglobin levels and their averages in low and high socioeconomic levels populations
Distribution of Red Blood Cell Count in Low and High Socioeconomic Levels Populations
Taking as a reference the variation range of 2.75 to 4.64 1012 / l, and the reference average of 3.79 1012 / l and 3.94 1012 / l (For Cyan Hémato and China, respectively), the majority of patients overall were in this range of red blood cell count and a significant percentage was above this range. Just over à quarter of pregnant women (28.8 in the low socioeconomic level population and 27.63 % in the high socioeconomic level population) had a red blood cell count above the threshold of 4.64 1012 / l. Only one pregnant woman in the high socioeconomic level population had a red blood cell count below 2.75 1012 / l. The average red blood cell count were 4.23 ± 0.55 and 4.41 ± 0.62 1012 / l in the low and high so¬cioeconomic levels populations, respectively. Distribution of Hematocrit in Low and High Socioeco¬nomic Levels Populations The figure 2 shows that the HCT averages in low and high so-cioeconomic levels populations were respectively 28.39±4.21 and 32.47±3.45%. The distribution of HCT in the low socioeconomic level population was under 30.81% (the HCT average in our se¬ries). It was however above 30.81% in the high socioeconomic level population. It was also observed that less than 10% of preg¬nant women could have the HCT above 36%.
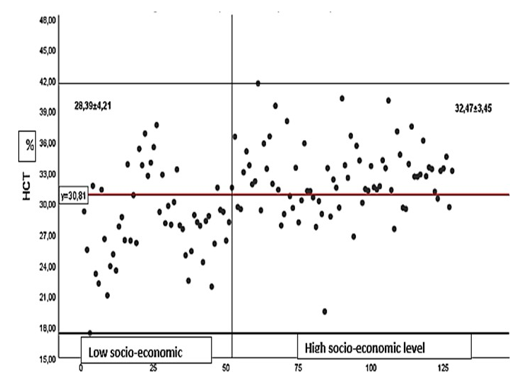
Figure 2: Distribution of Hematocrit in Low and High Socioeconomic Levels Populations
Change in Erythrocyte Constants
The Table I compares the erythrocyte constants in the third tri-mester of pregnancy in Lubumbashi compared to the constants described in China. It appears that concerning red blood cells, the count in Lubumbashi in the two study populations was higher than what is described in China : 3.16-5.10 1012 and 2.64-6.20 1012 / l with respective averages of 4.23 ± 0.55 and 4.41 ± 0.62 1012 / l in the low and high socioeconomic levels populations for an interval from 2.5-97.5 percentile of 2.75-4.64 1012 / l and a average of 3.94 1012 / l in China. Regarding hemoglobin level, hematocrit,mean corpuscular volume and mean corpuscular hemoglobin, the values obtained in Lubumbashi were lower than those described in China and lower in the population at low socioeconomic level. The averages for these different constants were 9.63 ± 1.52 versus 11.19 ± 1.07 g / dl ; 28.39 ± 4.21 versus 32.47 ± 3.46% ; 67.34 ± 9.50 versus 74.38 ± 8.15 fl and 22.96 ± 3.56 versus 25.71 ± 3.23 pg for reference values of 12 g / dl for Hb ; 36% for HCT ; 90.8 µl for MCV and 30.5 µg for MCH. As for the MCHC, the values were close to each other and were 34.02 ± 1.50 versus 34.38 ± 1.03 for a reference value of 33.6 g / dl. The RDW was higher in the low socioeconomic level population than in the high socioeconomic level population (16.86 ± 3.40 versus 14.90 ± 2.25%) but the two averages were greater than the reference value of 13.5%.
Table I : Variation of Erythrocyte Constants in the Third Trimester of Pregnancy in Lubumbashi Compared to the Variation in China
|
Constant |
Low socio-economic level (n=52) |
High socio-economic level (n=76) |
Reference values China (2,5-97,5) |
Averages China |
||
|
Red blood cells |
extreme |
Averages ± standard Deviation |
extreme |
Averages ± standard Deviation |
|
|
|
RBC 1012/l |
3,16-5,10 |
4,23 ± 0,55 |
2,64-6,20 |
4,41 ±0,62 |
2,75-4,64 |
3,94 |
|
HBg/dl |
5,9-13,20 |
9,63 ±1,52 |
9,20-14,10 |
11,19 ±1,07 |
8,4-14,1 |
12 |
|
HCT % |
17,38-37,63 |
28,39 ±4,21 |
19,49-41,68 |
32,47 ±3,46 |
26-42 |
36 |
|
MCV fl |
46,0-84 |
67,34 ±9,50 |
54,00-92,80 |
74,38 ±8,15 |
78,7-101,7 |
90,8 |
|
MCH pg |
13,80-30,30 |
22,96 ±3,56 |
18,50-35,70 |
25,71 ±3,23 |
24,1-34,6 |
30,5 |
|
MCHC g/dl |
28,80-36,10 |
34,02 ±1,50 |
31,60-36,90 |
34,38 ±1,03 |
31,5-34,8 |
33,6 |
|
RDW % |
7,40-25-90 |
16,86 ±3,40 |
11,30-21,50 |
14,90 ±2,25 |
12,3-19,8 |
13,5 |
Comparison of Erythrocyte Constants in Populations of Low and High Socioeconomic Levels
The table II compares erythrocyte constants of the low and high socio-economic levels populations. Thus, concerning RBC and MCHC, the difference observed between the two populations was not significant (p = 0.1 and p = 0.11, respectively). Concerning HB, HCT, MCV and MCH, the values in the low socioeconomic level population were lower than in the high socioeconomic level population and the difference was highly significant for each of these values (p <0.0001). As for the RDW, it was higher in the low socioeconomic level population than in the high socioeconomic level population with a strongly significant difference (p: <0.0001).
Table II : Comparison of Erythrocyte Constants in a Population of Low and High Socioeconomic Levels
|
Constants |
|
|
|
|
|
Low socio-economic level (n=52) |
High socio-economic level (n=76) |
|
|
Red blood cells |
Averages ± standard Deviation |
Averages ± standard Deviation |
p |
|
RBC 1012/l |
4,23 ± 0,55 |
4,41 ±0,62 |
0,1 |
|
HB g/dl |
9,63 ±1,52 |
11,19 ±1,07 |
< 0,0001 |
|
HCT % |
28,39 ±4,21 |
32,47 ±3,46 |
< 0,0001 |
|
MCV fl |
67,34 ±9,50 |
74,38 ±8,15 |
< 0,0001 |
|
MCH pg |
22,95 ±3,56 |
25,71 ±3,23 |
< 0,0001 |
|
MCHC g/dl |
34,02 ±1,50 |
34,38 ±1,03 |
0,11 |
|
RDW % |
16,36 ±3,40 |
14,90 ±2,25 |
< 0,0001 |
Discussion
Distribution of Hemoglobin Levels in Populations of Low and High Socioeconomic Levels
The findings in Figure 1 relate to the socio-economic differences between the two populations with respect to health and nutritional habits ; the low socio-economic level population has a nutritional deficiency and this could explain the rather high number (44/52) of pregnant women with hemoglobin below 11 g / dl. Indeed, the same observation was made in African countries with limited re- sources. This is the case for the South West of Nigeria where the average HB in the third trimester of pregnancy was 9.8 ± 0.2 g/ dl, very close to the average value observed in the low socioeco¬nomic level population in Lubumbashi, which was 9.63 ± 1.52 g / dl [15]. In Ethiopia, average monthly income <500 Ethiopian birr (12.67 USD), heavy menstrual bleeding, low and medium dietary diversity score, irregular intake of iron supplements, mid upper arm circumference <23 cm, and intestinal helminth infections have been identified as independent determinants of anemia during pregnancy [16]. Considering the factors associated with anemia during pregnancy in the results from the 2020 Ethiopian health and demographic survey, we notice that most of these factors would result from a low socioeconomic level [17]. These are age 30 to 39, illiteracy (AOR = 2.19; 95% CI 1.45, 2.49), poverty (AOR = 1.29; 95% CI % 1.22, 1.60), of the Muslim religion (AOR = 1.59; 95% CI 1.69, 2.65), of a large family of 6 people (AOR = 1.44; CI 95% 1.05, 1.97), the presence of more than two children under 5 in the family (AOR = 1.47; 95% CI 1.10, 1.97), female head of household (AOR = 2.02; 95% CI 1.61, 2.54), late pregnancy (AOR = 1.75; 95% CI 1.23, 1.63), and between 13 and 17 years of age at first intercourse (AOR = 1.97; 95% CI 1.291, 3.00). The aver-age HB in the high socioeconomic population in Lubumbashi was around the lower limit of HB in the third trimester of pregnancy set by WHO (5.6).
Distribution of Red Blood Cell Count in Populations of Low and High Socioeconomic Levels
Over a quarter of pregnant women (28.8 in the low socioeconom-ic level population and 27.63% in the high socioeconomic level population) had a red blood cell count above the threshold of 4.64 1012 / l. During human pregnancy, maternal erythropoietin is as¬sociated with nutritional iron status. The lower is the availability of iron, the higher is the erythropoietin concentration (8). The in¬crease in the red blood cell count in our populations is possibly the translation of a significant iron deficiency in our population. Indeed, during pregnancy, there is an increase in the red blood cell count linked to hyperactivity of the bone marrow (resulting from increased erythropoetic activity) and or the importance of micro-cytosis which are observed especially in third trimester of preg¬nancy [18]. In this series, the distribution of red blood cell count was more concentrated between 4 and 5 1012 /l. As described by Lurie, the red blood cell count increases significantly at 20 week, remains high until 32 week, and then decreases around child¬birth [19]. On the other hand, Akinlaja indicates that an increase of 15-20% in red blood cell count is generally seen in pregnant women without iron supplementation [20]. It is possibly for these reasons that even if the red blood cell count remains close in the two groups of population, the increase beyond the upper limit is greater in low socioeconomic level population assumed to be not adequately supplemented with iron than in high socio-economic level population. Other studies suggest a decrease in red blood cell count during pregnancy [21].
Distribution of Hematocrit in Low and High Socioeco¬nomic Levels Populations
There are different laboratory tests that are employed to diagnose anemia such as Hematocrit, Hemoglobin, and Red blood cell count [22]. Hemoglobin detects directly anemia while Hematocrit is an indirect indicator. The practice of using three-fold converted He¬matocrit shows that there is a correlatio bettween hemoglobin and hematocrit. In our series, we observed that the low socioeconomic level population who have à large proportion of hemoglobin un¬der 11 g/dl is followed by Hematocrit value under 30%. However, the high socioeconomic level population had higher hemoglobin average (11.19 g/dl) and higher hematocrit average (32.47%) too.
Variation of Erythrocyte Constants from the China Ref¬erence Values and Comparison of Erythrocyte Constants in a Population of Low and High Socioeconomic Levels
In Reference to Table I, the red blood cell count was significant¬ly higher than the values described in China. This is 4.23 ± 0.55 versus 4.41 ± 0.62 1012 / l (p : 0.1) for an average of 3.94 1012 / l in China. The RDW was higher in the low socioeconomic level population than in the high socioeconomic level population (16.86 ± 3.40 versus 14.90 ± 2.25%, p : <0.0001) but both averages were above the baseline of 13.5%. In Denmark, in 2000; one study fixes the number of red blood cells at 3.6-3.95 and 3.7-4.05 1012 / l in populations not supplemented and supplemented with iron re¬spectively [23]. These values remain lower than those described in Lubumbashi. In 2012, in the United States of America, with regard to the red blood cell count, no significant difference was observed in the non-Caucasian and Caucasian populations and the average in the third trimester of pregnancy was around from 3.7-4.05 and 3.8-4.1 1012 / l [24]. As for the RDW, the same American study shows that the average values of the RDW in non-Caucasian wom¬en (14-14.5%) were significantly higher than the average values of pregnant Caucasian women (13.5-14) in the third trimester of pregnancy (p: <0.05). From these three studies, from China, Den¬mark and the United States, there is reason to suggest that pregnant women from Lubumbashi have a higher red blood cell count than in eastern and western populations, as well as RDW. Moreover, this last constant is higher in populations of low socioeconomic level. The overall increase in RDW in the third trimester may be dependent on increased bone marrow activity and / or a higher incidence of microcytic anemia. One study showed that the sensi¬tivity and specificity of RDW in detecting microcytic anemia were 82.3% and 97.4%, respectively [25]. Indeed, the RDW is one of the most useful diagnostic markers of iron deficiency anemia, al-lowing the rapid adoption of iron supplementation [26]. As the ma¬jority of the population of Lubumbashi is anemic, it is necessary to understand the rise of RDW.
Regarding the hemoglobin level, the hematocrit, the mean corpus¬cular volume and the mean corpuscular hemoglobin content, the values obtained in Lubumbashi were lower than those described in China and lower in the low socio-economic level population (p : <0.0001). These constants are lower than those also described in Denmark and the United States of America. They reflect the effect of hemodilution and iron deficiency anemia. The hematocrit was 28.39 ± 4.21 and 32.47 ± 3.46% (p : <0.0001) ; these means for low and high socioeconomic levels population were lower than the expected average of 36. In fact, Hematocrit is a test that measures the percentage of blood composed of red blood cells. This is often referred to as the volume of compacted cells or the volume fraction of erythrocytes. An hematocrit value below the reference interval indicates anemia [27]. This is the case in our environment where the anemia is deeper in the case of low socio-economic level popu¬lation than in the case of high socio-economic level population. In Jamaica, the MCV, MCH and MCHC were 86.70 ± 6.85 fl ; 29.85 ± 3.13 pg and 34.33 ± 1.43g / dl in the third trimester of pregnancy in non-anemic pregnant women [28]. These values were higher than ours as in our series there are many anemic pregnant women.
The MCHC does not appear to be changed during pregnancy (8). Its value found in Lubumbashi in the two groups of population was similar to that described in several other studies [1,23,24,28].
Conclusion
The RBC and RDW were significantly increased in Lubumbashi ; while HB. HCT, MCV and MCH were decreased. The MCHC did not present any particularity. Apart from RBC and MCHC, eryth¬rocyte constants are significantly different depending on low and high socio-economic level populations.
Acknowledgement
We thank the doctors who collected the blood, the directors of dif-ferent maternities and the responsible of the laboratory
References
- Li A, Yang S, Zhang J, Qiao R (2017) Establishment of reference intervals for complete blood count parameters during normal pregnancy in China. J Clin Lab Anal. 31: e22150.
- Bakrim S, Motiaa Y, Ouarour A, Masrar A (2018) Hematological parameters of the blood count in a healthy population of pregnant women in the Northwest of Morocco (Tetouan-M’diq-Fnideq provinces). Pan Afr Med J 29: 205.
- Mohamed AO, Hamza KM, Babker AMA (2016) Physiological changes in some hematological and coagulation profile among Sudanese healthy pregnant women. Int J Med Sci Public Health 5: 525-528.
- Cotes PM, Canning CE (1983) Changes in serum immunore-active erythropoietin during the menstrual cycle and normal pregnancy. Br J Obst Gynecol 90: 304-311.
- Sarah K, Harm, Mark H, Yazer, Jonathan H (2012) Waters Changes in hematologic indices in Caucasian and non-cauca-sian pregnant women in the United States. Korean J Hematol 47: 136-141.
- World Health Organization (2016) Department of Nutrition for Health and Development. Iron Deficiency Anaemia Assessment, Prevention and Control. A guide for programme managers. Geneva : World Health Organization.WHO/ NHD/01.3 ; 2001: 114.
- Milman N, Byg KE, Agger AO (2000) Hemoglobin and erythrocyte indices during normal pregnancy and postpartum in 206 women with and without iron supplementation. Acta Obstet Gynecol Scand 79: 89-98.
- Vega-Sánchez R, Tolentino-Dolores MC, Cerezo-Rodríguez B, Chehaibar-Besil G, Flores-Quijano ME (2020) Erythropoiesis and Red Cell Indices Undergo Adjustments during Pregnancy in Response to Maternal Body Size but not Inflammation. Nutrients 12: 975.
- Lurie S (1993) Changes in age distribution of erythrocytes during pregnancy: A longitudinal study. Gynecol. Obstet. Investig 36: 141-144.
- McKenzie SB. Hematología Clínica. 2nd ed. Manual Moder-no; Mexico City, México: 2000.
- Bolton FG, Street MJ, Pace AJ (1983) Changes in Erythrocyte Volume and Shape in Pregnancy. Obstet Gynecol Surv 38: 461.
- Glover-Amengor M, Owusu WB, Akanmori B (2005) Determinants of anaemia in pregnancy in Sekyere west district.Ghana Ghana Medical Journal 39: 102-107.
- Borges MC, Buffarini R, Santos RV, Andrey M Cardoso, James R Welch, et al. (2016) Anemia among indigenous women in Brazil: findings from the First National Survey of Indigenous People’s Health and Nutrition. BMC Womens Health 16: 7.
- Ministère du Plan et Suivi de la Mise en œuvre de la Révo-lution de la Modernité (MPSMRM), Ministère de la Santé Publique (MSP) et ICF International, 2014. Enquête Démo-graphique et de Santé en République Démocratique du Congo 2013-2014. Rockville, Maryland, USA : MPSMRM, MSP et ICF International.
- TS Akingbola, IF Adewole, OA Adesina, KA Afolabi, FA Fe-hintola, et al. (2006) Hematological profile of healthy pregnant women in Ibadan, South-western Nigeria, Journal of Obstetrics and Gynaecology 26: 763-769.
- Tulu BD, Atomssa EM, Mengist HM (2019) Determinants of anemia among pregnant women attending antenatal care in Horo Guduru Wollega Zone, West Ethiopia: Unmatched case-control study. PLoS One 14: e0224514.
- Woldegebriel AG, Gebregziabiher Gebrehiwot G, Aregay Desta A, Kiros Fenta Ajemu ,1 Asfawosen Aregay Berhe, et al. (2020) Determinants of Anemia in Pregnancy: Findings from the Ethiopian Health and Demographic Survey. Anemia 2020: 2902498.
- Paliogiannis P, Zinellu A, Mangoni AA, Giampiero Capobian-co, Salvatore Dessole, et al. (2018) Red blood cell distribution width in pregnancy: a systematic review. Biochem Med (Zagreb) 28: 030502.
- Lurie S (1993) Changes in age distribution of erythrocytes during pregnancy : a longitudinal study. Gynecol Obstet Invest 36: 141-144.
- Akinlaja O (2016) Hematological Changes in Pregnancy -The Preparation for Intrapartum Blood Loss. Obstet Gynecol Int 4: 00109.
- BRESANI, Cristiane C, SOUZA, Ariani I, BATISTA FILHO,Malaquias (2009) Erythrocyte indices in the second trimester of pregnancy : are reference values well established?. Rev Bra. Hematol Hemoter 31 : 37-40.
- Kiya, Girum Tesfaye, Fitsum Mesfin Zewudie (2019) Comparison of three-fold converted hematocrit and micro-hemato-crit in pregnant women. PloS one 14: e0220740.
- Milman, Nils, KELDâ?ERIK BYG, Anders Ole Agger (2000) Hemoglobin and erythrocyte indices during normal pregnancy and postpartum in 206 women with and without iron supplementation. Acta Obstetricia et Gynecologica Scandinavica 79: 89-98.
- Harm SK, Yazer MH, Waters JH (2012) Changes in hematologic indices in caucasian and non-caucasian pregnant women in the United States. Korean J Hematol 47: 136-141.
- Khan H, Khan K. Sahahtaj, Khattak RN (2014) Red cell parameters in third trimester of pregnancy in a tertiary care hospital of Peshawar, Pakistan. RMJ 39: 435-438.
- Paliogiannis P, Zinellu A, Mangoni AA (2018) Red blood cell distribution width in pregnancy : a systematic review. Biochem Med (Zagreb) 28: 030502.
- Kiya GT, Zewudie FM (2019) Comparison of three-fold converted hematocrit and micro-hematocrit in pregnant women. PLoS One 14: e0220740.
- James TR, Reid HL, Mullings AM (2018) Are published standards for hematological indices in pregnancy applicable across populations : an evaluation in healthy pregnant Jamaican women. BMC Pregnancy Childbirth 8: 8.