
International Internal Medicine Journal(IIMJ)
ISSN: 2837-4835 | DOI: 10.33140/IIMJ
Impact Factor: 1.02


Research Article - (2024) Volume 2, Issue 4
Heart Disease Prediction: A Machine Learning Approach with Higher Accuracy
Received Date: Feb 29, 2024 / Accepted Date: Mar 21, 2024 / Published Date: Apr 01, 2024
Copyright: ©Â©2024 Amzad Hossain, et al. This is an open-access article distributed under the terms of the Creative Commons Attribution License, which permits unrestricted use, distribution, and reproduction in any medium, provided the original author and source are credited.
Citation: Likhon, N. H., Bhuyian, F., Bhuiyan, S., Fahim, M. A., Sony, R. I., et al. (2024). Heart Disease Prediction: A Machine Learning Approach with Higher Accuracy. Int Internal Med J, 2(4), 01-10.
Abstract
Heart disease, a prevalent cardiovascular condition, poses significant health risks and affects millions worldwide. The alarming rise in heart disease cases in recent years demands proactive measures, making early prediction of these conditions crucial and concerning. By employing machine learning techniques, this study aims to identify patients who are more susceptible to heart disease based on diverse medical attributes. The Heart Disease Dataset from Kaggle, consisting of 1025 samples and 14 features, was incorporated into this investigation. And after preprocessing the dataset by removing duplicate and null values and implementing statistical imputation and several data graphs, like a scatter plot, box plot, histogram, etc., we split it into training and testing datasets and apply SMOTE technique on the training one. Various machinelearning approaches were used in this study, out of which the optimized decision tree gave the best accuracy of 98.96%.
Keywords
Artificial Intelligence, Machine Learning, Explainable AI, Heart Disease, Dataset.
Introduction
Heart disease is a major global health concern, responsible for around 70% of all deaths worldwide [1,2]. Heart disease refers to a spectrum of conditions that impact the structure and function of the heart. Numerous factors, including genetics, lifestyle, and underlying medical conditions including high blood pressure, high cholesterol, and diabetes, play a role in its development. There are numerous varieties of heart disease, each with its distinct characteristics and effects on our health. Coronary artery disease, arrhythmias, heart failure, and valve disease are the most prevalent forms of heart disease [2,3]. By 2030, around 23.6 million lives will be lost each year, making heart attacks one of the leading causes of death globally, if not already [4]. Preventing heart disease requires adopting a healthy lifestyle, including proper nutrition, exercise, and avoiding tobacco and alcohol. Although traditional methods like physical examination, ECG, CT, or MRI scans could be beneficial in diagnosing heart disease, it is high time we also depend on a different approach, something like machine learning technology, as it has shown great promise in predicting heart disease by analyzing large datasets and making accurate predictions.
In modern times, heart disease is a progressive condition that typically causes suffering and mortality. Numerous studies and machine learning algorithms have been utilized extensively to predict and characterize this disease [5–9].
For instance, Singh anticipated cardiac disease at an early stage [5]. The Cleveland database and the Statlog Heart Disease repository at the University of California, Irvine (UCI) provided them with a standard dataset of 13 features for this purpose. On that dataset, many machine learning models were applied and compared. Using the random forest classifier yielded the highest accuracy at 93.02 percent.
Using six machine learning algorithms, research attempted to predict heart disease [6]. On two heart disease datasets, the authors evaluated six distinct models and achieved an accuracy of 87.91% for SVM and 98.90% for XGBoost classifier with customized hyperparameters.
The UCI Heart Disease Prediction Benchmark Dataset was utilized in the research, which comprises 14 distinct factors linked to heart disease and several machine learning models trained with that dataset [7]. According to their research, in comparison to other machine learning algorithms, Random Forest gives greater accuracy with less forecast time.
Jindat et al. predicted heart disease prediction using machine learning algorithms [8]. The authors used the UCI repository with patients’ medical histories and attributes. 13 medical characteristics from 304 individuals in their dataset served as a detection tool. The KNN model had the highest accuracy of 88.52% among the classifiers the authors examined, making it the most effective one.
Various machine-learning models were utilized by Karthick and his colleagues to evaluate the probability of heart disease occurrence from the available dataset [9]. The UCI ML repository's Cleveland HD dataset, consisting of 303 data samples and 13 features, was employed in this investigation. In addition to statistical imputation and several data analysis graphs, like scatter plots, this study also used 6 different machine learning classifiers. Out of which, the random forest algorithm provided better accuracy of 88.5% in prediction.
For our study, we implemented five distinct algorithms on a dataset of 1,025 samples with 14 features. In this instance, we also utilized dataset pre-processing, hyperparameter optimization, class imbalance management, feature selection, and Explainable AI LIME. Based on our analysis of various models, we used the most accurate model to predict heart disease. Our system has the potential to substantially benefit the medical field by detecting and preventing heart disease.
The remaining sections of this work follow the same organizational pattern, with Section II describing research methods and tools, Section III presenting our system’s data and findings alongside qualitative analysis, and Section IV summarizing our goals and highlighting the significance of early heart disease prediction.
Proposed System
Within this section, we present a summary of the dataset and its characteristics, data preprocessing, and an overview of the models, approaches, and resources used in this study.
Dataset
Our machine learning system utilized a Kaggle dataset with 1025 samples and 14 attributes related to heart disease age, sex, cp, trestbps, chol, fbs, restecg, thalach, exang, oldpeak, slope, ca, thal and target [10]. The dataset had no null values but exhibited outliers. Fig. 1 shows an overview of the dataset.

Figure 1: Heart Disease Dataset Overview
Exploratory Data Analysis
Exploratory Data Analysis is a quick and efficient technique that employs static and dynamic visualizations to analyze large volumes of data in a given context. It aids in identifying data patterns, associations, and preprocessing needs, allowing for a rapid evaluation of the alignment between characteristics and desired outcomes. Counter, His, KDE and box plot of some features from exploratory data analysis is given below.
Using a counterplot, Fig. 2 depicts the number of individuals based on the sex attribute. It displays the number of each sex.

Figure 2: Counterplot of Sex Attribute
Using his plot, Fig. 3 depicts the number of individuals based on the cp attribute. It displays the number of each cp with the target variable.

Figure 3: His Plot of the CP Attribute
Using a KDE plot, Fig. 4 illustrates the fbs attribute visualization of the probability density function of a continuous variable, showing insights into the underlying distribution of the data.
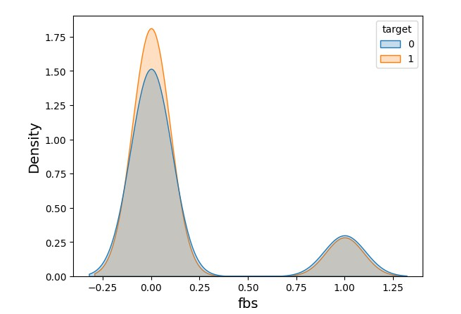
Figure 4: KDE Plot of FBS Attribute
Using a boxplot, Fig. 5 depicts the presence of an outlier in the age attribute. It displays the number of outliers.
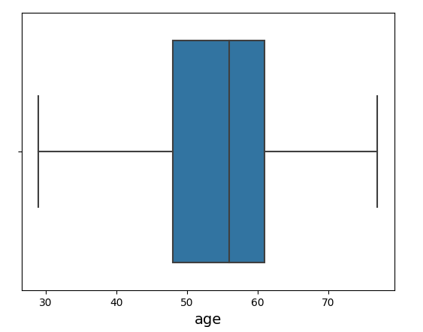
Figure 5: Boxplot of Age Attribute
Data Pre-Processing
For machine learning to be successful, data preparation is crucial since it guarantees improved model performance. Fortunately, there are no concerns with categorical feature issues, class imbalance, or null values in our dataset. However, we need to pre-process our dataset using the SMOTE technique, feature selection, data standardization, and outlier removal. We used a dataset with 14 characteristics for our study. From null value checking, it was found that null values weren't present. After confirming the outlier using boxplots, we removed it from our dataset since it was relatively insignificant. After that, we employed a standard scaler strategy to standardize our data. The standard scaler normalizes a feature by subtracting the mean and scaling to unit variance. Unit variance implies dividing all the values by the standard deviation. Equation (1) of standard scaler,
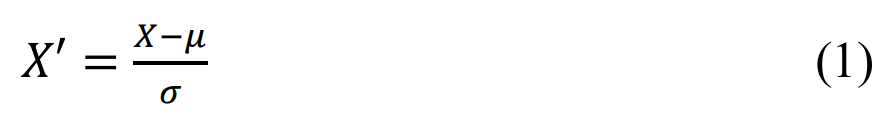
where μ denotes the mean of the feature values and ðÂÂ?? indicates the standard deviation.
After standardizing the data, the variance threshold approach was used to discover any redundant or duplicate features, and we also utilized the Pearson correlation technique to determine the correlation in our dataset. These two strategies are termed feature selection techniques." By employing those strategies, we found that we had no redundant or duplicate features. Fig. 6 displays the association of characteristics using a heat map.

Figure 6: Correlations of Features
Lastly, we used the SMOTE approach on our data. It is a strategy that removes class imbalances in machine learning datasets by providing synthetic instances of the minority class. Even though we had no concerns with class imbalance, we utilized it to strengthen the model. Fig. 7 depicts the number of individuals with and without cardiac disease before the implementation of SMOTE.

Figure 7: Status of Heart Disease Before SMOTE
Fig. 8 depicts the number of individuals with and without cardiac disease after the implementation of SMOTE.
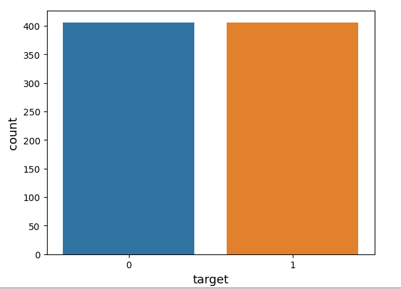
Figure 8: Status of Heart Disease After Applying SMOTE Technique
Data Splitting
The training-test split is a method frequently employed for training and evaluating models. The dataset is divided into a training set and a test set; the model is then trained using the training set and evaluated using data it has never seen before. Typically, a ratio of 80% to 20% is utilized, with 80% of the data used for training and 20% for assessment. Using this method, we can evaluate the model's efficacy using new, unverified data.
Applied Model
Decision Tree Model
In machine learning, a decision tree model is a kind of algorithm that employs a tree structure to draw conclusions or make predictions. It is a kind of supervised learning in which a model constructs a decision tree based on a set of labeled training instances. Fig. 9 depicts each node within the tree represents a feature or characteristic, while each branch represents a possible outcome or value for that property. One advantage of decision tree models is their interpretability and transparency in representing the decision-making process.

Figure 9: The Decision Tree Basic Architecture
Random Forest Model
Popular machine learning approach Random Forest creates a more robust and accurate model by combining decision trees. Figure 10 displays the Random Forest approach, which uses a forest of decision trees, each of which is trained on a distinct subset of the data and then votes based on the majority's forecast.The random forest approach has gained popularity because to its ability to handle noisy and high-dimensional data, as well as its ease of application and analysis. Random Forest can handle numerical and categorical information, and it overfits less than individual decision trees.

Figure 10: The Random Forest Basic Architecture
XGBoost Model
XGBoost is an open-source gradient-enhancing software library. It is used for tasks such as classification, regression, ranking, and clustering in machine learning. XGBoost is a decision tree-based algorithm that employs gradient boosting to enhance the model's accuracy. A strong model is created by merging the basic model with only incorrectly predicted data from previous iterations, as shown in Fig. 11. It has been demonstrated that XG Boost is highly effective for a variety of machine-learning tasks, and it is among the most popular machine-learning libraries.

Figure 11: The XG Boost Basic Architecture
KNN Model
K-nearest neighbors (KNN) is a classification algorithm for machine learning that uses a distance metric to designate a new data point belonging to the majority class among its k-nearest neighbors shown in Fig. 12. It is a straightforward yet efficient classification algorithm. The K-nearest neighbors (KNN)algorithm has the advantages of being easy to implement and effective at solving multiclass classification problems. A benefit of the K-Nearest Neighbours (KNN) model is its simplicity and ease of implementation, as it requires few assumptions or intricate parameter tuning.

Figure 12: The KNN Basic Architecture
SVM Model
In machine learning, support vector machines (SVMs) are used to classify data by locating the optimal hyperplane in a multidimensional space. The hyperplane, margin, and support vector that make up the SVM margin are shown in Fig. 13. Its advantages include the effective handling of high-dimensional data and the ability to handle non-linear data through kernel functions.

Figure 13: The SVM Basic Architecture
Libraries
Libraries play a crucial role in the development of our system, from dataset upload to model implementation and assessment. We used Pandas to analyze the data and convert it into a data frame. Scikit was used to analyze and produce the confusion matrices, accuracy scores, loss scores, and dataset partitioning.Seaborn was used to perform visualization methods such as graphical charting. These libraries provided high-performance data structures, data analysis tools, and visualization capabilities, allowing us to effectively conduct research and design our system.
Confusion Matrix
A confusion matrix is a table used to evaluate classification models in machine learning. It explains true positives, true negatives, false positives, and false negatives. The rows indicate predicted classes, the columns represent actual classes, and the cells reflect sample counts. Figure 14 depicts the confusion matrix structure.

Figure 14: Confusion Matrix Diagram
System Block Diagram
The process of our system, as shown in Fig. 15, involves using historical data for prediction. EDA is used to determine the need for pre-processing and detecting outliers. Pre-processing includes handling nulls, duplicate values, outliers, and class imbalance handling. The dataset is then separated into testing and training data, with 20% for testing and 80% for training. The selected model is trained and tested using these datasets, and accuracy, precision, recall, f1-score, and confusion matrix are evaluated to select the best model. The chosen model is then used for accurate outcome prediction with an explanation using LIME.

Figure 15: System Block Diagram
Results and Discussion
In our study, Google Colab was used for dataset upload, exploratory data analysis (EDA), preprocessing, train-test split, and model training/testing. Google Collab is a cloud-based platform by Google for developing, running, and collaborating on Python code through a web browser interface. It provides a Jupyter Notebook-like environment and free access to computing resources, including GPUs and CPUs. These resources enable faster execution of machine learning models and data analysis tasks, allowing users to train complex models and analyze infrastructure. To evaluate the accuracy of our model, we divided the dataset into 80% for training and 20% for testing. We trained different models using these datasets for classification purposes. Finally, we compared the accuracy of the five models derived from the training and testing datasets.
Table I shows the optimized hypermeters of different models from Random Search CV and Grid Search CV.
|
Model |
Random Search CV Optimized Hyperparameters |
Grid Search CV Optimized Hyperparameters |
|
Decision Tree |
min_samples_split: 2, min_samples_leaf: 1, max_features: sqrt, max_depth: 670, criterion: gini |
max_depth: 670, max_features: sqrt, min_samples_split: 3 |
|
Random Forest |
n_estimators: 1600, min_samples_split: 2, min_samples_leaf: 1, max_features: log2, max_depth: 890, criterion: gini |
max_depth: 890, max_features: log2, n_estimators: 1400 |
|
XGBoost |
n_estimators: 1600, min_child_weight: 1, max_depth: 4, learning_rate: 0.05, gamma: 0.1, colsample_bytree: 0.4 |
colsample_bytree: 0.7, gamma: 0.1, learning_rate: 0.1, max_depth: 5, min_child_weight: 6, n_estimators: 1100 |
|
KNN |
weights: distance, n_neighbors: 25, metric: manhattan, leaf_size: 30, algorithm: auto |
leaf_size: 28, metric: manhattan, n_neighbors: 26, weights: distance |
|
SVM |
kernel: poly, gamma: scale, degree: 3, decision_function_shape: ovr, C: 4 |
Kernel: poly, gamma: scale, degree: 3, decision_function_ shape: ovr, C: 5 |
Table I: Optimized Hyperparameter Values For Various ML Models
Table II illustrates the score of performance metrics for ML models with default hyperparameters.
|
Model |
Accuracy |
Precision |
Recall |
F1-score |
|
Decision Tree |
96.37 % |
0.97 |
0.96 |
0.96 |
|
Random Forest |
94.3 % |
0.94 |
0.94 |
0.94 |
|
XGBoost |
98.45 % |
0.98 |
0.98 |
0.98 |
|
KNN |
88.08 % |
0.88 |
0.88 |
0.88 |
|
SVM |
93.78 % |
0.94 |
0.94 |
0.94 |
Table II: Performance Metrics Of Various ML Models With Default Hyperparameters
From Table II, XGBoost has the highest performance score with an accuracy of 98.45%.
Table III illustrates the score of performance metrics for ML models with optimized hyperparameters by random search CV.
|
Model |
Accuracy |
Precision |
Recall |
F1-score |
|
Decision Tree |
98.45 % |
0.99 |
0.98 |
0.98 |
|
Random Forest |
98.45 % |
0.99 |
0.98 |
0.98 |
|
XGBoost |
98.45 % |
0.99 |
0.98 |
0.98 |
|
KNN |
92.75 % |
0.93 |
0.93 |
0.93 |
|
SVM |
95.85 % |
0.96 |
0.96 |
0.96 |
Table III: Performance Metrics of Various ML Models With Optimized Hyperparameters By Random Search CV
From Table III, the decision tree, random forest, and XGBoost have the highest performance metrics with an accuracy of 98.45%.
Table IV illustrates the score of performance metrics for ML models with optimized hyperparameters by grid search CV.
|
Model |
Accuracy |
Precision |
Recall |
F1-score |
|
Decision Tree |
98.96 % |
0.99 |
0.99 |
0.99 |
|
Random Forest |
98.45 % |
0.98 |
0.98 |
0.98 |
|
XGBoost |
98.45 % |
0.98 |
0.98 |
0.98 |
|
KNN |
92.75 % |
0.93 |
0.93 |
0.93 |
|
SVM |
96.37 % |
0.96 |
0.96 |
0.96 |
Table IV: Performance Metrics Of Various ML Models with Optimized Hyperparameters by GRID Search CV
According to Table IV, the decision tree has the best performance metrics, with a 98.96% accuracy rate.
From Tables II, III, and IV we obtained the highest accuracy from Table IV. That is decision tree hyperparameter optimization by grid search cv.
Explainable AI LIME is applied on the highest accuracy model decision tree. LIME will clarify the decision or prediction made by the model. Fig. 16 illustrates the explanation of the model decision of a sample using LIME.
<img src="https://www.opastpublishers.com/scholarly-images/7249-698d8cfb162a9-heart-disease-prediction-a-machine-learning-approach-with-hi.png" width="400" height="250">
Figure 16: Explanation of Model Decision Using LIME
Comparative Analysis
The features and structures of the previous research are examined in Table V for comparison. Compared to past testing, this will enhance the system.
|
Reference |
Main parameters |
Result |
|
[4] |
Random Forest |
Accuracy: 93.02% |
|
[5] |
XGBoost |
Accuracy: 98.90% |
|
[7] |
KNN |
Accuracy: 88.52% |
|
[8] |
Random Forest |
Accuracy: 88.50% |
|
Our System |
Grid Search CV Optimized Decision Tree |
Accuracy: 98.96%, |
Table V: Comparison Analysis
Conclusions
The purpose of our work is the early prediction of cardiac disease using machine learning techniques. We employed five alternative models to perform our analysis on a dataset with 1024 data points and 14 attributes. After pre-processing the dataset, we trained our models, tweaked the hyperparameters of the models, and reached the best accuracy, with an optimized decision tree at 98.96 percent, and other models also delivered very reasonable accuracy. Our model exceeded earlier research in terms of accuracy. The dataset we used had several outliers and duplicate values. If we have a dataset that has no difficulties with outliers, duplicates, or additional data, it might further increase accuracy. In the future, we may incorporate an IoT device to automatically acquire heart characteristics from patients for forecasts. Our study's method has the potential to enhance heart disease prevention, decrease risks related to unhealthy habits and diets, and improve patient safety by predicting heart disease risk early.
References
- Drozdc, K., Nabrdalik, K., Kwiendacz, H., Hendel, M., Olejarz, A., Tomasik, A., ... & Lip, G. Y. (2022). Risk factors for cardiovascular disease in patients with metabolic- associated fatty liver disease: a machine learning approach. Cardiovascular diabetology, 21(1), 240.
- Hossain, A., Uddin, S., Rahman, P., Anee, M. J., Rifat,M. M. H., & Uddin, M. M. (2022). Wavelet and spectral analysis of normal and abnormal heart sound for diagnosing cardiac disorders. BioMed Research International, 2022 .
- Wadhawan, S., & Maini, R. (2022). A systematic review on prediction techniques for cardiac disease. International Journal of Information Technologies and Systems Approach (IJITSA), 15(1), 1-33.
- Mathers, C. D., & Loncar, D. (2006). Projections of global mortality and burden of disease from 2002 to 2030. PLoS medicine, 3(11), e442.
- Singh, H., Gupta, T., & Sidhu, J. (2021, November). Prediction of heart disease using machine learning techniques. In 2021 Sixth International Conference on Image Information Processing (ICIIP) (Vol. 6, pp. 164- 169). IEEE.
- Ahamad, G. N., Shafiullah, Fatima, H., Imdadullah, Zakariya, S. M., Abbas, M., ... & Usman, M. (2023).Influence of optimal hyperparameters on the performance of machine learning algorithms for predicting heart disease. Processes, 11(3), 734.
- Sharma, V., Yadav, S., & Gupta, M. (2020, December). Heart disease prediction using machine learning techniques. In 2020 2nd international conference on advances in computing, communication control and networking (ICACCCN) (pp. 177-181). IEEE.
- H. Jindat, “Heart disease prediction using machine learning algorithms,” IOP Conference Series: Materials Science and Engineering, vol. 1022, pp. 1-11, 2021.
- Karthick, K., Aruna, S., Samikannu, R., Kuppusamy, R., Teekaraman, Y., & Thelkar, A. R. (2022). Implementation of a Heart Disease Risk Prediction Model Using Machine Learning. Computational and Mathematical Methods in Medicine, 2022, 1–14.
- Hoque, S., Khatun, S. S., Khurshid, A. B., Peal, M. D., & Salam, K. M. A. (2022, December). Prediction of Heart Disease Using Machine Learning. In 2022 International Conference on Recent Trends in Microelectronics, Automation, Computing and Communications Systems (ICMACC) (pp. 471-476). IEEE.