


Research Article - (2020) Volume 5, Issue 1
Genetic Variability and Genotype X Environment Interactions Effect on Grain Iron (Fe) and Zinc (Zn) Concentration in Lentils and Their Characterization under Terai Environments of Nepal
2Faculty of Agriculture, Department of Genetics and Plant Breeding, Agriculture and Forestry University (AFU), Rampur, Chitwan, Province No. 3, Nepal
3International Center for Agricultural Research in the Dry Areas (ICARDA), Lebanon
Received Date: Nov 22, 2019 / Accepted Date: Dec 12, 2019 / Published Date: Jan 02, 2020
Copyright: ©Rajendra Darai, et al. This is an open-access article distributed under the terms of the Creative Commons Attribution License, which permits unrestricted use, distribution, and reproduction in any medium, provided the original author and source are credited.
Abstract
Billions of peoples are directly affected from the micronutrient malnutrition called hidden hunger affecting one in three people. Micronutrient Iron (Fe), and zinc (Zn) deficiencies affect large numbers of people worldwide. Iron (Fe) deficiency leads to maternal mortality, mental damage and lower disease resistant of children. Likely Zinc (Zn) deficiency is responsible for stunting, lower respiratory tract infections, and malaria and diarrhea disease in human beings. Nepalese lentils are in fact rich sources of proteins and micronutrients (Fe, Zn) for human health and straws as a valuable animal feed. It has ability to sequester N and C improves soil nutrient status, which in turn provides sustainable production systems. Twenty five lentil genotypes were evaluated to analyze genotype × environment interaction for iron and zinc concentration in the grains. Analysis of variance (ANOVA) indicated that the accessions under study were found varied significantly (P=<0.001) for both seed Fe and Zn concentrations at all the three locations. Pooled analysis of variance over locations displayed highly significant (at P=<0.001) differences between genotypes, locations and genotype × location interaction for Zn micronutrient but insignificant genotype x location interaction was found in Fe micronutrient. Among 25 genotypes, the ranges for seed Fe concentration were 71.81ppm (ILL-2712)-154.03 ppm (PL-4) (mean 103.34 ppm) at Khajura, 79.89 ppm (ILL-3490)-128.14 ppm (PL-4) (mean 95.43 ppm) at Parwanipur, and 83.92 ppm (ILL-7979) -137.63 ppm (ILL-6819) (mean 103.11ppm) at Rampur, while the range across all the three locations was 82.53 ppm (ILL-7979) -133.49 ppm (PL-4) (mean 101.04 ppm). Likely the range for seed Zn concentration was 53.76 ppm (ILL-7723) – 70.15 ppm (ILL-4605) (mean 61.84 ppm) at Khajura, while the ranges for Parwanipur and Rampur were 54.21 ppm (ILL-7723) -91,94 ppm (ILL-4605) (mean 76.55 ppm) and 46.41 ppm (LG-12) – 59.95 ppm (ILL-4605) (mean 54.27 ppm) , respectively. The range across the three environments was 54.03 ppm (ILL-7723) – 75.34 ppm (HUL-57) (mean 64.22 ppm). Although both the micronutrients were influenced by environment, seed Fe was more sensitive to environmental fluctuations in comparison to seed Zn concentration. The G × E study revealed that it was proved that genotypes Sagun, RL-6 and LG-12 were more stable for seed Fe concentration and genotypes WBL-77, ILL-7164, RL-11 were found more stable for seed Zn concentration. In the AMMI analysis employing Gollob’s test, first two PC explained 100% of the G × E variation. PC 1 and PC 2 explained 87.19% and 12.81% of total G × E interactions for Fe concentration and likely for Zn concentration; PC1 and PC2 explained 70.11% and 29.88%, respectively. The critical perusal of biplot revealed that Parawnipur locations was found to discriminating power for Fe concentration while for Zn concentration Khajura location was found to be most discriminative. The critical analysis of pedigree vis-à-vis micronutrient concentration did not reveal any correlation. This is probably the first report on iron and zinc concentration in lentil from Nepal.
Keywords
Lens Culinaris, Fe and Zn Concentration, G x E Interactions, AMMI Analysis
Introduction
Lentil (Lens Culinaris Medikus Subspecies Culinaris) is an annual diploid (2n = 2x = 14), self-pollinated and cool season legume crop grown in South Asia, Mediterranean region and North America. It is an important food legume with various uses as food and feed because of its protein-rich grains and straw. Globally, it is cultivated as a rainfed crop on 6.65 million hectares (m ha) area with 7.76 million tons production [1]. World lentil production has risen steadily by nearly eight times (843%) from an average of 0.92 mt in 1961-63 to 7.76 mt in 2017-18. This growth is primarily from an expanding harvested area from 1.64 m ha in 1961-63 to 6.65 m ha in 2017- 18. Additionally, it also reflects an improvement in productivity from an average yield of 560 kg ha-1 in 1961-63 to 1072 kg ha-1 by 2017-18. Lentils are consumed as a whole food in more than 54 countries, and annual world lentil production is approximately 7590761MT [1]. Approximately 54.4% of world’s lentils are grown in South Asia, and nearly 1.5 billion people in this area consume 70% of the global lentil supply. Lentil in the diets of the people of South and West Asia, North and East Africa, and many developing countries provides nutritional security by supplying protein, Fe, Zn, and other macro- and micronutrients. The demands for lentil are expected to rise further due to population growth and rising income. By 2030, the world lentil consumption is estimated at 5.5 mt, being an increase of almost 2 mt from the present level [2]. In Nepal, lentil was grown in about 206969 ha with production of 254308 ton during 2017-18. This crop is mainly grown as rain fed crop in Dang, Banke, Bardia, Kailali, Bara, Parsa, Rauthat, Siraha, Saptari and Nawalparasi districts. It is the fifth most important crop grown after rice, maize, wheat & millet in terms of area [3]. Nepalese lentils are rich sources of proteins and micronutrients (Fe, Zn, Se), almost organic, fast cooking quality, small seeded, red cotyledons for human health and straws as a valuable animal feed [4]. Its ability to sequester N and C improves soil nutrient status, which in turn provides sustainable production systems. Globally, two billions peoples are directly affected from micronutrient malnutrition called hidden hunger affecting 1 in three people. Selenium (Se), iron (Fe), and zinc (Zn) deficiencies affect large numbers of people worldwide. Of the world’s six billion people, 60% are Fe deficient, 30% are Zn deficient, and 15% are Se deficient [5]. Fe deficiency that lead to maternal mortality, mental damage of children and lower disease resistance [6,7]. The main role of Fe is to transport of O2 by RBC within hemoglobin molecules [7]. Fe def. anemia causes the most common nutritional disorder in the world. It is estimated to be 55.1% in children under five, 31% in school age children, 63.5% in pregnant women, and 35% in manual laborer (Directorate of Public Nutrition, 1993). Iron deficiency is more prevalent and vulnerable in developing countries like Nepal where around 23% peoples are suffering from the Fe deficient. Likely Zn deficiency is responsible for stunting, lower respiratory tract infections, and malaria and diarrhea disease in human beings. Approximately 1.4% (0.8 million) worldwide deaths (diarrhea, pneumonia, and malaria in children) were attributed to Zn def [8]. The main role of Zn is in several metabolic pathways including protein synthesis, cellular growth and differentiation [9,10]. It is reported that Zn deficiency cause anorexia, depression, altered reproductive biology, gastro¬intestinal problems and impaired immunity [11]. Therefore, Fe and Zn are two essential nutrients for human nutrition. Iron is an integral part of protein involved in oxygen transport (hemoglobin, myoglobin), energy metabolism (cytochromes) and steroid and xenobiotic metabolism (cytochromes) [12]. Zinc is found in some 300 enzymes and is necessary for DNA replication, protein synthesis, reduction of free radical formation, proper sense of taste in food, and protection against brain tumors [13,14]. Indeed, micronutrient deficiency is caused due to non/poor availability of minerals in the diet. Hidden hunger is caused by a lack of vital minerals and vitamins in the diet. Harvest Plus focuses on three critical micronutrients recognized by the World Health Organization as most lacking in the diets of the poor (Vitamin A, Zinc & Iron). Dietary diversification, supplements and fortified foods are the important means to reduce micronutrient malnutrition.
Bio fortification is a process of increasing the levels of vitamins and minerals in food crops through plant breeding or agronomic practices, without compromising yield. When eaten regularly, bio fortified foods measurably improve nutritional status and health. Bio fortification is cost-effectiveness, highly sustainable and feasible [15]. Lentil is useful for human, animal and soil health. Lentil is important source of energy, protein, carbohydrate, fibre, mineral, and vitamin, antioxidant compound. It is a good source of vitamin A, potassium, vitamin B complex and iron. Within the existing food systems, micronutrient dense (Fe, Zn, and b-carotene) lentil cultivars will have a major effect in mitigating micronutrient deficiency syndromes, and the rural poor are the target group. A number of lentil cultivars have superior nutrient profiles, creating opportunities to enhance bio fortification and bioavailability by extensive induction of nutritional and anti-nutritional traits [16]. Also lentil has an excellent macro and micronutrient profile and favorable levels of mineral bioavailability enhancing factors. Lentil is cheap source of quality protein for poor and vegetarians [17,18]. The United Nations declaration of the 2016 International Year of Pulses recognized the role of pulses in human and animal health, environmental sustainability and economic benefits [19,20]. It has been documented that a huge population, particularly women and children in South Asia and sub-Saharan Africa, suffer from Fe, Zn, and Vitamin A deficiencies. To mitigate the problem of micronutrient malnutrition in developing countries under the Harvest Plus Program, in addition to improving yield, the aim of the study is to develop lentil cultivars with high contents of Fe and Zn [21]. The International Center for Agricultural Research in the Dry Areas (ICARDA) has a world mandate from CGIAR for lentil improvement. It delivers improved genetic material to the national programs of developing countries to develop new improved cultivars. Under the Harvest Plus Program, ICARDA conducts research to develop micronutrient-dense lentil genotypes to deliver to national programs. Its gene bank holds >11,000 accessions of diverse lentils collected from 72 countries, which are the key to genetic enhancement for micronutrients [22]. Out of 234 lines evaluated in Nepal, Fe content varied from 41 to 71 mg kg-1 in red lentils and from 59 to 89 mg kg-1 in green lentils, and Zn content in red lentils was 22 to 60 and 32 to 55 mg kg-1 in green lentils. These considerable variations in Fe and Zn contents suggest a scope for improvement in these traits [23]. Since in Nepal, no well report is available on estimation of Fe (iron) and Zn (Zinc) concentration and its stability across locations in lentil. The objectives of the study was to understand the genetic variability, effect of G x E interaction in lentil and to characterize and identify lentil germplasm accessions and breeding lines with stable concentrations of Fe and Zn in the seed which were also adapted environments in Nepal. The most widely used is the regression method, which is based on regressing the mean value of each genotype on the environmental index or marginal means of environments [24,25]. AMMI analysis provides a graphical representation (biplot) to summarize information on main effects and interactions of both genotypes and environments simultaneously [26].
Materials and Methods
Genetic material The experimental material for the present study comprised of 25 lentil accessions originated from SAARC countries (14 accessions: Nepal-7, India-6, Bangladesh-1) and ICARDA (11 accessions). These accessions were tested in Genotypes x Environment bio fortification trial during 2016-17. These accessions were analyzed for seed Fe and Zn concentration (Table 1).
The test entries were evaluated at three locations in Grain Legumes Research Program (GLRP), Khajura, Banke at 810 37” East longitudes and 280 06” North latitude and an altitude of 181 meters above mean sea level, NMRP/NCRP, Rampur, Chitwan at 27o 40′ N latitude, 84o19′ E longitude at an altitude of 228m above mean sea level and RARS, Parwanipur at the latitude 270 4’40.9’’N and longitude 84056’9.85”E as well altitude 75m above sea level during winter season 2016-17. The soils at Parwanipur are categorized as silt loam while at Rampur are well drained sandy loam and at Khajura are sandy to silty loam type. Surface soils samples were collected from each site of three terai environments (i.e. Regional Agricultural Research Station (RARS), Parwanipur, National Maize Research Program (NMRP), Rampur and Grain Legumes Research Program (GLRP), Nepalgunj before planting the G x E bio-fortified lentil trials. At least, soil samples were taken from representative 10 points of each replication under plough level soil depth i.e. 0-20 cm through using the soil auger and thoroughly mixed representative soil samples and made a composite sample of 0.5 kg of each replication i.e. three samples of each site had sent to the laboratory of Soil Science Division (SSD), Khumaltar for soil micronutrient Iron (Fe) and Zinc (Zn) analysis. The random method based on the variability of the land was used to collect soil samples. The different soil parameters tested as well as methods adopted to analyze the soil samples.
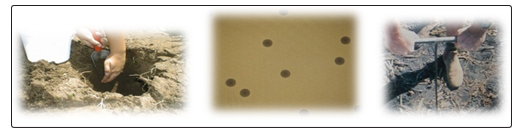
Figure: Distribution of Soil Samples Points during Soil Sampling
Soil Fe and Zn concentration at the experimental sites was estimated using standard procedures [27]. For the sample preparation methods; we require different sample preparation methods depending on the target suite of elements. Hence we used DTPA (Diethylenetriaminepentaacetic acid) extraction for the analysis of micronutrients (Fe and Zn) in soils and also need require extraction of macro nutrients Na, K, Ca and Mg for the determination of exchangeable cation with 1 M ammonium acetate. Descriptive statistics (mean, range, standard deviation, standard error, coefficient of variation) of soil parameters were computed using the Minitab 17 package. Rating (very low, low, medium, high and very high) of determined values were based on Soil Science Division, Khumaltar, Lalitpur, Nepal. The coefficient of variation was ranked according to the procedure of where, CV ≤ 25% = low variation, CV ≥25 ≤ 50% = moderate variation, CV >50% = high variation. For available soil Fe (ppm) and Zn (ppm) analysis, strictly followed protocols by DTPA [28,29].
The accessions were planted in Alpha-lattice design (5 x 5) with three replications per entry (6 rows per replication) with plant to plant spacing of 5cm and row to row spacing of 25cm. A unit plot comprise 2-meter length row with a plot size of (3 m2). Five random plants from each plot were handled following the procedure suggested by Harvest Plus [21].
Determination for Lentil Grain Fe and Zn Contents
Atomic Absorption Spectrophotometer (AAS) was used for grain Fe and Zn concentration and model no. was Agilent 200. The grains were cleaned by mild hot water and dried at 35°C for five days in a contamination and corrosion free oven. From each sample, 5gm of grains were grounded manually into fine powder using mortar and pestle. Dust contamination was completely avoided. Biochemical analysis was carried out on triplicate ground samples of seeds from individual plant by digestion with 9:4 di-acid mixture (HNO3: HClO4) protocol using a microwave digestion system (Multiwave ECO, Anton Paar, les Ulis, France) followed by atomic absorption spectrometry (AAS) method using ECIL AAS (Perkin Elmer) as per the protocol described by Zarcinas et al., and Singh et al.. [27,30].
Methodology Details
Apparatus and Reagents
De-ionized water may be used. See 965.09A and B (See 2.6.01 and following
a. Potassium stock solution: 1000µgK/mL. Dissolve 1.9066 g dried (2h at 105°C) KCl in H20 and dilute to 1 L. Use following parameter for Table 965.09 (See 2.6.01): 7665 A (&66.5nm), air –C2H2 flame, and 0.04 -2 µg/mL range.
b. Calcium Stock solution – Prepare Ca stock solution and working standards as in 965.09B (see 2.6.01).
c. Cu, Fe, Mg, Mn, and Zn stock solutions – Prepare as in 965.09B (b), (c), and (e)-(g) (see 2.6.01).
d. Working standard solutions – Dilute aliquots of solutions, ©, with 10% HCl to make ≥4 standard solutions of each element within range of determination.
A. Preparation of Test Solutions
a. Dry Ashing: Accurately weigh 1 g test portion, dried and ground as in 922.02 (a) (see 3.1.02), into glazed, high form porcelain crucible, Ash 2 h at 500 °C and let cool. Wet ash with 10 drops H2O and carefully add 3-4 mL HNO3 (1+1). Evaporate excess HNO3 on hot plate set at 100O-120°C. Return crucible to furnace and ash additional 1h at 500°C. Cool crucible, dissolve ash in 10 mL HCl (1+1), and transfer quantitatively to 50 mL volumetric flask.
b. Wet Ashing: Accurately weigh 1 g test portion, dried and ground as in 922.02 (a) (see 3.1.02), into 150mL Pyrex beaker. Add 10mL HNO3 and let soak thoroughly. Add 3 mL 60% HClO4 and heat on hot plate, slowely at first, until frothing ceases. Heat until HNO3 is almost evaporated. If charring occurs, cool, add 10mL HNO3, and continue heating. Heat to white fumes of HClO4, cool, add 10 mL HCl (1+1), and transfer quantitatively to 50 mL volumetric flask.
B. Determination
a. To solution in 50 mL volumetric flask, add 10 mL 5% La solution, 965.09B (d) (see 2.6.01), and dilute to volume. Let silica settle, decant super mate, and proceed as in 965.09B (d) (see 2.6.01). Make necessary dilutions with 10% HCl to obtain solutions within range of instrument.
|
Standard |
Potency (ppm) |
Source |
Lamp Serial no. |
|
Iron(Fe) |
1001 |
Merck |
10N1544 |
|
Zinc(Zn) |
998 |
Merck |
11L292 |
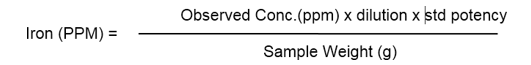
Calculations
Element, ppm (µg/mL) x F/g test portion, Element % = ppm (µg/g) x 10-4 where F= (mL original dilution) x mL final dilution)/mL aliquot if original 50 mL is diluted.
Sample Dilution: SPL (1G) ---à 100 ml
Methodology Details for Grain Zn Concentration Analysis Using Atomic Absorption Spectrophotometer (AAS)
Principle
Test portion is wet or dry a shed. Residue is taken up in acid and diluted to optimum working range. A of this solution as determined by AAS at 213.8nm is converted to Zn concentration through calibration curve.
Reagents
(Use Pyrex glasses exclusively, clean thoroughly before use with HNO3. If glass beads are used to prevent bumping, clean first with strong alkali followed by hot with HNO3. Since pt used in laboratory may contain significant traces of metals, clean pt dishes by KHSO4 fusion followed by 10% HCl leach.)
Zinc standard solution
Stock solution
500 µg/mL. Dissolve 0.500 g pure Zinc metal in 5-10mL HCl Evaporate almost to dryness and dilute to 1 L with H2O. Solution is stable indefinitely.
Working solution
Dilute aliquots of stock solution with H2SO4 (1+49) or 0.1 M HCl (depending on method of ashing) to obtain ≥5 solutions within range of instruments. Prepare standards o-10 µg/mL range daily (Don’t use <2 mL pipets or <25 mL volumetric flasks).
Acids
Reagent grade HNO3, HCl, and H2SO4, test acids from freedom from Zn by AA measurement of appropriately diluted portion. If contaminated, purify HNO3, and HCl by distillation. Further test purity of reagents and efficiency of cleaning by conducting blank determination by appropriate hashing methods.
Preparation of test Solution
Prepare representative test sample by mixing, blending or grinding.
Wet Ashing
Accurately weigh into 300 mL or 500 mL Kjeldahl flask , test portion ≥10 g, estimated to contain 25-100 µg Zn (If material is liquid , evaporate to small volume) Add ca 5 mL HNO3, and continuously heat until first vigorously reaction subsides. Add 2 mL H2SO4 and continue heating, maintaining oxidizing conditions by adding HNO3 in small increments (large amounts may introduce Zinc) until solution is colorless. Continue heating until dense fumes of H2SO4 are evolved and all HNO3 has been removed. Cool, dilute with Ca 20 mL H2O filter through fast paper (prewashed) into 100 mL volumetric flask and dilute to volume with H2O. Dilute further if necessary with H2SO4 (1+49) to attain working range of spectrophotometer.
Dry Ashing
Accurately weigh into clean pt dish representative test portion estimated to contain 25-100 µg Zn. Char under 1R lamp and ash at temperature ≤ 525 °C until C free.(Raise temperature of furnace slowly to 525°C to avoid ignition) Dissolve ash under watch glass in minimum volume HCl (1+1). Add ca 20 mL H2O and evaporate to near dryness on steam bath. Add 20 mL 0.1 M HCl and continue heating ca 5 minute. Filter through fast paper into 100 mL volumetric flask. Wash dish and filter with several 5-10 mL portions of 0.1 M HCl, cool, and dilute to volume with 0.1 M HCl. Dilute further, if necessary with 0.1 M HCl to attain working range of instrument.
Determination
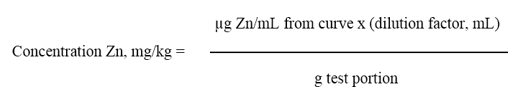
Set instrument to previously established optimum conditions or according to manufacturer’s instructions. Determine A of a shed solutions or dilution, and ≥5 standards within optimum working range, taking ≥ 2 readings (before and after test readings) Flush burner with H2O and check 0 point between readings. Determine Zn content from standard curve obtained by plotting A against µg Zn/mL:
Statistical Analysis
The seed micronutrient data was subjected to analysis of variance (ANOVA) from the three environment trials for testing the significance of variation due to the genotypes, environment , years and their interaction for two seed quality traits using Genotype by Environment Analysis with R (GEA-R) and R-Stat version 3.5.3 statistical software. Stability analysis was performed following the Eberhart and Russell, 1966 regression model.
Yij = µ + bi Ij + δij + εij
where Yij is the mean for the genotypes i at location j; m is the general mean for genotype i; bi is the regression coefficient for the ith genotype at a given location index, which measures the response of a given genotype to varying location; Ij is the environmental index, which is defined as the mean deviation for all genotypes at a given location from the overall mean; δij is the deviation from regression for the ith genotype at the jth location and εij is the mean for experimental error. A genotype having non-significant deviation from regression (s2di = 0) and unit regression coefficient (bi=1) was considered as stable.
The analysis of variance of each location and combined analysis of variance over locations were done as per Gomez and Gomez [31]. The environmental mean was the mean of all genotypes in each environment. The pooled error was used to test the hypothesis that the mean square deviation did not differ significantly from 0 at 0.05 and 0.01% probability levels. The t-test employing the standard error of regression coefficient against the hypothesis that it did not differ from 1.0 was performed. It was assumed that genotype effects were fixed and year effects were random. Further, AMMI model, which combines ANOVA with principal component analysis (PCA) was used to study the agronomic nature of Genotype x Environment Interactions using (GEA-R) and R-Stat version 3.5.3. Plots were prepared as described by Zobel et al., using mean and first two PC scores [32]. The model AMMI uses the biplot constructed through the principal components generated by the interaction environment-genotype. If there is such interaction, the percentage of the two principal components would explain more than the 50% of the total variation; in such case, the biplot would be a good alternative to study the interaction environment-genotype, Crossa [26].
The AMMI model is
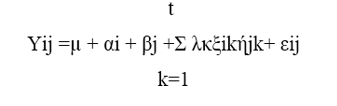
where t is the number of SVD axes retained in the model, λk is the singular value for the SVD axis k, ξik is the singular value of the genotype i for the SVD axis k, ξjk is the singular value of the environment j for the SVD axis k, and εij is the error term of the models, where εij~iid N (0, δ2).
Results and Discussion
In this study, 25 lentil accessions were evaluated at three diverse locations for grain Fe and Zn concentrations. Analysis of variance (ANOVA) indicated that the accessions under study were found varied significantly (P=<0.001) for both seed Fe and Zn concentrations at all the three locations. The ranges for seed Fe concentration were 71.81ppm (ILL-2712)-154.03 ppm (PL-4) (mean 103.34 ppm) at Khajura, 79.89 ppm (ILL-3490)-128.14 ppm (PL-4) (mean 95.43 ppm) at Parwanipur, and 83.92 ppm (ILL-7979) -137.63 ppm (ILL-6819) (mean 103.11ppm) at Rampur (Table 1), while the range across all the three locations was 82.53 ppm (ILL-7979) -133.49 ppm (PL-4) (mean 101.04 ppm). Likely the range for seed Zn concentration was 53.76 ppm (ILL-7723)-70.15 ppm (ILL-4605) (mean 61.84 ppm) at Khajura, while the ranges for Parwanipur and Rampur were 54.21 ppm (ILL-7723) -91,94 ppm (ILL-4605) (mean 76.55 ppm) and 46.41 ppm (LG-12)-59.95 ppm (ILL-4605) (mean 54.27 ppm) , respectively. The range across the three environments was 54.03 ppm (ILL-7723)-75.34 ppm (HUL-57) (mean 64.22 ppm). The environmental index for Fe and Zn in seed varied from location to location. It was –7.37 (Fe) and 2.61 (Zn) at Khajura, 0.776 (Fe) and -4.75 (Zn) at Parwanipur while at Rampur the index was 6.596 for Fe and 2.13 for Zn. The pooled ANOVA (Table 1) was carried out after ascertaining that the homogeneity of error variance using the Bartlett’s test. G x E interactions were found to be significant (at P=<0.001) for Zn micronutrient but insignificant interaction was found in Fe micronutrient.
Table 1: Pooled Mean ANOVA for Seed Fe and Zn Concentration across the Environment over the Years Using R-Stat General Linear Model and GEA-R
|
Entry |
Accessions |
Fe (ppm) |
Zn(ppm) |
|
1 |
ILL-8006 |
90.63 |
64.98 |
|
2 |
RL-6 |
97.13 |
64.8 |
|
3 |
ILL-7715 |
94.23 |
65.68 |
|
4 |
ILL-7164 |
97.6 |
63.99 |
|
5 |
Khajura-2 |
114.66 |
62.78 |
|
6 |
Shital |
96.21 |
67.08 |
|
7 |
Sagun |
95.43 |
67.51 |
|
8 |
HUL-57 |
112 |
75.34 |
|
9 |
LG-12 |
87.23 |
64.18 |
|
10 |
RL-11 |
96.96 |
62.08 |
|
11 |
RL-4 |
84.77 |
63.39 |
|
12 |
Black Masuro |
86.41 |
58.38 |
|
13 |
RL-79 |
121.59 |
65.12 |
|
14 |
ILL-6467 |
122.67 |
64.84 |
|
15 |
ILL-7979 |
82.53 |
63.47 |
|
16 |
RL-12 |
98.14 |
62.79 |
|
17 |
ILL-2712 |
87.68 |
65.56 |
|
18 |
PL-4 |
133.49 |
58.76 |
|
19 |
Simal |
95.85 |
68.07 |
|
20 |
ILL-3490 |
91.74 |
57.06 |
|
21 |
ILL-6819 |
116.94 |
67.93 |
|
22 |
ILL-7723 |
94.09 |
54.03 |
|
23 |
WBL-77 |
87.77 |
63.22 |
|
24 |
ILL-4605 |
125.02 |
74.01 |
|
25 |
RL-49 |
104.86 |
60.41 |
|
|
Mean |
101.04 |
64.22 |
|
|
P-value |
|
|
|
|
Genotypes |
0.007634 ** |
2.357e-05 *** |
|
|
Environment |
9.012e-08 *** |
6.982e-05 *** |
|
|
G x E interaction |
0.784 |
0.009326 ** |
|
|
CV% |
22.87 |
10.98 |
|
|
LSD |
26.31 |
8.06 |
|
|
PC1 (87.2%) |
<0.001 |
<0.001 |
|
|
PC2 (12.8%) |
0.87 |
<0.001 |
Note: Significance Code: 0 ‘***’ 0.001 ‘**’ 0.01 ‘*’ 0.05 ‘.’ 0.1 ‘ ’ 1
Table 2: Micro Nutrients (Fe, Zn) Analysis Reports of Soil Samples
|
SN |
Laboratory No. (sample code) |
Description of soil |
Soil testing site |
Chemical properties |
|
|
Fe (ppm) |
Zn(ppm) |
||||
|
1 |
603 |
Rep I |
RARS, Parwanipur |
85.88 |
0.51 |
|
2 |
604 |
Rep II |
RARS, Parwanipur |
70.3 |
0.65 |
|
3 |
605 |
Rep III |
RARS, Parwanipur |
68.85 |
0.7 |
|
Mean |
75.01 |
0.62 |
|||
|
4 |
606 |
Rep I |
NCRP, Rampur |
48.76 |
0.53 |
|
5 |
607 |
Rep II |
NCRP, Rampur |
37.64 |
0.45 |
|
Mean |
|
|
|||
|
6 |
608 |
Rep I |
GLRP, Khajura |
47.8 |
0.58 |
|
7 |
609 |
Rep II |
GLRP, Khajura |
58.3 |
0.7 |
|
8 |
610 |
Rep III |
GLRP, Khajura |
62.4 |
0.65 |
|
Mean |
56.17 |
0.64 |
|||
|
Grand Mean |
|
|
|
58.13 |
0.58 |
Source: SSD, Khumaltar
Soil Analysis
The soil physical properties (texture, structure and color), pH, organic matter, primary nutrients, secondary nutrients and micronutrients (B, Fe, Zn, Cu and Mn) etc., are the key indicators of soil fertility [33]. These parameters indeed can predict the plant growth and development. Understanding of the soil fertility status is vital to develop proper soil management strategies helping in designing the planning crop cultivation in proposed area. Seed micronutrient concentration depends upon factors like soil type, soil fertility status, soil moisture, G x E, genotypic variation, soil profile, crop management practice and interaction among nutrients [34]. Soil Fe and Zn concentration at three locations were recorded as 75.01 ppm Fe and 0.62 ppm Zn at RARS, Parwanipur, 43.2 ppm Fe and 0.49 ppm Zn at NMRP, Rampur and 56.17 ppm Fe and 0.64 ppm Zn at GLRP, Khajura.
The available iron content ranged from 3.64 to 85.88 ppm with a mean of 58.13 ppm. This data indicated that it was found very high status of available iron in all three locations (Figure 1, Table 2). Likewise the available zinc content ranged from 0.45 ppm to 0.7 ppm with a mean of 0.58 ppm. This data clearly indicated that it was found low status of zinc in all three locations based on the soil parameters interpretations (Table 2 and 3, Fig ii). Thus, abovementioned micronutrient data indicated that the soil status exhibited variation for Fe and Zn concentration at the studied locations.
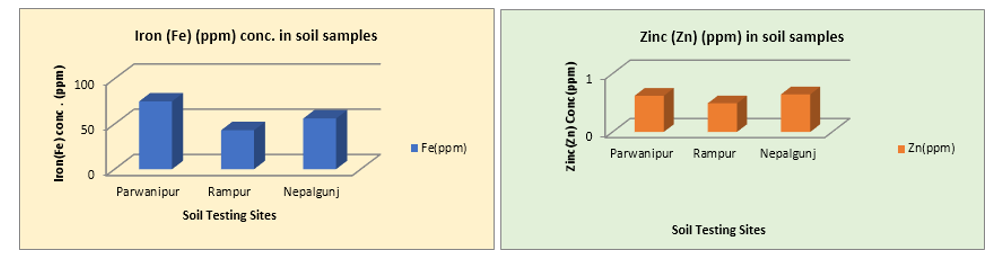
Figure 1: Distribution of soil iron in three locations (Left) and Figure 2: Distribution of soil zinc in three locations (Right)
Annex 1: Soil parameters interpretation at SSD, Khumaltar, 2016
|
SN |
Soil parameters |
Unit |
Very low |
Low |
Medium |
High |
Very High |
|
1 |
Available Fe |
ppm |
<5 |
5-10 |
10-16 |
16-25 |
>25 |
|
2 |
Available Zn |
ppm |
<0.5 |
0.5-1.0 |
1-3 |
3-6 |
>6 |
Table 3: Stability Parameters of 25 Lentil Accessions Studied Across Three Locations
|
Entries |
Genotypes |
Seed Zn |
Seed Fe |
||||
|
Mean |
bi |
S2di |
Mean |
bi |
S2di |
||
|
1 |
ILL-8006 |
64.9867 |
1.2329 |
8.3611 |
90.64 |
1.58 |
-57.41 |
|
2 |
RL-6 |
64.8033 |
1.2191 |
-3.5762 |
97.14 |
1.06 |
-45.52 |
|
3 |
ILL-7715 |
65.685 |
1.3271 |
1.4367 |
94.23 |
1.29 |
-65.55 |
|
4 |
ILL-7164 |
63.9917 |
1.0759 |
-4.9447 |
97.6 |
1.91 |
-71.91 |
|
5 |
Khajura-2 |
62.78 |
1.113 |
-0.4699 |
114.66 |
0.47 |
-34.26 |
|
6 |
Shital |
67.08 |
0.9633 |
13.266 |
96.22 |
3.2 |
128.84 |
|
7 |
Sagun |
67.5117 |
0.8727 |
-3.3458 |
95.43 |
0.95 |
-70.78 |
|
8 |
HUL-57 |
75.3433 |
0.7763 |
356.94 |
112 |
0.56 |
312.09 |
|
9 |
LG-12 |
64.1883 |
1.1922 |
0.1648 |
87.23 |
1.04 |
-45.06 |
|
10 |
RL-11 |
62.08 |
0.9135 |
-2.5701 |
96.96 |
2.29 |
51.82 |
|
11 |
RL-4 |
63.395 |
1.1488 |
7.261 |
84.78 |
0.83 |
-78.51 |
|
12 |
Black Masuro |
58.3867 |
1.1205 |
-2.971 |
86.42 |
1.18 |
-92.95 |
|
13 |
RL-79 |
65.12 |
1.4387 |
48.8843 |
121.59 |
-1.16 |
540.24 |
|
14 |
ILL-6467 |
64.845 |
1.0613 |
1.1921 |
122.67 |
1.85 |
3458.64 |
|
15 |
ILL-7979 |
63.4767 |
1.232 |
19.5391 |
82.53 |
-2.41 |
12.56 |
|
16 |
RL-12 |
62.795 |
1.2505 |
-3.956 |
98.15 |
2.01 |
-60.77 |
|
17 |
ILL-2712 |
65.5633 |
0.7389 |
26.6607 |
87.68 |
0.59 |
537.97 |
|
18 |
PL-4 |
58.765 |
0.3709 |
7.0387 |
133.49 |
1.42 |
480.94 |
|
19 |
Simal |
68.0717 |
1.1652 |
0.507 |
95.86 |
2.47 |
425.18 |
|
20 |
ILL-3490 |
57.0667 |
0.0706 |
-3.5533 |
91.75 |
0.39 |
428.16 |
|
21 |
ILL-6819 |
67.9317 |
1.7811 |
-3.7489 |
116.94 |
-1.34 |
1026.56 |
|
22 |
ILL-7723 |
54.035 |
0.0071 |
-5.2636 |
94.09 |
2.25 |
-88.97 |
|
23 |
WBL-77 |
63.2283 |
1.0073 |
-5.1681 |
87.78 |
1 |
356.64 |
|
24 |
ILL-4605 |
74.0133 |
1.4419 |
-5.074 |
125.03 |
-0.17 |
153.39 |
|
25 |
RL-49 |
60.4167 |
0.4796 |
11.7699 |
104.87 |
1.75 |
46.4 |
Stability Coefficient Analysis
Four lentil accessions viz., Sagun, WBL-77, LG-12, RL-6 were identified as stable genotypes for seed Fe concentration based on regression coefficient (bi) while accessions Black Masuro, ILL-7723, RL-4, ILL-7164, Sagun, ILL-7715, RL-12, ILL-8006, RL- 6, LG-12, Khajura-2 were identified as stable genotypes for seed Fe concentration based on the value of mean square deviation (S2di) while RL-11, Shital, WBL-77, LL-6467, ILL-7164 were identified as stable genotypes for seed Zn concentration based on regression coefficient (bi) while accessions ILL-7723, WBL-77, ILL-4605, ILL-7164, RL-12, ILL-6819, RL-6, ILL-3490, Sagun, Black Masuro, RL-11, Khajura-2 were identified as stable genotypes for Zn Concentration based on the value of mean square deviation (S2di) (Table 3). From the study, it was proved that genotypes Sagun, RL-6 and LG-12 were more stable for seed Fe concentration and genotypes WBL-77, ILL-7164, RL-11 were found more stable for seed Zn concentration.
The present study indicated higher sensitivity of seed Fe to environmental fluctuations. The study further revealed no correlation between seed Fe and Zn concentrations at all the three locations in the analyzed genotypes. This indicated the possibility of genetically improving the two target traits independent of each other using this specific set, including the most promising genotypes.
AMMI Analysis
Pooled analysis of variance (ANOVA) was carried out after analyzing the homogeneity of error variance using the Bartlett’s test and the total iron and zinc concentration using GEA-R is presented in Table 1. There were significant differences among the genotypes, environments and G × E interactions for seed Zn concentration but there were not significant differences of G x E interactions for seed Fe concentration. Significant G × E interactions explained 41.55% and 17.12% of total sum of squares for Fe and Zn concentration respectively, which shows that although both the micronutrients are influenced by environments, seed Fe is relatively more sensitive to environmental fluctuations than seed Zn. Genotypic contribution towards total sum of squares were 54.66% for Fe and 16.14% for Zn concentration. Significant genotypic and environment differences suggested that genes necessary for micronutrient enrichment traits are available within the lens genome that could help for significant increases in seed Fe and Zn concentrations by recombination and directional selection. However, the ranges and means of seed Fe and Zn concentration varied widely at different locations due to the differences attributable to genotypes, environments as well as G × E interactions. In the AMMI analysis employing Gollob’s test, first two PC explained 100% of the G × E variation. PC 1 and PC 2 explained 87.19% and 12.81% of total G × E interactions for Fe concentration and likely for Zn concentration; PC1 and PC2 explained 70.11% and 29.88%, respectively.
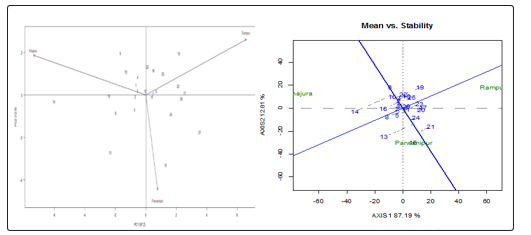
Figure 3: AMMI (Additive Main Effects and Multicative Interactions Model) Plots for Seed Fe (a) Between Two PC and (b) Between Mean vs. Stability
The graphical method was employed by using two PC to investigate environmental variation and interpret the G × E interaction for Fe (Fig. 3a) and Zn (Fig. 4a) concentration [35]. Also, the AMMI biplot analysis between the mean vs. stability of G x E interactions (Figs. 3b & 4b) clearly indicated the distinct behavior of the environment. The lentil accessions closer to the origin of biplot were stable across the three test locations. For Fe concentration, the genotypes Black Masuro, Sagun, RL-4 and LG-12 were high and widely adapted for three locations. The genotype RL-79, ILL-6819 and ILL-6467 had high in Fe concentration but widely deviated from the origin of biplot that’s why breeder cannot select it for hybridization program so ILL-7164 and RL-49 can be selected for hybridization program based on AMMI stability value and high Fe concentration basis whereas genotype simal, ILL6819, ILL-2712, ILL-3490 and WBL-77 showed highest Fe concentration but displayed more deviation from the origin of biplot (Fig. 3b).
Table 4: Stability Analysis Based on the AMMI Stability Value for Grain Fe Concentration
|
Entry |
ASV |
YSI |
rASV |
rYSI |
means |
|
12 |
0.199 |
24 |
1 |
23 |
86.41 |
|
11 |
1.032 |
26 |
2 |
24 |
84.77 |
|
7 |
1.24 |
18 |
3 |
15 |
95.43 |
|
22 |
1.35 |
21 |
4 |
17 |
94.09 |
|
3 |
1.43 |
21 |
5 |
16 |
94.23 |
|
4 |
1.61 |
16 |
6 |
10 |
97.6 |
|
16 |
1.71 |
16 |
7 |
9 |
98.14 |
|
1 |
1.73 |
27 |
8 |
19 |
90.63 |
|
9 |
1.8 |
31 |
9 |
22 |
87.23 |
|
2 |
1.81 |
21 |
10 |
11 |
97.13 |
|
5 |
2.01 |
17 |
11 |
6 |
114.66 |
|
25 |
3.09 |
20 |
12 |
8 |
104.86 |
|
10 |
3.57 |
25 |
13 |
12 |
96.96 |
|
24 |
4.42 |
16 |
14 |
2 |
125.02 |
|
15 |
4.72 |
40 |
15 |
25 |
82.53 |
|
6 |
4.76 |
29 |
16 |
13 |
96.21 |
|
8 |
5.23 |
24 |
17 |
7 |
112 |
|
23 |
5.54 |
38 |
18 |
20 |
87.77 |
|
19 |
5.97 |
33 |
19 |
14 |
95.85 |
|
20 |
6.08 |
38 |
20 |
18 |
91.74 |
|
18 |
6.33 |
22 |
21 |
1 |
133.49 |
|
17 |
6.63 |
43 |
22 |
21 |
87.68 |
|
13 |
6.7 |
27 |
23 |
4 |
121.59 |
|
21 |
9.37 |
29 |
24 |
5 |
116.94 |
|
14 |
15.72 |
28 |
25 |
3 |
122.67 |
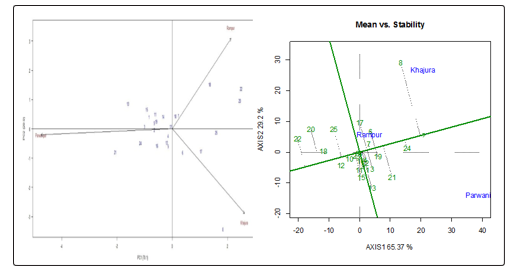
Figure 4: AMMI (Additive Main effects and Multiplicative Interactions model) Plots for Seed Zn (a) Between Two PC and (b) Between Mean vs. Stability
Table 5: Stability Analysis Based on the AMMI Stability Value for Grain Zn Concentration
|
Entry |
ASV |
YSI |
rASV |
rYSI |
means |
|
23 |
0.107 |
18 |
1 |
17 |
63.22 |
|
4 |
0.321 |
16 |
2 |
14 |
63.99 |
|
10 |
0.471 |
23 |
3 |
20 |
62.08 |
|
12 |
0.555 |
27 |
4 |
23 |
58.38 |
|
7 |
0.566 |
10 |
5 |
5 |
67.51 |
|
5 |
0.619 |
25 |
6 |
19 |
62.78 |
|
14 |
0.652 |
18 |
7 |
11 |
64.84 |
|
19 |
0.924 |
11 |
8 |
3 |
68.07 |
|
6 |
0.986 |
15 |
9 |
6 |
67.08 |
|
2 |
0.986 |
22 |
10 |
12 |
64.8 |
|
9 |
1.007 |
24 |
11 |
13 |
64.18 |
|
16 |
1.02 |
30 |
12 |
18 |
62.79 |
|
11 |
1.06 |
29 |
13 |
16 |
63.39 |
|
1 |
1.34 |
24 |
14 |
10 |
64.98 |
|
3 |
1.53 |
22 |
15 |
7 |
65.68 |
|
15 |
1.56 |
31 |
16 |
15 |
63.47 |
|
17 |
1.76 |
25 |
17 |
8 |
65.56 |
|
24 |
1.83 |
20 |
18 |
2 |
74.01 |
|
25 |
2.44 |
40 |
19 |
21 |
60.41 |
|
18 |
2.57 |
42 |
20 |
22 |
58.76 |
|
13 |
2.6 |
30 |
21 |
9 |
65.12 |
|
21 |
3.25 |
26 |
22 |
4 |
67.93 |
|
20 |
3.86 |
47 |
23 |
24 |
57.06 |
|
22 |
4.05 |
49 |
24 |
25 |
54.03 |
|
8 |
4.43 |
26 |
25 |
1 |
75.34 |
Similarly, the genotypes close to the X-axis (zero value of the first PCA of G x E interaction) were the most stable genotypes across environments for that particular trait. Genotypes WBL-77, RL-11 and Sagun are high in Zn concentration and are widely adapted for three locations (Fig 4a). From Fig. 4b, it is clear that the genotype ILL-7164, Khajura-2 and WBL-77 had less G x E interaction due to being closer to axis. The lines connecting the biplot origin and the margins for the environment are called environment vectors. The angle between two environment vectors is related to the correlation coefficient between them [36]. Based on the angles of the environment vectors the three locations have poor correlation between them for both the traits (Figs. 3a and 4a). Another observation related to length of the environment vector which depicts standard deviation within each environment. The critical perusal of biplot revealed that Parawnipur locations was found to discriminating power for Fe concentration (Fig 5a) while for Zn concentration Khajura location was found to be most discriminative (Fig 5b). The critical analysis of pedigree vis-à-vis micronutrient concentration did not reveal any correlation. The pedigree of genotypes showed high Fe (> 75 ppm) and Zn (> 60 ppm) concentration, here seed Fe concentration had specific parent contributing trait but seed Zn concentration did not indicate specific parent contributing to these traits. The present study clearly indicated the presence of significant variation for seed Fe and Zn concentration among the studied lentil genotypes and presence of genotype x environment interaction, besides identification of a set of promising and stable genotypes for seed micronutrient traits. The study further revealed no correlation between seed Fe and Zn concentrations at all the three locations in the analyzed genotypes. Among all genotypes ILL-7164 was most stable along with relatively better Zn concentration although HUL-57 had highest mean value with some G x E interaction. These genotypes are recommended for commercial cultivation and can also be effectively utilized in the recombination breeding programs to enhance genetic variability in lentil and also for generation of mapping population (s) for undertaking QTL analysis of seed micronutrient traits. This might be probably the first report of the iron and zinc study in lentil from Nepal.
Table 6: Biplot analysis for Grain Fe conc. across the environment over the years
|
Entry |
type |
Fe |
PC1 |
PC2 |
|
1 |
GEN |
90.63 |
-0.64 |
0.47 |
|
10 |
GEN |
96.96 |
-1.3 |
1.089 |
|
11 |
GEN |
84.77 |
0.393 |
-0.102 |
|
12 |
GEN |
86.41 |
-0.029 |
0.184 |
|
13 |
GEN |
121.59 |
-2.34 |
-2.71 |
|
14 |
GEN |
122.67 |
-6.027 |
-0.311 |
|
15 |
GEN |
82.53 |
1.29 |
-3.3 |
|
16 |
GEN |
98.14 |
0.48 |
1.15 |
|
17 |
GEN |
87.68 |
2.54 |
0.079 |
|
18 |
GEN |
133.49 |
-2.42 |
-0.042 |
|
19 |
GEN |
95.85 |
2.16 |
1.96 |
|
2 |
GEN |
97.13 |
-0.693 |
-0.074 |
|
20 |
GEN |
91.74 |
2.33 |
-0.17 |
|
21 |
GEN |
116.94 |
3.52 |
-1.74 |
|
22 |
GEN |
94.09 |
0.101 |
1.33 |
|
23 |
GEN |
87.77 |
2.12 |
0.41 |
|
24 |
GEN |
125.02 |
1.66 |
-0.89 |
|
25 |
GEN |
104.86 |
1.122 |
1 |
|
3 |
GEN |
94.23 |
-0.546 |
0.194 |
|
4 |
GEN |
97.6 |
-0.529 |
0.84 |
|
5 |
GEN |
114.66 |
-0.725 |
-0.694 |
|
6 |
GEN |
96.21 |
-1.66 |
1.968 |
|
7 |
GEN |
95.43 |
0.47 |
0.039 |
|
8 |
GEN |
112 |
-1.97 |
-0.856 |
|
9 |
GEN |
87.23 |
0.689 |
0.174 |
|
Khajura |
ENV |
103.34 |
-7.372 |
2.08 |
|
Parwanipur |
ENV |
95.43 |
0.776 |
-4.99 |
|
Rampur |
ENV |
103.11 |
6.596 |
2.91 |
Table 7: Biplot Analysis for Grain Zn Conc. across the Environment over the Year
|
Entries |
Type |
Zn |
PC1 |
PC2 |
|
1 |
GEN |
64.98 |
-0.83 |
0.41 |
|
10 |
GEN |
62.08 |
0.101 |
0.44 |
|
11 |
GEN |
63.39 |
-0.61 |
0.497 |
|
12 |
GEN |
58.38 |
-0.201 |
-0.46 |
|
13 |
GEN |
65.12 |
-1.602 |
0.85 |
|
14 |
GEN |
64.84 |
-0.32 |
0.41 |
|
15 |
GEN |
63.47 |
-0.92 |
0.66 |
|
16 |
GEN |
62.79 |
-0.55 |
-0.56 |
|
17 |
GEN |
65.56 |
1.03 |
-0.76 |
|
18 |
GEN |
58.76 |
1.35 |
1.52 |
|
19 |
GEN |
68.07 |
-0.58 |
0.25 |
|
2 |
GEN |
64.8 |
-0.64 |
-0.02 |
|
20 |
GEN |
57.06 |
2.44 |
0.96 |
|
21 |
GEN |
67.93 |
-2.06 |
-0.78 |
|
22 |
GEN |
54.03 |
2.49 |
1.37 |
|
23 |
GEN |
63.22 |
-0.04 |
0.07 |
|
24 |
GEN |
74.01 |
-1.15 |
-0.47 |
|
25 |
GEN |
60.41 |
1.59 |
-0.12 |
|
3 |
GEN |
65.68 |
-1.002 |
0.07 |
|
4 |
GEN |
63.99 |
-0.14 |
-0.22 |
|
5 |
GEN |
62.78 |
-0.13 |
-0.58 |
|
6 |
GEN |
67.08 |
0.38 |
-0.79 |
|
7 |
GEN |
67.51 |
0.224 |
0.44 |
|
8 |
GEN |
75.34 |
1.83 |
-3.42 |
|
9 |
GEN |
64.18 |
-0.64 |
0.2 |
|
Khajura |
ENV |
61.84 |
2.61 |
-3.21 |
|
Parwanipur |
ENV |
76.55 |
-4.75 |
-0.22 |
|
Rampur |
ENV |
54.27 |
2.13 |
3.43 |
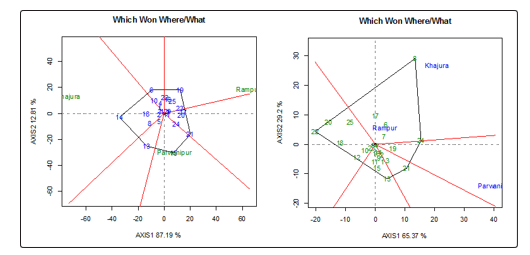
Figure 5: The which-won-where view of the GGE biplot to show which Fe concentration genotypes performed best in which environment (5a) and the which-won-where view of the GGE biplot to show which Zn concentration genotypes performed best in which environment (Fig 5b)
Discussion
The International Center for Agricultural Research in the Dry Areas (ICARDA) leads research to bio fortify lentils with higher levels of iron (Fe) and zinc (Zn). A large number of breeding lines, landraces, and released varieties have been analyzed for iron and zinc content. Iron content ranged from 42–132 ppm and zinc content ranged from 23–78 ppm. Ray et al., evaluated the availability of mineral content in the four commonly grown pulses, field pea (Pisum sativum L.), common bean (Phaseolus vulgaris L.), chickpea (Cicer arietinum L.), and lentil (Lens culinaris Medikus subsp. culinaris), in Saskatchewan, Canada, and found that they contain significant proportions of the recommended daily allowance for Mg, K, Fe, Zn, Mn, Cu, Se, and, in some cases, Ni. Lentil is among the earliest domesticated crops and plays an important role in human, animal, and soil health improvement [37]. Its seed is a rich source of protein and of minerals (K, P, Fe, and Zn) and vitamins, and its straw is a valuable animal feed. Iron and zinc were analyzed at Waite Institute, Australia; University of Saskatchewan, Canada; Indian Agricultural Research Institute, India; and North Dakota State University, USA. Several released varieties that possess high iron and zinc levels and have good agronomic performance have been identified. These varieties are in fast-tracking and include in Bangladesh: Barimasur-4 (86.2 ppm Fe), Barimasur-5 (86 ppm Fe, 59 ppm Zn), Barimasur-6 (86 ppm Fe, 63 ppm Zn), and Barimasur-7 (81 ppm Fe); in Nepal: Sisir (98 ppm Fe, 64 ppm Zn), Khajurah-2 (100.7 ppm Fe, 59 ppm Zn), Khajurah-1 (58 ppm Zn), Sital (59 ppm Zn), Shekhar (83.4 ppm Fe), and Simal (81.6 ppm Fe); in India: Pusa Vaibhav (102 ppm Fe); in Syria/Lebanon: Idlib-2 (73 ppm Fe) and Idlib-3 (72 ppm Fe); and in Ethiopia: Alemaya (82 ppm Fe, 66 ppm Zn) [21]. Identification of fast-track varieties, parents with high iron and zinc were developed and have been used in crossbreeding programs at ICARDA, Bangladesh Agricultural Research Institute (BARI), Nepal Agricultural Research Council (NARC), and Indian Agricultural Research Institute (IARI). Final, intermediate, and primary products have been developed and are under evaluation for yield traits and micronutrient levels. Identification of genetically fixed lines and germplasm with high levels of iron and zinc at ICARDA helped to develop new international nurseries for red lentils. Multi-location testing is strong, and varieties/advanced lines have been tested in Bangladesh, Ethiopia, India, Nepal, and Syria. Significant genotype-by-environment (GxE) interaction was observed in many cases; iron content is more sensitive to environmental fluctuations compared to seed zinc content. A few genotypes were identified with stable high- iron and zinc contents (IPL 320, L4704). Still there are challenges to produce the sufficient quantities of quality seed of high-iron and zinc varieties and the development of high-yielding and high-micronutrient varieties with stable performance across environments. Abiding this, understanding of correlation of iron and zinc levels with other macro- and micronutrients in lentil seeds. High-iron and zinc content lines with excellent agronomic performance are selected from the ICARDA international nursery and national breeding programs of Bangladesh, India, and Nepal and are subject to regional testing. Iron lentils are also being tested in Ethiopia and Syria.
Lentils are an important cool-season legume crop for food and nutritional security of the Nepalese people. Till date, limited efforts have been made to assessment of Fe and Zn content [38]. Among the pulses, lentils are popular dishes in Bangladesh and Nepal; therefore, to assess their nutritive indicators, the present study was conducted to identify high-Fe and Zn-rich lentil accessions in Nepal. Based on a total of 25 accessions, analysis of variance (ANOVA) indicated that the accessions under study were found varied significantly (P=<0.001) for both seed Fe and Zn concentrations at all the three locations. There were significant differences among the genotypes, environments and G × E interactions for seed Zn concentration but there were not significant differences of G x E interactions for seed Fe concentration. The environmental index for Fe and Zn in seed also varied from location to location. De Araujo et al., also reported significant genotypic variation in common bean for micronutrients [39]. Based on the AMMI stability value and high concentration of Fe and Zn micronutrients, accessions ILL-7164 and RL-49 are recommended for commercial cultivation and can also be effectively utilized in the recombination breeding programs to enhance genetic variability and combined enhancement of nutrients in lentil. In addition, genotypes with high micronutrient levels might be suitable for studying the mechanisms of mineral element accumulation and transport. The mineral characteristics of crop plants depend on genetic and environmental factors. Variation in different germplasm for mineral characteristics also depends on the level of soil fertility, soil type, seed characteristics, seed composition, climatic factors, and others. The variance component estimates showed that genotype ´year interaction was not significant, thus indicating the genotypic stability over years for both the minerals. Significant genotype ´location interaction for Fe implied that there is location-specific adaptation of the genotypes. In a single-year multi location study, Kumar et al., also reported significant genotype, location interaction for both the micronutrients [40]. Although the accumulation of both the micronutrients was influenced by environment, the accumulation of seed Fe is more sensitive to environmental fluctuations in comparison to that of seed Zn. Similar findings were also reported in maize [41]. The Eberhart and Russell model revealed that the variation due to G x E (linear) was non-significant for seed Fe. However, the environment (linear) was significant for Zn (Table 3). In addition to this the factors like microclimatic effects and meteorological parameters play important role. Significant effects of genotype × location and genotype × year interaction for karnel Fe; and genotype × location × year interaction for kernal Zn were earlier reported in maize [41,42]. Despite various factors affecting seed micronutrient status including differential behavior of genotypes in locations, this study was successful in identifying promising lentil genotypes based on mean value of genotypes, regression values and deviations from regression. The importance of genotype x environment effects has also been assessed for nutrients and yield in other crops such as soybean, wheat, and sweet potato, where the general conclusion was that the implications of genotype x environment interaction should be kept specific to the trait in designing the breeding program [43-46]. The available zinc content was found inadequate in the stations. Low organic matter status as well as negligence use about the need of boron and zinc for crops in the station might be the cause of low boron and zinc status. The available iron content was very high in the farm. The occurrence of high amount of primary and secondary iron minerals like olivine, siderite, goethite, magnetite etc. might be the cause of high content available iron [47]. High iron availability may show iron toxicity symptoms in crops [48]. The present study revealed no correlation between seed Fe and Zn concentrations at all the three locations in the analyzed genotypes, hence indicated the possibility of genetically improving the two target traits independent of each other in contradiction to earlier reports in different crops [49-52].
Acknowledgements
Authors are highly acknowledged to Dr. Parminder Singh Virik (CIAT-Harvest Plus) for helping to seed micronutrient analysis report. Authors are also thankful to Zest lab, Bhaktapur and Soil Science Research Division, Khumaltar for soil and seed analysis. The first author has special gratitude to ICARDA and Harvest Plus Bio fortification Project for sandwich grants for the lab analysis cost and providing all the necessary facilities for the research work. Finally, not a least authors would like to thankful to the Executive Director Dr. Tek B. Gurung and entire NARC management for supporting the program and Faculty of Agriculture, Department of Genetics and Plant Breeding, AFU, Rampur for encouraging the research and constructive comments.
References
- FAOSTAT (2007) http://www.fao.org/3/b-i6407e.pdf
- Clancey B (2009) World pulse outlook: Report to the Saskatchewan Pulse growers. p 17.
- MOAD 2016/17 Statistical Information of Nepalese Agriculture,Ministry of Agriculture, Government of Nepal, Kathmandu
- Frederick KK, Kranz JK, Wand AJ (2006) Characterization of the backbone and side chain dynamics of the CaM-CaMKIp complex reveals microscopic contributions to protein conformational entropy. Biochemistry 45: 9841-9848.
- FAOSTAT (2007) http://faostat.fao.org/. Accessed 15 March2010
- Allen LH (1997) Pregnancy and iron deficiency: unresolvedissues. Nutr Rev 55: 91-101.
- Lozoff B, Georgieff MK (2006) Iron deficiency and braindevelopment. Semin Pediatr Neurol 13: 158-165.
- WHO (2010) World Health Statistics.
- Golden MH (1995) Specific deficiencies versus growth failure:type I and type II nutrients. SCN News 12:10-14.
- Brown KH, JA Rivera, Z Bhutta, RS Gibson, JC King, et al. (2004) International Zinc Nutrition Consultative Group (IZiNCG) technical document #1. Assessment of the risk of zinc deficiency in populations and options for its control. Food Nutr Bull 25: S99-203.
- Solomons NW (2003) Zinc deficiency. In: Caballero B (ed) Encyclopedia of food sciences and nutrition, 2nd ed. Elsevier, England.
- Haas J, Brownlie T (2001) Iron deficiency and reduced work capacity: a critical review of the research to determine a causal relationship. J Nutr 131: 676S-690S.
- Vallee BL, Falchuk KH (1993) The biochemical basis of zincphysiology. Physiol Rev 73: 79-118.
- Dimitropoulou P, Nayee S, Liu JF, Demetriou L, Van Tongeren M, et al. (2008) Dietary zinc intake and brain cancer in adults: a case-control study. Br J Nutr 99: 667-673.
- Dibyendu Talukdar (2016) Alterations in antioxidant activity and free radical scavenging capacity in seeds of lentil (Lens culinaris Medik.) genotypes under arsenate exposure. Chemical Science Review and Letters 5: 306-311.
- Thavarajah D, P Thavarajah, CT See, A Vandenberg (2010) Phytic acid and Fe and Zn concentration in lentil (Lens culinaris L.) seeds is influenced by temperature during seed filling period. Food Chem 122: 254-259.
- Thavarajah D, Thavarajah P, Sarker A, Vandenberg A (2009) Lentils (Lensculinaris Medikus subsp. culinaris): a whole food for increased iron and zinc intake. J Agri Food Chem 57: 5413-5419.
- Thavarajah D, Thavarajah P, Wejesuriya A, Rutzke M, Glahn RP, et al. (2011) The potential of lentil (Lens culinaris L.) as a whole food for increased selenium, iron, and zinc intake: preliminary results from a 3 year study. Euphytica 180: 123-128.
- United Nations (2010) Millennium development goals report 2010. UN Web Service Section. V.
- Gabrielle Kissinger, Lexeme Consulting (2016) Pulse crops andsustainability: A framework to evaluate multiple benefits 01-64.
- Harvest Plus (2010) Breeding crops for better nutrition. http:// www.harvestplus.org/. Accessed 20 June 2010.
- GRU (2005) Annual report. Genet. Resour. Unit, ICARDA, Aleppo, Syria.
- Sarker A, AH Rizvi, M Singh (2018) Genetic variability for nutritional quality in lentil (Lens culinaris Medikus subsp. culinaris). Legume Res 41: 363-368.
- Ramagosa I, Fox PN (1993) Genotype x Environment interaction and Adaptation, In: Plant Breeding: Principals and Prospects (eds). Chapman and Hall p 373-390.
- Tesemma T, Tsegaye S, Belay G, Bechere E, Mitiku D (1998) Stability of performance of tetraploid wheat landraces in Ethiopian highland. Euphtytica 102: 301-308.
- Crossa J (1990) Statistical analysis of multilocation trials. Adv Agro 44: 55-85.
- Singh D, Chonkar PK, Dwivedi BS (2005) Manual on soil, plant and water analysis. Westville Publishers p 199.
- Aweto AO (1982) Variability of upper slope soils development under sandstones in south-western Nigeria Geographic journal 25: 27-37.
- Lindsay WL, WA Norvell (1978) Development of a DTPA soil test for zinc, iron, manganese and copper. Soil Sci. Soc. Am. J 42: 421-428.
- Zarcinas BA, Cartwright B, Spouncer LR (1987) Nitric acid digestion and multi element analysis of plant material by inductively coupled plasma spectrometry. Comm Soil Sci Pl Analysis 18: 131-146.
- Gomez KA and AA Gomez (1984) Statistical procedures for agricultural research (2 ed). John wiley and sons, New York, 680p.
- Zobel RW, Wright MJ, Gauch HG (1988) Statistical analysis of a yield trial. Agro J 80: 388-393.
- Brady, N.C. and Weil, R.R. (2002) The Nature and Properties of Soil. 13th Edition, Prentice Hall, Upper Saddle River, New Jersey.
- Pfeiffer WH, Mc Clafferty B (2007) Harvest Plus: breeding crops for better nutrition. Crop Sci 47: 88-105.
- Ebdon JS, Gauch HG (2002) Additive main effect and multiplicative interaction analysis of national turf grass performance trials II: Cultivar recommendations. Crop Sci 42: 497-506.
- Yan W (2002) Singular-value p artitioning in biplotanalysis of multi-environment trial data. Agro J 94: 990-996.
- Ray H, K Bett, B Taran, A Vandenberg, D Thavarajah, et al. (2013) Mineral micronutrient content of cultivars of field pea, chickpea, common bean, and lentil grown in Saskatchewan, Canada. Crop Sci 54: 1698-1708.
- Thavarajah D, Thavarajah P, Sarker A, Materne M, Vandemark G, et al. (2011) A global survey of effects of genotype and environment on selenium concentration in lentils (Lens culinaris L.): implications for nutritional fortification strategies. Food Chem Press 125: 72-76.
- De Araújo RE, R Miglioranza, D Montalvan, GC Goncalves Vidigal, V Moda-Cirino (2003) Genotype x environment interaction effects of the iron content of common bean grains. Crop Breed. Appl Biotechnol 3: 269-274.
- Kumar H, HK Dikshit, AM Singh, D Singh, J Kumari, et al. (2013) Characterization of elite lentil genotypes for seed iron and zinc concentration and genotype environment interaction studies. Ind J Genet Plant Breed 73: 169-176.
- Oikeh SO, Menkir A, Maziya-Dixon B, Welch RM, Glahn RP, et al. (2004) Environmental stability of iron and zinc concentrations in grain of elite early-maturing tropical maize genotypes grown under field conditions. J Agri Sci 142: 543-551.
- Chakraborti Mridul, Prasanna BM, Hossain Firoz, Mazumdar Sonali, Anju M Singh, et al. (2011) Identification of kernel iron-and zinc-rich maize inbredsand analysis of geneticdiversity using microsatellite markers. J Pl Bioc Biot 20: 224-233.
- Asfaw A, F Alemayehu, F Gurum, A Mulugeta (2009) AMMI and SREG GGE biplot analysis for matching varieties onto soybean production environments in Ethiopia. Sci Res Essays 4: 1322-1330.
- Sakin MA, C Akinci, O Duzdemir, E Donmez (2011) Assessment of genotype environment interaction on yield and yield components of durum wheat genotypes by multivariate analyses. Afr J Biotechnol 10: 2875-2885.
- Tumwegamire S (2011) Genetic variation diversity and genotype by environment interactions of nutritional quality traits in East African sweet potato p 104.
- Dabholkar AR (1992) Elements of biometrical genetics. Concept Publishing Co., New Delhi. https://books.google. co.in/books/about/Elements_of_Biometrical_Genetics. html?id=HRLQPAAACAAJ&redir_esc=y
- Havlin HL, Beaton JD, Tisdale SL, Nelson WL (2010) Soil fertility and fertilizers - An introduction to nutrient management. 7th edition. PHI Learning Private Limited, New Delhi, India p516.
- Das DK (2000) Micronutrients: their behavior in soils and plants. Kalyani Publishers, New Delhi. India p307
- Arnold DL, Charbonneau SNI, Moodie CA, Munro 1C (1977) Long term toxicity study with ortho toluene sulphonic mile and saccharin. Toxicol Appl Pharmacol 41: 164.
- Dixon MJ, Smilek D, Cudahy C, Merikle Nature PM (2000) Five plus two equals yellow Nature 406: 365.
- Menkir A, White WS, Maziya-Dixon B, Rocheford T, Weiping L (2008) Carotenoid diversity in tropical adapted yellow maize inbred lines. Food Chem 109: 521-529.
- Oikeh SO, Nwilene F, Diatta S, Osiname S, Touré O, et al. (2008) Responses of upland NERICA rice to nitrogen and phosphorus in forest agroeco system. Agron J 100: 735-741.