


Research Article - (2023) Volume 8, Issue 1
Frying Stability of Virgin and Refined Sesame Oils as Compared to Refined Olive Oil
Received Date: May 17, 2023 / Accepted Date: Jun 28, 2023 / Published Date: Jul 10, 2023
Copyright: ©Â©2023 Reza Farhoosh, et al. This is an open-access article distributed under the terms of the Creative Commons Attribution License, which permits unrestricted use, distribution, and reproduction in any medium, provided the original author and source are credited.
Citation: Salehi, H., Farhoosh, R. (2023). Frying Stability of Virgin and Refined Sesame Oils as Compared to Refined Olive Oil. Adv Nutr Food Sci, 8(1), 32-39.
Abstract
Frying stability of two virgin (VSO) and refined (RSO) sesame oils was compared with that of a refined olive oil (ROO). The oils used to fry potato stripes at 180 °C and conjugated dienes (CDV), total carbonyls (CV), and thermo-oxidative and hydrolytic polar components monitored over time. The rate of change in CDV (mmol l–1 h–1) was significantly lower for ROO (0.72) than for VSO (1.00) and RSO (1.84). The change in CV for ROO (2.31 μmol g–1 h–1) was significantly much faster than those for RSO (1.89) and VSO (1.17). Based on the thermo-oxidative polar components, the calculated frying times for VSO, RSO, and ROO were in the order of 32.1, 13.9, and 15.4 h. However, VSO contained significantly the highest contents of hydrolytic polar components over time and RSO exhibited more resistance than ROO on this basis.
Keywords
Antioxidant, Composition, Frying Stability, Refined Olive Oil, Virgin Sesame Oil
Introduction
Frying is one of the most conventional methods of food preparation with annual commercial values of over billions of dollars in the world. During the process, frying oil exposed to elevated temperatures, atmospheric oxygen, and the moisture released from the food, which being fried. Such a condition results in several deteriorative chemical reactions, including oxidation in the presence of oxygen, hydrolytic alterations due to food moisture, and thermal polymerization at high temperatures [1]. These could lead to the formation of a wide range of undesirable compounds influencing the sensory properties, toxicity, and nutritional quality of fried foods.
Initial quality and chemical composition of frying oils remarkably affect the reactions occurring during oil deterioration [2]. High-quality frying oils have been reported to initially have free fatty acids less than 0.1% (or an acid value, AV, of ~0.2 mg g–1), peroxide values (PV) ranging from 0.5 to 1.0 meq kg–1, and smoke points above 200°C [3]. Fatty acids as the major components of frying media should be on a specified composition. Polyunsaturated fatty acids (PUFA) are rapidly peroxidized and largely lower the shelf life of fried products. To avoid polymerization, several countries have set limits as low as 2% for linoleic acid. Monounsaturated fatty acids (MUFA, primarily oleic acid), which are considered to be beneficial from a health standpoint, show high oxidative stability and provide a light taste. Saturated fatty acids (SFA, mainly palmitic and stearic) are stable towards peroxidation and polymerization. However, high SFA levels should avoided because they adversely affect the sensory attributes (e.g., waxy mouth-feel and dry surface) of fried foods [4]. Apart from the fatty acid composition, tocopherols and phenolic compounds, which are indigenous minor components found extensively in vegetable oils, have been shown to exert an important contribution to the protection of frying oils against thermo-oxidative degradations [4].
Olive oil is considered one of the best candidates for frying purposes [5]. This is due to possessing a prominent and well-balanced chemical composition, being associated with its fatty acid composition constituted primarily of oleic acid (55-83%) as well as significant amounts of some tocopherols and phenolic compounds with powerful antioxidant activity and health-promoting effects [6]. From a commercial point of view, olive oils categorized as extra virgin, virgin, refined, and just olive oil [7]. Extra virgin and virgin olive oils made directly from olive fruits with no chemical treatments. Those virgins with high levels of lipid hydroperoxides, acidity, and off-flavors, which called as lampante, are needed to be refined. Refined olive oils, which are relatively less expensive but lack of any flavor, could be flavored by adding certain quantity of the virgins, being commercially categorized as olive oil. Literature review shows a limited number of comparative studies on the thermo-oxidative stability of different commercial categories of olive oil. Considering the number of polymeric triglycerides generated over heating of a number of virgin and refined vegetable oils at 170°C, virgin oils were shown to be of better oxidative stability than the corresponding refined oils [8]. In a study on the emission of low molecular weight aldehydes from the oils heated at 180°C and 240°C, there was found very similar results for the extra virgin and refined olive oils [9]. There was observed no significant difference between the different commercial categories of olive oil fried at 170°C by monitoring a range of oxidation products [10].
Sesame oil is another super stable oil, which is highly resistant to peroxidation despite its relatively high unsaturation degree. The exceptional stability of sesame oils attributed to the presence of sesame seed lignans (e.g., sesamin, sesamolin, and sesamol), tocopherols, and some Millard reaction products [11,12]. Sesame oil can be produced from unroasted or roasted sesame seeds, which the latter have been reported to contain higher contents of sesamol. In fact, sesamol is formed by thermal hydrolysis of sesamolin, and the rate of this conversion increases at elevated temperatures and longer durations of roasting process [13]. Cold-pressed or virgin and refined sesame oils are two common commercial types of sesame oil, which both are consumed as salad dressing due to their high degree of unsaturation [14]. Regardless of some reports dealing with sesame oils blended with other oil sources in order to improve thermo-oxidative and/or frying stability of the final product, literature review shows no individual study on the frying stability of virgin or refined sesame oils. Hence, the aim of this study was to evaluate the frying stability of virgin and refined sesame oils as compared to a commercial refined olive oil.
Materials and Methods
Materials
Virgin (VSO) and refined (RSO) sesame oils from unroasted sesame seeds with no added antioxidants supplied by Datis (Yazd, Iran) and kept at –18°C until analysis. Refined olive oil (ROO) purchased from a local shop. The standards of fatty acid methyl esters (FAME) and all chemicals and solvents used in experiments were of analytical reagent grade and purchased from Merck (Darmstadt, Germany) and Sigma-Aldrich (St. Louis, MO).
Fatty Acid Composition
To prepare FAME, 0.3 g of the oil samples was dissolved in 7 ml of hexane, followed by vigorous shacking of the solution with 2 ml of 7 N methanolic potassium hydroxide (KOH) at 50°C for 10 min. FAME were identified using an HP-5890 gas chromatograph (Hewlett-Packard, CA, USA) equipped with a CP-FIL 88 (Supelco, Inc., Bellefonte, PA) capillary column of fused silica (60 m × 0.22 mm I.D., 0.2 µm film) and a flame ionization detector (FID). Nitrogen used as carrier gas with a flow rate of 0.75 ml min–1. The oven temperature maintained at 198°C, and those of injector and detector at 250°C.
Peroxide Value (PV)
Depending on the extent of peroxidation, 0.01-0.30 g of the oils were mixed in a disposable glass tube with 9.8 ml of chloroform–methanol (7:3 v/v) and vortexed for 2-4 s. Ammonium thiocyanate solution (50 ml, 30% w/v) was added and the sample was vortexed for 2-4 s. Fifty ml of iron (II) chloride solution ([0.4-g barium chloride dehydrate dissolved in 50-ml H2O] + [0.5- g FeSO4. 7H2O dissolved in 50-ml H2O] + [2-ml 10 M HCl, with the precipitate, barium sulfate, filtered off to produce a clear solution]) were added, and the sample was vortexed for 2-4 s. After a 5-min incubation at room temperature, the absorbance read at 500 nm against a blank containing all the reagents except the sample. Results expressed in meq of oxygen per kg of oil [15].
Acid Value (AV)
The oil samples (10 g) dissolved in 50 ml of previously neutralized chloroform-ethanol (50:50 v/v) were titrated with a solution of 0.1 N KOH in ethanol as the standard reagent to a phenolphthalein endpoint. AV was the mg of KOH consumed to neutralize the free fatty acids present in 1g of oil [16].
Total Tocopherols (TT)
Content A calibration curve of α-tocopherol in toluene (0 - 240 µg/ml) was prepared. Five ml of toluene added to 100 ± 10 mg of the oil sample in a 10-ml volumetric flask. Three and one- half ml of 2,2'-bipyridine (0.07% w/v in 95% aqueous ethanol) and 0.5 ml of FeCl3.6H2O (0.2% w/v in 95% aqueous ethanol) were successively added. The solution made up to 10 ml with 95% aqueous ethanol. After standing for 1 min, the absorption at 520nm read using a blank solution as a reference, prepared as above but omitting the oil. All the operations during color development carried out under subdued light. Results expressed in mg of α-tocopherol per/kg of oil [17].
Total Phenolic (TP) Content
A calibration curve of Gallic acid (0.04-0.40 mg/ml) in methanol was prepared. One ml of a standard solution of Gallic acid, 6 ml of methanol, 2.5 ml of the Folin-Ciocalteau reagent, and 5 ml of 7.5% Na2CO3 were added to a 50-ml volumetric flask and reached the final volume with distilled water. The solutions maintained overnight and the absorbance read at 765 nm. To measure TP, 2.5 g of oil was diluted with 2.5 ml of n-hexane and extracted three times by 5- min centrifugations (5000 rpm) with CH3OH: H2O (80:20 v/v). The extract added to 2.5 ml of Folin-Ciocalteau reagent and 5 ml of 7.5% Na2CO3 in a 50-ml volumetric flask reaching the final volume with distilled water. Results expressed in mg of Gallic acid per kg of oil [18].
Smoke Point
Smoke point of the oils measured every 8 hours according to AOCS Official Method Cc 9a-48 [16]. About 15g of the oils placed in an aluminum plate and heated in a constantly increasing rate of temperature. A thermometer measured the temperature at which bluish smoke started to appear.
Oxidative Stability Index (OSI)
A Met Rohm Rancimat model 743 (Herisau, Switzerland) set for 3-g oil samples at 120 °C and at an airflow rate of 15 l h–1 used to measure OSI.
Frying Process
Potato stripes (7.0 × 0.5 × 0.3 cm) were prepared and immersed in water until use. Twenty- gram batches of potato stripes fried in 2 l of oil. Frying temperature fixed at 180°C using a bench-top deep fryer (Tefal model 1250, France) and a digital thermometer. Each batch fried for 5 min, followed by standing the oil for 15 min. This repeated for 8hrs per day during four consecutive days. At the end of each 4hrs, about 20 g of the frying oil was filtered into a screw- cap vial and promptly stored in the dark at –18°C until use. The oil was not replenished during the frying process. The process conducted in duplicate [19].
Conjugated Diene Value (CDV)
CDV measured Spectrophotometrically at 234 nm and read against HPLC grade hexane as blank. The oil samples diluted to 1:600 with hexane. An extinction coefficient of 29000-mol l–1 utilized to quantify the concentration of conjugated diene hydro peroxides formed during oxidation [20].
Carbonyl Value (CV)
The oil samples (0.04-1.0 g) diluted to 10 ml by distilled 2-propanol. One ml of the solution was introduced into a 15-ml test tube containing 1 ml of 2,4-dinitrophenylhydrazine (DNPH) solution (50 mg of DNPH in 100 ml of 2-propanol containing 3.5 ml of 37% HCl) as an indicator and 8 ml of %2 KOH. After centrifugation (2000×g, 5 min), absorbance of the upper layer was read at 420 nm. 2,4-Decadienal was used as standard [21].
Polar Compounds Analysis
Total polar compounds (TPC % w/w) content of the oils was determined according to an economical micro-method [22]. Five main alteration components of the polar fractions, including free fatty acids (FFA), diglycerides (DG), oxidized triglyceride monomers (oxTGM), triglyceride dimers (TGD), and triglyceride polymers (TGP), separated by high-performance size- exclusion chromatography (HPSEC) [1]. Isolated polar fractions analyzed in a GPC-SEC chromatograph (Knauer, Berlin, Germany) with a 20-μl sample loop. A 2300 refractive index detector and two Nucleogel GPC columns (Macherey-Nagel, Duren, Germany) with 100- and 500- Å pore size connected in series operated at 40°C. The columns were 300 × 7.7 mm I.D., packed with a macro-porous, highly cross-linked and spherical polystyrene/divinylbenzene copolymer (5μm particle size). HPLC-grade tetrahydrofuran (THF) used as mobile phase with a flow of 1 ml min–1. Sample concentration was 10 mg ml–1 in THF.
Statistical Analysis
All experiments and measurements carried out in triplicate, and data subjected to analysis of variance (ANOVA). ANOVA and regression analysis performed according to the Minitab and Excel software. Significant differences between means determined by Duncan’s multiple range tests. P values less than 0.05 considered statistically significant.
Results and Discussion
Characterization of the Oils
Fatty acid composition of VSO, RSO, and ROO was in agreement with those usually reported for sesame and olive oils (Table). The oils were of statistically the same amount of SFA (mainly palmitic, C16:0, and stearic, C18:0, acids). ROO was constituted of almost twice amount of MUFA (mainly oleic acid, C18:1) than the sesame oils. Instead, the sesame oils of roughly the same content of PUFA (mainly linoleic acid, C18:2) were considerably more polyunsaturated than ROO. With respect to the relative rate of oxidation reported for linoleic, oleic, and stearic acids as 1200:100:1, ROO was definitely to have the most oxidative stable fatty acid composition [23].
|
Parameter |
VSO |
RSO |
ROO |
|
Fatty acids |
|||
|
14:0 |
0.1 ± 0.1 a |
– |
0.1 ± 0.0 a |
|
16:0 |
10.7 ± 0.1 b |
11.2 ± 0.3 b |
12.0 ± 0.2 a |
|
16:1 |
0.2 ± 0.0 b |
0.1 ± 0.0 b |
1.1 ± 0.1 a |
|
18:0 |
5.6 ± 0.1 a |
5.1 ± 0.3 b |
4.2 ± 0.2 b |
|
18:1 |
40.6 ± 0.1 b |
39.3 ± 0.1 c |
74.2 ± 0.6 a |
|
18:2 |
41.7 ± 0.1 a |
42.8 ± 0.6 a |
6.5 ± 0.1 b |
|
18:3 |
0.3 ± 0.0 b |
0.4 ± 0.0 b |
0.7 ± 0.0 a |
|
20:0 |
0.5 ± 0.0 a |
0.5 ± 0.0 a |
0.4 ± 0.0 b |
|
20:1 |
0.2 ± 0.0 a |
0.2 ± 0.0 a |
0.2 ± 0.0 a |
|
22:0 |
0.1 ± 0.0 a |
0.1 ± 0.0 a |
0.1 ± 0.0 a |
|
SFA |
17.0 ± 0.2 a |
17.0 ± 0.7 a |
16.9 ± 0.3 a |
|
MUFA |
40.9 ± 0.1 b |
39.7 ± 0.1 c |
79.9 ± 0.5 a |
|
PUFA |
42.1 ± 0.1 b |
43.3 ± 0.6 a |
7.2 ± 0.2 c |
|
PV |
0.75 ± 0.04 b |
0.53 ± 0.09 b |
10.15 ± 0.35 a |
|
AV |
1.01 ± 0.06 a |
0.69 ± 0.02 b |
0.72 ± 0.02 b |
|
TT content |
335 ± 9 a |
314 ± 2 b |
270 ± 2 c |
|
TP content |
216 ± 10 a |
152 ± 10 b |
58 ± 3 c |
|
OSI |
11.2 ± 0.0 b |
11.0 ± 0.1 b |
22.7 ± 0.1 a |
|
Means ± SD (standard deviation) within a row with the same lowercase letters are not significantly different at p < 0.05. SFA: saturated fatty acids (%); MUFA: monounsaturated fatty acids (%); PUFA: polyunsaturated fatty acids (%); PV: peroxide value (meq O2 per kg oil); AV: acid value (mg KOH per g oil); TT: total tocopherols (mg α-tocopherol per kg oil); TP: total phenolic compounds (mg gallic acid per kg oil); OSI: oxidative stability index (h). |
|||
Table: Fatty Acid Composition (%) and Initial Quality Parameters of the Virgin Sesame (VSO), Refined Sesame (RSO), and Refined Olive (ROO) Oils
The sesame oils had acceptable PVs (Table) in the range recommended (0.5 – 1.0 meq kg-1) for high-quality frying oils but the quite higher value for ROO was in the permitted range (~10 meq kg–1 for ROOs) promulgated by the International Olive Oil Council (IOOC) [3]. Olive oils have been postulated to be comprised of certain components that interfere with the conventional PV measurement, so that even freshly expressed olive oils have PVs of ~10 meq kg–1, or higher values under dry climatic conditions [7]. The AV of VSO was significantly higher than those of RSO and ROO, which were statistically the same. The value for high-quality frying oils and refined olive oils should not exceed ~0.2 mg g–1 and ~0.6 mg g–1, respectively [3,7].
The highest contents of total tocopherols and phenolic compounds found in VSO, followed by in RSO and ROO (Table). Conventional refining processes normally cause significant decreases in the contents of TT and TP [24,25]. α- and γ-Tocopherols are recognized as predominant homologues (~95%) in olive and sesame oils, respectively [7]. The antioxidant activity of tocopherols decreases in the order of δ > γ > β > α in fats and oils, while in vivo, that is vitamin E activity, decreases in the order of α > β > γ > δ . Hydroxycinnamic acids and hydroxytyrosol are known as the main phenolic compounds of the minor fraction of olive oil chemical composition [26,27]. Sesamin is the major lignin in sesame oil, which in turn transformed into sesamol, episesamin, and sesaminol during refining processes and/or at high temperatures [14,28].
As can be seen in Table, ROO exhibited an OSI of about two folds those of the sesame oils. This is likely due to the more contribution of the fatty acid compositions than the antioxidative minor components to resist against thermal oxidation under the harsh conditions normally occurring in Rancimat. OSI may essentially not provide a correct estimation of frying stability of an oil, resulting from some inherent differences in the reaction environments established during frying processes and Rancimat test [29].
Frying Stability
Changes in CDV, CV, and TPC
All the oils studied showed linear trends of change (R2 > 0.97) in CDV, CV, and TPC with frying time (32 h at 180°C) (Figure 1). CDV represents the oxidizability of lipid systems containing methylene-interrupted dienes, which become conjugated during peroxidation [30]. Regardless of the slight differences in the initial values, the rate of change in CDV was significantly lower for ROO (0.72 mmol l–1 h–1) than for VSO (1.00 mmol l–1 h–1) and RSO (1.84 mmol l–1 h–1) (Figure 1A). This can be due to the very much lower level of PUFA in ROO than in the sesame oils (Table), which makes it less prone to produce conjugated diene hydrperoxides. The better resistance of VSO than RSO to the formation of these oxidation products naturally arises from the greater antioxidant potency of the former (Table). Traditional deodorization of sesame oils has been reported to remove sesamol almost completely and more than 85% of sesamolin and related isomers of sesaminol, leading to markedly reduced oxidative stability of the final product [31].
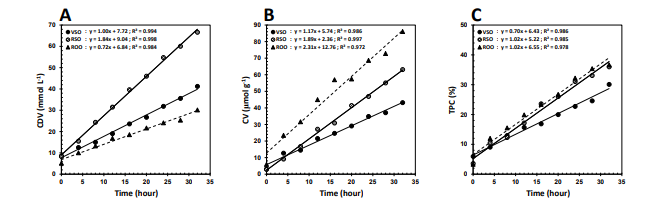
Figure 1: Changes in the values of (A) Conjugated Diene, CDV, (B) Carbonyl, CV, and (C) total Polar Compounds, TPC, of the Virgin sesame (VSO), Refined Sesame (RSO), and Refined Olive (ROO) Oils during the Frying Process at 180°C
Despite CDV, which stands for conjugated diene hydroperoxides as primary oxidation products, CV represents a wide variety of secondary oxidation products known as aldehydes and ketones. Its level in frying oils is of extreme importance because carbonyls often cause rancidity and off-flavor, and reduce nutritional value of fried foods [21]. While there was no significant differences among the initial values, ROO revealed the highest susceptibility to secondary oxidation, so that the change in CV for it (2.31 μmol g–1 h–1) was significantly much faster than those for RSO (1.89 μmol g–1 h–1) and VSO (1.17 μmol g–1 h–1), respectively (Figure 1B). This indicates well the greater quantitative and/or qualitative contribution of the predominant antioxidant fractions in the sesame oils (γ-tocopherol and lignans) than in ROO (α-tocopherol, hydroxycinnamic acids and hydroxytyrosol) to prevent carbonyls formed. TPC is one of the most well known and reliable indicators for the extent of chemical deterioration in frying oils. It represents a range of polar components (see below) which are considered to be toxic to human health [32]. With respect to the rates of change in TPC (Figure 1C), VSO was still of better quality than RSO (0.70 vs. 1.02 % h–1) but there was no much difference between the refined oils in inhibiting the production of polar compounds.
Changes in the Polar Components
Figure 2 shows the changes in the contents of thermo-oxidative (oxTGM, TGD, and TGP) and hydrolytic (DG and FFA) polar components during the frying process. These two sets of components differ not only in polarity or molecular weight but also in nutritional impact, and therefore, it is of crucial importance to specify their distribution for any frying medium over the process [1].
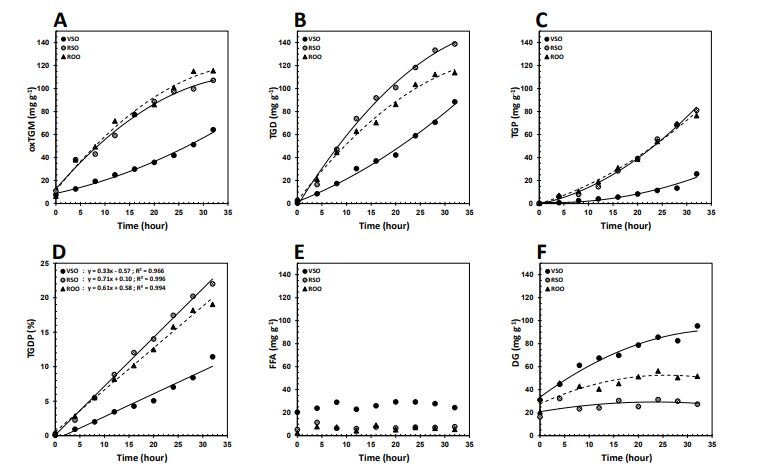
Figure 2: Changes in the Contents of (A) Oxidized Triglyceride Monomers, oxTGM, (B) Triglyceride Dimers, TGD, (C) Triglyceride Polymers, TGP, (D) TGD+TGP, TGDP, (E) Free Fatty Acids, FFA, and (F) Diglycerides, DG, of the Virgin Sesame (VSO), Refined Sesame (RSO), and Refined Olive (ROO) Oils during the Frying Process at 180° C.
VSO showed extraordinarily the highest potency in inhibiting the creation of thermo-oxidative polar components during the frying process (Figure 2A, 2B, 2C). Apart from the antioxidant capacity of the tocopherol and phenolic fractions, sesame oils have been shown to include significant amounts of ![]() 5- and
5- and ![]() 7-avenasterols capable of an anti-polymerization effect during prolonged heating at high temperatures [33,34]. Considering oxTGM as a measure of total oxidation, encompassing both oxygenated primary and secondary oxidation products, ROO was of slightly weaker strength than RSO to inhibit oxidation in total (Figure 2A) [35]. The refined oils behaved almost similarly with respect to the contents of TGP (Figure 2C) but ROO was significantly the better frying oil from TGD point of view (Figure 2B). TGD and TGP, which are oxTGMs linked together preferentially through oxygenated linkages, are very complex and structurally not fully recognized. Nowadays, their summation (TGDP) and a cutoff point of 10% based on it have absorbed much attention on a health ground [36]. All the oils presented linear trends of change (R2 > 0.96) in TGDP with frying time (Figure 2D). Based on 10% TGDP, the maximum frying time for VSO calculated to be 32.1 h, which was considerably higher than the statistically different values for RSO (13.9 h) and ROO (15.4 h).
7-avenasterols capable of an anti-polymerization effect during prolonged heating at high temperatures [33,34]. Considering oxTGM as a measure of total oxidation, encompassing both oxygenated primary and secondary oxidation products, ROO was of slightly weaker strength than RSO to inhibit oxidation in total (Figure 2A) [35]. The refined oils behaved almost similarly with respect to the contents of TGP (Figure 2C) but ROO was significantly the better frying oil from TGD point of view (Figure 2B). TGD and TGP, which are oxTGMs linked together preferentially through oxygenated linkages, are very complex and structurally not fully recognized. Nowadays, their summation (TGDP) and a cutoff point of 10% based on it have absorbed much attention on a health ground [36]. All the oils presented linear trends of change (R2 > 0.96) in TGDP with frying time (Figure 2D). Based on 10% TGDP, the maximum frying time for VSO calculated to be 32.1 h, which was considerably higher than the statistically different values for RSO (13.9 h) and ROO (15.4 h).
Hydrolytic polar components are also of crucial importance because they are likely to exert pro-oxidant effects and lower increasingly the oxidative stability of frying oils. Monitoring the contents of FFA and DG appeared quite different frying performances for the oils studied (Figure 2E, 2F). VSO contained significantly the highest contents of FFA and DG during the frying process and RSO exhibited more resistance than ROO to hydrolytic alterations. As can be seen in Figure 2E, besides the much smaller quantities compared to DG, FFA showed no given change pattern over time, making it less reliable than DG to determine hydrolysis rate during frying. Higher volatility of FFA than DG causes them to be lost more easily at elevated temperatures [1]. The more is the content of FFA as well as the tendency to their formation, the lower smoke point for an oil will be. The oils with lower smoke points (especially < 200°C) are less useful for frying operations because they are more prone to the emission of potentially toxic volatile organic compounds [37]. The fresh VSO had a smoke point of 182° C, which was drastically lower than those of the fresh RSO (231°C) and ROO (208°C). As shown in Figure 3, the smoke points of VSO, RSO, and ROO significantly decreased and reached a plateau (~161°C, ~206°C, and ~190°C, respectively) after 8h of the frying process.
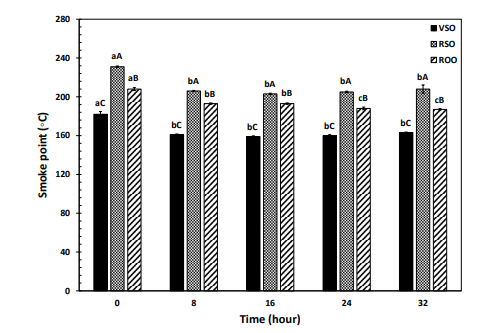
Figure 3: Changes in the smoke points of the virgin sesame (VSO), refined sesame (RSO), and refined olive (ROO) oils during the frying process at 180°C. Means ± SD (standard deviation) for each oil over time with the same lowercase letters are not significantly different at P < 0.05. Means ± SD in each time point with the same uppercase letters are not significantly different at P < 0.05
Conclusions
The present study indicated that relatively less expensive sesame oils with naturally more unsaturated fatty acid compositions could be of equal or even better frying stability relative to olive oils. This demonstrates the remarkable contribution of sesame oils’ minor fraction to stabilize the final product. From the thermo-oxidative alterations standpoint, the virgin sesame oil was shown to be dramatically more stable than the refined olive oil but, hydrolytically, it was not of necessary frying quality due to containing considerable amount of the volatiles decreasing smoke point. A light deodorization process in a way that the minor anti¬oxidative fraction is not be affected significantly might simply eliminate such a deficiency. This, of course, will require a separate study to optimize the operational parameters governing the process.
References
- Dobarganes, M. C., PérezaCamino, M. D. C., & MárquezaRuíz,G. (1988). High performance size exclusion chromatography of polar compounds in heated and non-heated fats. Lipid/Fett, 90(8), 308-311.
- Farhoosh, R., & Pazhouhanmehr, S. (2009). Relative contribution of compositional parameters to the primary and secondary oxidation of canola oil. Food Chemistry, 114(3), 1002-1006.
- Stevenson, S. G., Vaisey-Genser, M., & Eskin, N. A. M. (1984). Quality control in the use of deep frying oils. Journal of the American Oil Chemists Society, 61, 1102-1108.
- Kolakowska, A. (Ed.). (2003). Chemical and Functional Properties of Food Lipids. CRC Press.
- Molina-Garcia, L., Santos, C. S. P., Cunha, S. C., Casal, S., & Fernandes, J. O. (2017). Comparative fingerprint changes of toxic volatiles in low PUFA vegetable oils under deep-frying. Journal of the American Oil Chemists' Society, 94(2), 271-284.
- Bendini, A., Cerretani, L., Carrasco-Pancorbo, A., Gómez-Caravaca, A. M., Segura-Carretero, A., Fernández-Gutiérrez, A., & Lercker, G. (2007). Phenolic molecules in virgin olive oils: a survey of their sensory properties, health effects, antioxidant activity and analytical methods. An overview of the last decade. Molecules, 12(8), 1679-1719.
- Wanasundara, P. K. J. P. D., & Shahidi, F. J. B. S. I. O. (2005). Antioxidants: science, technology, and applications. Bailey's industrial oil and fat products.
- Gertz, C., Klostermann, S., & Kochhar, S. P. (2000). Testing and comparing oxidative stability of vegetable oils and fats at frying temperature. European Journal of Lipid Science and Technology, 102(8-9), 543-551.
- Fullana, A., Carbonell-Barrachina, A. A., & Sidhu, S. (2004). Comparison of volatile aldehydes present in the cooking fumes of extra virgin olive, olive, and canola oils. Journal of Agricultural and Food Chemistry, 52(16), 5207-5214.
- Casal, S., Malheiro, R., Sendas, A., Oliveira, B. P., & Pereira,J. A. (2010). Olive oil stability under deep-frying conditions. Food and chemical toxicology, 48(10), 2972-2979.
- Abou-Gharbia, H. A., Shehata, A. A. Y., & Shahidi, F. (2000). Effect of processing on oxidative stability and lipid classes of sesame oil. Food research international, 33(5), 331-340.
- Lee, J., Lee, Y., & Choe, E. (2008). Effects of sesamol, sesamin, and sesamolin extracted from roasted sesame oil on the thermal oxidation of methyl linoleate. LWT-Food Science and Technology, 41(10), 1871-1875.
- Lee, S. W., Jeung, M. K., Park, M. H., Lee, S. Y., & Lee, J.(2010). Effects of roasting conditions of sesame seeds on the oxidative stability of pressed oil during thermal oxidation. Food chemistry, 118(3), 681-685.
- Wan, Y., Li, H., Fu, G., Chen, X., Chen, F., & Xie, M. (2015).The relationship of antioxidant components and antioxidant activity of sesame seed oil. Journal of the Science of Food and Agriculture, 95(13), 2571-2578.
- Shantha, N. C., & Decker, E. A. (1994). Rapid, sensitive, iron-based spectrophotometric methods for determination of peroxide values of food lipids. Journal of AOAC International, 77(2), 421-424.
- AOCS, F. D. (1998). Official methods and recommended practices of the American Oil Chemists' Society. AOCS, 5, 2-93.
- Wong, M. L., Timms, R. E., & Goh, E. M. (1988). Colorimetric determination of total tocopherols in palm oil, olein and stearin. Journal of the American oil chemists society, 65(2), 258-261.
- Capannesi, C., Palchetti, I., Mascini, M., & Parenti, A. (2000). Electrochemical sensor and biosensor for polyphenols detection in olive oils. Food chemistry, 71(4), 553-562.
- Farhoosh, R., & Moosavi, S. M. R. (2009). Evaluating the performance of peroxide and conjugated diene values in monitoring quality of used frying oils. Journal of Agricultural Science and Technology, 11(2), 173-179.
- Saguy, I. S., Shani, A., Weinberg, P., & Garti, N. (1996). Utilization of jojoba oil for deep-fat frying of foods. LWT-Food Science and Technology, 29(5-6), 573-577.
- Endo, Y., Li, C. M., Tagiri-Endo, M., & Fujimoto, K. (2001). A modified method for the estimation of total carbonyl compounds in heated and frying oils using 2-propanol as a solvent. Journal of the American Oil Chemists' Society, 78(10), 1021-1024.
- Schulte, E. (2004). Economical micromethod for determination of polar components in frying fats. European Journal of Lipid Science and Technology, 106(11), 772-776.
- Hsieh, R. J., & Kinsella, J. E. (1989). Oxidation of polyunsaturated fatty acids: mechanisms, products, and inhibition with emphasis on fish. Advances in food and nutrition research, 33, 233-341.
- Tasan, M., & Demirci, M. (2005). Total and individual tocopherol contents of sunflower oil at different steps of refining. European Food Research and Technology, 220, 251-254.
- Zacchi, P., & Eggers, R. (2008). High-temperature pre-conditioning of rapeseed: A polyphenol-enriched oil and the effect of refining. European Journal of Lipid Science and Technology, 110(2), 111-119.
- Boskou, D. (1999). Non-nutrient antioxidants and stability of frying oils (pp. 183-204). Technomic Publishing CO., INC. Lancaster, Pennsylvania.
- Pellegrini, N., Visioli, F., Buratti, S., & Brighenti, F. (2001). Direct analysis of total antioxidant activity of olive oil and studies on the influence of heating. Journal of Agricultural and Food Chemistry, 49(5), 2532-2538.
- Wu, R., Ma, F., Zhang, L., Li, P., Li, G., Zhang, Q., ... &Wang, X. (2016). Simultaneous determination of phenolic compounds in sesame oil using LC–MS/MS combined with magnetic carboxylated multi-walled carbon nanotubes. Food chemistry, 204, 334-342.
- Habibi-Nodeh, F., Farhoosh, R., & Sharif, A. (2019). Fryingstability time of olive oils estimated from the oxidative stability index. Journal of Food Measurement and Characterization, 13, 1831-1838.
- Farmer, E. H. (1946). Peroxidation in relation to olefinic structure. Transactions of the Faraday Society, 42, 228-236.
- Kochhar, S. P. (2002). Sesame, rice-bran and flaxseed oils. Vegetable oils in food technology: composition, properties and uses, 297-326.
- Firestone, D. E., Perkins, E. G., & Erickson, M. D. (1996). Deep frying: chemistry, nutrition, and practical applications.
- Mohamed, H. M. A., & Awatif, I. I. (1998). The use of sesame oil unsaponifiable matter as a natural antioxidant. Food chemistry, 62(3), 269-276.
- Sims, R. J., Fioriti, J. A., & Kanuk, M. J. (1972). Sterol additives as polymerization inhibitors for frying oils. Journal of the American Oil Chemists' Society, 49(5): 298-301.
- Ruiz-Méndez, M. V., Márquez-Ruiz, G., & Dobarganes,M. C. (1997). Relationships between quality of crude and refined edible oils based on quantitation of minor glyceridic compounds. Food chemistry, 60(4), 549-554.
- Farhoosh, R., & Tavassoli-Kafrani, M. H. (2011). Simultaneous monitoring of the conventional qualitative indicators during frying of sunfloWer oil. Food Chemistry, 125(1), 209-213.
- Katragadda, H. R., Fullana, A., Sidhu, S., & Carbonell-Barrachina, Á. A. (2010). Emissions of volatile aldehydes from heated cooking oils. Food Chemistry, 120(1), 59-65.