


Research Article - (2022) Volume 7, Issue 3
Food Aversion, Pica And Cravings Practices And Its Associated Factors Among Preg-nant Women Attending Antenatal Care In Nifas Silk Sub-City Health Facilities, Addis Ababa, Ethiopia, 2021
2School of nutrition, food science, and technology, college of agriculture, HawassaUniversity, Ethiopia
Received Date: Jun 23, 2022 / Accepted Date: Jun 30, 2022 / Published Date: Jul 12, 2022
Copyright: ©Getachew Sale, et al. This is an open-access article distributed under the terms of the Creative Commons Attribution License, which permits unrestricted use, distribution, and reproduction in any medium, provided the original author and source are credited.
Citation: Getachew Sale, MekdelawitFikadu, GetuGizaw, DessalegnTamiru. (2022). Food aversion, Pica and Cravings Practices and Its Associated Factors among Pregnant Women Attending Antenatal Care in Nifas silk sub-city Health Facilities, Addis Ababa, Ethiopia, 2021. AdvNutr Food Sci. 7(3): 237-248.
Abstract
Background: Although food cravings, aversions, and pica behaviors are practiced globally, they are more common in African countries.No clear evidence indicated on malpractices during pregnancy. Therefore, this study aims to investigate pica, food aversion, and craving practices and their associated factors in the study area.
Objectives: To assess the prevalence of pica practice, food aversion, craving and its associated factors among pregnant women attending antenatal care in Nifas Silk sub-city health facilities, Addis Ababa Ethiopia, 2021
Methods: An institution-based cross-sectional study was conducted among 502 pregnant mothers from July 15 to August 15, 2021. Datawereenterd to EpiData version 3.1and analyzed bySPSS version 21.The binary logistic regression model was fitted to identify factors associated with pica, food aversion and craving.
Results: The prevalence of pica practices,food aversion and craving were 22%,40.8% and 85% respectively. Maternaleducation levelstatus [AOR, 2.95(1.14,7.62)], using family planning[AOR, 2.35 (1.34, 4.12)], Iron/folate supplementation [AOR, 2.45 (1.47,4.05)] and havingpregnancy related complication[AOR, 2.45 (1.47, 4.05)] were significantly associated with pica practice. Maternal age19-24 and 25-29 years[AOR, 0.17 (0.06,0.44)] and [AOR, 0.56 (0.34,0.89] respectively, ANC visit [AOR, 0.14(0.08, 0.34], Nutritional status[AOR, 2.25 (1.06, 4.78)], IFA supplementation [AOR, 0.20 (0.10, 0.38)], Pregnancy related complication were factors associated with food craving. Additionally, maternal income[AOR,0.44(0.24,0.81)],family planninguser[AOR,3.45(2.21,5.40)], IFA supplementation[AOR, 2.47(1.59, 3.85)] were factors associated with food aversion.
Conclusion: Pica, food aversion and food craving during were prevalent. Maternal educational level, family planning users, iron folate supplementation and pregnancy complications were significantly influenced pica practice. Maternal age, ANC and IFA supplementation were decreases the food craving practices while maternal undernutrition increases food craving. Additionally, family planning users,IFA supplementation and income were factors associated with food aversion. Therefore, those malpractices should be decreased by working on identified factors. Increases the maternal health services during pregnancy should strengthen to alleviate these malpractices.
Keywords
Pica, Aversion, Craving, Pregnant Women, Antenatal Care
Background
Pregnancy is an important stage that can influence the well-being of future generations. In this period there is a change in maternal nutrition which contributes to the general health of the mother and child [1-3].
Pica, the ingestion of non-food items, has aroused the curiosity of medical personnel since at least the 16th century [4]. Food crav¬ings are an intense desire to obtain foods that are very interesting to the individual. It is generally described as a distinct state charac¬terized by an intense urge to obtain a food substance. On the other hand, food aversions are strong dislike and ignorance of particular foods during pregnancy [5].
It is common to hear pregnant women complain about changes in their appetites. Whereas some women report a dislike of or total aversion to specific foods, others report a strong craving for specif¬ic foods and non-food items, which are usually not readily accessi¬ble. Food aversions and cravings during pregnancy are known all over the world, but despite their ubiquity, neither their causes nor their ultimate effects on maternal nutrition have been well estab¬lished scientifically [6,7].
Worldwide the pica prevalence in pregnant populations was esti-mated to be 27.8% [8].Although pica behavior is practiced glob-ally, it is more prevalent within African countries which range from8.3% to 63.7% [5, 8-13]. The prevalence of food aversion and craving alsoranges from 50.3% to 70.1% and 15.2 in Africa respectively.[8-14].In Ethiopia the prevalence of pica practice was 30.4%, food aversion ranges from 65% to 67.9% and food craving ranges 43.5% to 71% [5, 7]
Pica has puzzled researchersfor a long time. It cuts across differ-ent cultures and religions. There are differentforms of pica. The materials consumed also vary widely, from intakeof clay or dirt (geophagia), ice or freezer frost (pagophagia),stones (lithophane), ashes, charcoal, soap, pieces of paper, paintchips, chalk, and many other nonfood materials[15-17]. Pica may sometimesbe found with micronutrient deficiency but whetherit is a cause or a result of the deficiency is notwell understood [16].
These pregnancy problems resulted inmicronutrient deficiency: some studieshave reported associated of pica with increased ane-mia, lowplasma zinclevel, low hematocrit and low hemoglobin. This cannotcompletely explain whether or not pica is related to micronutrient deficiencies,but it does imply that pica is a risk for these deficiencies, all ofwhich affect the health and wellbeing of an individual.This has led to a reported increase in teratogenicity risks and birth side effects during pregnancy. The causes of these side effects have often been misdiagnosed. Unless a nationwide investigation on pica practice is conducted, these pregnancy risks might contribute to high infant morbidity and mortality[11, 16].
Foodcraving, a strong desire for a specific food, is common, espe¬cially in pregnantwomen. Food craving may be related to chang¬es in hormonal levels,as a response to elevated nutritional needs, cultural factors and the presenceof a specific desired ingredient in the craved food. Food aversionwhich is also common could be a protective function for the motherand fetus from food toxins [18].
This variability has been attributed to multiple factors including differences in diagnostic criteria and measurement underreporting of pica, food aversion and craving in regional differences, dietary and cultural practices, and differences in the populations sampled (e.g. ethnicity, socioeconomic status) [5, 7, 8, 17, 19-21]. Other proposed causes of pica are gastrointestinal difficulties, reaction to stress, hunger, and cultural belief.
Food is supposed to provide nutrients for the growth and the gen-eral wellbeing of the mother and child therefore understanding pica, food cravings, and aversions during pregnancy is important [10].
In the early weeks of pregnancy, significant developmental chang¬es occur that depend on a woman’s nutrient stores. The food preg¬nant mothers eat daily affects how their bodies work and how they maintain energy and strength. It also determines the basic nutri¬tional health that their children are born with, and provides a mod¬el for their eating habits during childhood and beyond. Pregnancy is the time in their life when their eating habits directly affect their fetus food aversion, craving and pica practice during pregnancy remain understudied and underreported [7, 22]. Articles exploring the practice have been contradictory and present little conclusive evidence about its cause and prevalence. In Ethiopiaalso infor¬mation about food aversion, craving, and pica practice is scanty. Identification of the determinants of pica practice, food aversion and craving among pregnant women helps to monitor the health of the pregnant women and in a local area enables to take targeted in-tervention activities.Therefore, this study aimed to assessthe prev¬alence of pica practice, food aversion, craving and its associated factors among pregnant women attending antenatal care in Nifas Silk sub-city health facilities, Addis Ababa Ethiopia, 2021.
Methods
Study Area
The study was conducted in Nifas Silk sub-city, Addis Ababa,Ethi-opia. Addis Ababa is the capital city of Ethiopia. The estimated population of Addis Ababa city is 4.6 million. Nifas Silk sub-city has 68.3 sq.km wide and total Population: 335,740, among them 158,126 are males and 177,614 female Population, and 41,073 es¬timated household. The sub-city also has 13 woredas and 3,529 pregnant women based on Nifas Silk sub-city Data 2020 data.
Study Designand Period
A facility-based cross-sectional study was conducted from July 15 to August 15, 2021.
Study Population
All Pregnant women attending the ANC clinic at Addis Ababa Ni¬fas Silk sub-city health facilities, Addis Ababa Ethiopia were the source population.All pregnant women who were attending ANC at randomly selected health facilities inNifas Silk sub-cityAddis Ababa Ethiopia were the study population.Pregnant women who were inactive bleed andwere mentally unstable during the study and those whose hemoglobin values were not determined were ex¬cluded.
Sample Size Determination
The sample size was calculated using single population proportion formulan=((Z α/2)^2 P(1-P))/d^2 ; by considering the following assumptions, the proportion of food aversion in a study has done in southern Ethiopia, 65%% (7),design effect 1.5 and correction formula with 10% non-response rate, the final sample size was 502 pregnant mothers.
Sampling Procedure
There are65 health facilities that provide ANC service in Nifas Silk sub-city, Addis Ababa city.According to Addis Ababa health bureau data and stratified into 2 private hospitals, 10 Healthcen-ters and 53 private MCHclinics. Of these, 21 health facilities were randomly selected, and with proportionality 1 private hospital, 3 Health centers, and 17 private MCH clinicswere included in the study. The study subjects were drawn from each selected health fa¬cility using a systematic random sampling technique. The number of study participants was assigned to each selected health facility proportional to their average client size attended per month by re¬ferring to the registration books of each antenatal care unit.
Study Variables
Dependent Variables: Pica practice, food aversion,and food crav¬ing Independent Variables: socio-demographic and economic characteristics, obstetrics, gynecological factors and health service utilization, consumption frequency of food groups, meal pattern of pregnant women, anemia, nutritional status.
Operational Definitions
• Antenatal care (ANC) is medical and general care that is pro-vided to pregnant women during pregnancy [23].
• Anemia in pregnancy is the Hemoglobin value for pregnant women is less than 11g/dl irrespective of her gestational age [24].
• Pica - the ingestion of non-food substances that persist for more than one month at an age where eating such objects is considered developmentally inappropriate [19].
• A food craving (also called selective hunger) is an intense de-sire to consume a specific food and is different from normal hunger [25].
• Food aversion is when certain foods make pregnant women uncomfortableThese foods either make them nauseous, or they hate the taste or they have problems swallowing them [26].
Data Collection Tools and Processes
The data were collected by face-to-face interview using a pre-tested structured questionnaire adapted for socio-demographic characteristics of pregnant mothers, obstetric history, nutritional medical history,a dietary habit developed from different kinds of literature, and associated measurement of anemiaand MUAC with adult MUAC meter.Data collectors were2 nurses and 2 midwives. First cards of pregnant women who came to attend ANC during the study period were identified at the ANC clinic and then lookedat her hemoglobin amount on the card [5, 7-13, 16-18, 27].As nec essary the face-to-face interview using a structured questionnaire was followed and MUAC with 1 decimal point measured.
Data Quality Assurance
The training was given for one day to data collectors regarding the purpose of the study and the procedures to be followed for data collection. The structured questionnaire was prepared in Amhar¬ic and retranslated to the English language by a person who was not translated to Amharic to check its consistency and checked to avoid printing errors before data collection started. The name of the data collectors was recorded to enhance the responsibility to any incomplete data. Data collectors were summited the collected data to the supervisor daily and the supervisor checked the com¬pleteness of the data.
Data Processing and Analysis
The collected data were entered by using Epidata software version 3.1 cleaned and analyzed using SPSS version 20.0. Socio-demo-graphic and other variables of pregnant mothers of patients were presented by frequency tables, graphs, and another summary sta¬tistic. Bivariate analysis was used to check the association between dependent and independent variables. All variables that had a sig¬nificant association with a p-value <0.25 in the bivariate analy¬sis were the candidate for multivariable logistic regression. The multivariable logistic regression model was fitted to identify fac¬tors affecting the pica, food aversion, and craving independently. A P-value less than 0.05 was considered statistically significant. The degrees of association between dependent and independent variables were assessed using OR at 95% CI.
The results of multivariable logistic regression with the backward method after checking of model fitness test by Hosmer and Leme-show test were tested. Moreover, multicollinearity was checked by using a variance inflation factor of less than 10 considered as there had no threat of multicollinearity.
Result
Socio-Demographic and Economic Characteristics
A total of 495pregnant women were assessed with a 98.6% re-sponse rate. The mean (± SD) age of the respondents was 26.85 (±4.55) years and more than one-third (36.6%) of the pregnant women were in the age range 25-29 years old. Among the total respondents,382(77.2%) were married and 226(45.7%) attended secondary school. A majority (60.6%) of pregnant womenwere-housewives. More than one-third (34.3%) of the participants’aver-age monthly incomewas 6000-9000 Ethiopian birr per month and the majority (63.2%) had a family size of four or less (Table 1).
Table 1: Socio-demographic and economic characteristic of pregnant women attending antenatal care in Nifas Silk sub-city health facilities, Addis Ababa Ethiopia, 2021
|
Variables |
Category |
Frequency |
Percent |
|
Age |
19-24 |
174 |
35.2 |
|
25-29 |
181 |
36.6 |
|
|
>30 |
140 |
28.3 |
|
|
Marital status |
Married |
382 |
77.2 |
|
Single |
43 |
8.7 |
|
|
Divorced |
50 |
10.1 |
|
|
Widowed |
20 |
4.0 |
|
|
Educational status of pregnant women |
Unable to read and write |
51 |
10.3 |
|
Primary school Grade 1-8 |
143 |
28.9 |
|
|
Secondary school Grade 9 -12 |
226 |
45.7 |
|
|
College and above |
75 |
15.2 |
|
|
Educational status of partner |
Unable to read and write |
9 |
1.8 |
|
Primary school Grade 1-8 |
111 |
22.4 |
|
|
Secondary school Grade 9 -12 |
221 |
44.6 |
|
|
College and above |
154 |
31.1 |
|
|
Occupation of pregnant women |
Government employee |
53 |
10.7 |
|
Private employee |
66 |
13.3 |
|
|
housewife |
300 |
60.6 |
|
|
Other* |
76 |
15.4 |
|
|
Occupation of partner |
Government employee |
119 |
24.0 |
|
Private employee |
136 |
27.5 |
|
|
Merchant |
88 |
17.8 |
|
|
Daily labor |
56 |
11.3 |
|
|
Other* |
96 |
19.4 |
|
|
Average monthly income per ETB |
<3000 |
141 |
28.5 |
|
3000-6000 |
170 |
34.3 |
|
|
6000-9000 |
59 |
11.9 |
|
|
>9000 |
125 |
25.3 |
|
|
Family size |
<4 |
314 |
63.4 |
|
>4 |
181 |
36.6 |
* Housewife, unemployed, student, daily laborer etc.
Obstetrics, Gynecological Factors, and Health Service Utilization
Concerningobstetrics, gynecological and health service utilization characteristics of pregnant women: 74.7% of study participants had <2 pregnancy and less and more than half (51.1%) had ANC visit >4. The majority (61.4%) of pregnant women were third tri¬mester and more than two-thirdss (68.1%) of pregnant women not used family planning before the pregnancy. Only 43.6% had got iron/folate supplementation and 17.6% had a previous history of pregnancy complications (Table 2).
Table 2: Obstetrics, Gynecological factors and health service utilization among pregnant women attending antenatal care in Nifas Silk sub-city health facilities, Addis Ababa Ethiopia, 2021
|
Variables |
Category |
Frequency |
Percent |
|
No of pregnancy |
<2 |
370 |
74.7 |
|
>2 |
125 |
25.3 |
|
|
No of ANC Visit |
<4 |
242 |
48.9 |
|
>4 |
253 |
51.1 |
|
|
Trimester |
First |
31 |
6.3 |
|
Second |
160 |
32.3 |
|
|
Third |
304 |
61.4 |
|
|
Use of family planning |
Yes |
158 |
31.9 |
|
No |
337 |
68.1 |
|
|
History of abortion/stillbirth |
Yes |
80 |
16.2 |
|
No |
415 |
83.8 |
|
|
Iron supplementation |
Yes |
216 |
43.6 |
|
No |
279 |
56.4 |
|
|
History of previous pregnancy complication |
Yes |
87 |
17.6 |
|
No |
408 |
82.4 |
Food Groups Consumption Frequency and Meal Pattern af Pregnant Women
Concerning the meal pattern of pregnant women, nearly three-fourths (73.9%) had eaten three times per day and 64.6% of the re- ported that the household evaluation of the amount of serving was enough. Only 14.3% of pregnant women ate an additional meal and one-fourth (25.1%) skipped their meal (Table-3).
Table 3: Meal pattern of pregnant women attending antenatal care in Nifas Silk sub-city health facilities, Addis Ababa Ethiopia,2021
|
Variables |
Category |
Frequency |
Percent |
|
No of meals per day |
Twice |
38 |
7.7 |
|
Three times |
366 |
73.9 |
|
|
Four times and more |
91 |
18.4 |
|
|
Eating additional meals |
Yes |
170 |
34.3 |
|
No |
325 |
65.7 |
|
|
No Additional meal |
One |
58 |
11.7 |
|
Two |
112 |
22.6 |
|
|
Skipping meal |
Yes |
124 |
25.1 |
|
No |
371 |
74.9 |
|
|
Type of meal skipped |
Breakfast |
60 |
12.1 |
|
Lunch |
37 |
7.5 |
|
|
Dinner |
27 |
5.5 |
|
|
Household evaluation of the amount of serving |
Not enough |
175 |
35.4 |
|
Enough |
320 |
64.6 |
Of the total pregnant womenwho participated in this study, 44.2%consumed cereals, 32.1% consumed any fruits, 32.5% con¬sume milk products, 63% consume oil and butter, 28.3% consume sugar and soft drink, and 80.6% consumed tea and coffee more than once per day. 37.6% consume roots and tubers, 28.7% con¬sume any vegetable and 34.9% consume eggs once or twice per week. More than two-thirds (70.1%)of pregnant women never eat fish and 37.6% consume legumes once per day (Table4).
Table 4:Consumption frequency of food groups of pregnant women one month before the study time among pregnant women attending antenatal care in Nifas Silk sub-city health facilities, Addis Ababa Ethiopia, 2021
|
Frequency of food groups |
||||||
|
Food group (%) |
More than once per day |
Once per day |
3-6 times per week |
Once or twice per week |
Twice per month |
Never |
|
Cereal |
44.2 |
34.9 |
12.9 |
5.7 |
1.2 |
1.0 |
|
Roots and tubers |
20.4 |
17.4 |
16.2 |
38.4 |
2.8 |
4.8 |
|
Any vegetables |
28.5 |
12.1 |
16.6 |
37.6 |
4.0 |
1.2 |
|
Any fruits |
32.1 |
24.6 |
10.3 |
28.7 |
2.8 |
1.4 |
|
Meat |
1.8 |
2.2 |
7.1 |
18.6 |
45.7 |
24.6 |
|
Egg |
1.4 |
22.4 |
22.6 |
34.9 |
6.3 |
12.3 |
|
Fish |
0.6 |
2.0 |
1.2 |
8.5 |
17.6 |
70.1 |
|
Legumes |
22.8 |
37.6 |
7.9 |
20.2 |
3.6 |
7.9 |
|
Milk and milk products |
32.5 |
21.6 |
10.7 |
14.5 |
4.8 |
15.8 |
|
Oil and/ or butter |
63.0 |
7.3 |
1.0 |
7.7 |
8.9 |
12.1 |
|
Sugar and soft drinks |
28.3 |
13.7 |
13.7 |
28.7 |
4.6 |
10.9 |
|
Tea and coffee |
80.6 |
14.9 |
2.4 |
1.0 |
1.0 |
- |
Nutritional Status and Level of Anemia AmongPregnant Women
The prevalence of anemia in this study was 18.6% and nearly one-third (29.9%) of pregnant women had MUAC less than 21cm (Fig-ure 1).

Figure 1: Nutritional status and Anemic status of pregnant women attending antenatal care in Nifas Silk sub-city health facilities, Addis Ababa Ethiopia, 2021
Pica Practice, Food Aversion, and Craving
The prevalence of Pica practice, food aversion, and craving were 22% 95%CI (18.4, 25.7), 40.8% 95%CI (36.5, 45.2), and 85% 95%CI (82.6, 88.8) respectively (Figure 2).
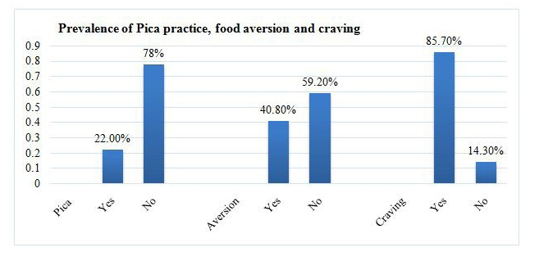
Figure 2: The prevalence of Pica practice, food aversion, and craving among pregnant women attending antenatal care in Nifas Silk sub-city health facilities, Addis Ababa Ethiopia, 2021
Among the pregnant mothers, the most common type wassoil (clay, sand, wall mud) (11.5%), 13.1% had frequency less than ones per day and 73(14.7%) of their reason were personal inter¬est. Concerning food craving more than one-fifth (21.4%) craved vegetables due to flavor (69.1%). The most common averted food among pregnant women were milk and milk products 6.5% and cereals 4% and 18.4 % of participants were due to smell of food (Table 5).
Table 5: Pica practice, food aversion and craving among pregnant women attending antenatal care in Nifas Silk sub-city health facilities, Addis Ababa Ethiopia, 2021
|
Variables |
Category |
Frequency |
Percent |
|
Pica practice in the current pregnancy |
Yes |
109 |
22.0 |
|
No |
386 |
78.0 |
|
|
Types of pica |
Soft white stone |
2 |
0.4 |
|
Soil (clay, sand, wall mud) |
57 |
11.5 |
|
|
Ash |
21 |
4.2 |
|
|
Coffee residue/grind |
9 |
1.8 |
|
|
Other |
20 |
4.0 |
|
|
Frequency of pica practice |
Less than once per day |
65 |
13.1 |
|
Once per day |
39 |
7.9 |
|
|
2-3 times per day |
5 |
1.0 |
|
|
Reason for pica |
Personal interest |
73 |
14.7 |
|
Smell of pica substance |
36 |
7.3 |
|
|
Food craving in the current pregnancy |
Yes |
424 |
85.7 |
|
No |
71 |
14.3 |
|
|
Type of craved food |
Meat |
22 |
4.4 |
|
Egg |
83 |
16.8 |
|
|
Vegetable |
106 |
21.4 |
|
|
Fruits |
83 |
16.8 |
|
|
Cereal products |
22 |
4.4 |
|
|
Legumes roots |
18 |
3.6 |
|
|
Fish |
27 |
5.5 |
|
|
Other |
64 |
12.9 |
|
|
Reason for craving |
Color |
42 |
8.5 |
|
Flavor |
342 |
69.1 |
|
|
Other |
40 |
8.1 |
|
|
Eating craved food |
Yes |
248 |
50.1 |
|
No |
176 |
35.6 |
|
|
The craving occurs most time in the |
Morning |
152 |
30.7 |
|
Afternoon |
184 |
37.2 |
|
|
Evening |
88 |
17.8 |
|
|
Food aversion in the current pregnancy |
Yes |
202 |
40.8 |
|
No |
293 |
59.2 |
|
|
Types of food avoided |
Meat |
61 |
12.3 |
|
Vegetable |
25 |
5.1 |
|
|
Fruits |
9 |
1.8 |
|
|
Cereal products |
20 |
4.0 |
|
|
Legumes |
10 |
2.0 |
|
|
Milk and milk products |
32 |
6.5 |
|
|
Fish |
5 |
1.0 |
|
|
Other |
40 |
8.1 |
|
Reason for food aversion |
Personal dislike |
61 |
12.3 |
|
Smell of food |
91 |
18.4 |
|
|
Heart burn |
19 |
3.8 |
|
|
Other |
31 |
6.3 |
Factors Associated with Pica Practices
Bivariate analysis showed thatage, educational status of pregnant women, average monthly income, ANC, food craving, family planning, Iron/folate supplementation, and history of pregnancy complicationwas significantly associated with pica practice and candidate for multivariable logistic regression.
Results of the logistic regression showed that mothers who can’t able to read and write were3 times more likely to practice pica than those who had college and above educational status [AOR, 2.95 (95% CI: 1.14, 7.62)]. Mothers who craved food were 76% less likely to practice pica compared to those who haven’t had food cravings[AOR, 0.24 (95% CI: 0.09, 0.66)]. Mothers who used family planning were 2.35 times [AOR, 2.35 (95% CI: 1.34, 4.12)] more likely to have pica practice. The odds of pica practice among mothers who got iron/folate supplementation were 8.67 times [AOR, 2.45 (95% CI: 1.47, 4.05)] more likely to havepica practice than the counterpart. It was also observed that the likelihood of being practicing pica was 57% lower [AOR, 0.43 (95% CI: 0.21, 0.90)] in mothers with a history of pregnancy-related complica-tionscompared to mothers who didn’t(Table 6).
Table 6: Results of Bivariate and multivariable Logistic Analysis of factors associated with Pica practice among pregnant women attending antenatal care in Nifas Silk sub-city health facilities, Addis Ababa Ethiopia, 2021.
|
Variables |
Pica Practice |
COR (95%CI) |
P-Value |
AOR 95%CI |
P-Value |
||
|
Yes N (%) |
No N (%) |
||||||
|
Age |
19-24 |
40(22.9) |
134(77.1) |
0.75(0.45-1.24) |
0.260 |
1.07(0.85-1.88) |
0.919 |
|
25-29 |
29(16.1) |
152(83.9) |
0.48(0.26-0.82) |
0.007 |
0.62(0.63-1.72) |
0.141 |
|
|
>30 |
40(28.6) |
100(71.4) |
1 |
|
1 |
|
|
|
Educational status of pregnant women |
Unable to read and write |
21(41.2) |
30(58.8) |
2.81(1.27-6.19) |
0.011 |
2.95(1.14-7.62) |
0.021 * |
|
Primary school Grade 1-8 |
23(16.1) |
120(83.9) |
0.77(0.37-1.56) |
0.472 |
1.04(0.46-2.59) |
0.920 |
|
|
Secondary school Grade 9 -12 |
50(22.1) |
176(77.9) |
1.14(0.59-2.17) |
0.699 |
1.05(0.51-2.15) |
0.892 |
|
|
College and above |
15(20.0) |
60(80.0) |
1 |
|
1 |
|
|
|
Average monthly income (in birr) |
<3000 |
23(16.3) |
118(83.7) |
0.40(0.22-0.72) |
0.002 |
0.51(0.13-1,06) |
0.053 |
|
3000-6000 |
30(17.6) |
140(82.4) |
0.44(0.26-0.76) |
0.030 |
0.49(0.22-1.15) |
0.064 |
|
|
6000-9000 |
15(25.4) |
44(74.6) |
0.71(0.35-1.40) |
0.311 |
0.82(0.38-1.79) |
0.620 |
|
|
>9000 |
41(32.8) |
84(67.2) |
1 |
|
1 |
|
|
|
ANC |
<4 |
30(12.4) |
212(87.6) |
0.31(0.19-0.41) |
0.001 |
0.43(0.20- 1.09) |
0.059 |
|
>4 |
79(31.2) |
174(68.8) |
1 |
|
1 |
|
|
|
Food craving |
No |
5(7.1) |
66(92.9) |
0.23(0.09-0.59) |
0.002 |
0.24(0.09- 0.66) |
0,006* |
|
Yes |
104(24.5) |
320(75.5) |
1 |
|
1 |
|
|
|
Family planning |
Yes |
43(27.2) |
115(72.8) |
1.54(0.99-2.39) |
0.057 |
2.35(1.34-4.12) |
0.003* |
|
No |
66(19.6) |
271(80.4) |
1 |
|
1 |
|
|
|
Iron/folate supplemen- tation |
Yes |
64(29.6) |
152(70.4) |
2.19(1.42-3.37) |
<0.001 |
2.44(1.47-4.05) |
0.001* |
|
No |
45(17.4) |
234(82.4) |
1 |
|
1 |
|
|
|
History of pregnancy complication |
Yes |
13(14.9) |
74(85.1) |
0.57(0.30-1.07) |
0.082 |
0.43(0.21-0.90) |
0.024* |
|
No |
96(23.5) |
312(76.5) |
1 |
|
1 |
|
|
*Significant at P value <0.05, ** significant at p value <0.001, AOR= adjusted odds ratio, COR: Crude Odds Ratio,
Factors Associated with Food Craving
Age in years, family size, ANC, MUAC, history of abortion, no of meals per day, Iron/folate supplementation, and history of pregnan¬cy complication in bivariate analysis were significantly associated with food craving and entered in multivariable logistic regression. Regarding food craving, mothers whose age range between 19-24 and 25-29 years old were 83% and 44% lower odds of food craving than those whose age 30 and older [AOR, 0.17 (95% CI: 0.06, 0.44)] and [AOR, 0.56 (95% CI: 0.34, 0.89] respectively. As compared with mothers who visit ANC > 4 times, the likelihood of food craving was 86% [AOR, 0.14 (95% CI: 0.08, 0.34] less likely formothers with four and below ANC visits. Mothers who had <23cm MUAC were 2.25less likely to havefood cravingscom-pared to those who have>21cm MUA [AOR, 2.25 (95% CI: 1.06, 4.78)]. The odds of food craving among mothers who got iron/fo-late supplementation were 80% [AOR, 0.20 (95% CI: 0.10, 0.38)] less likely to havefood cravings than the counterpart. The result of the study was also observed that the likelihood of having food craving was 77% lower [AOR, 0.23 (95% CI: 0.11, 0.49)] in moth¬ers with a history of pregnancy-related complications compared to mothers who didn’t (Table 7).
Table 7: Results of Bivariate and multivariable Logistic Analysis of factors associated with food craving among pregnant women attending antenatal care in Nifas Silk sub-city health facilities, Addis Ababa Ethiopia, 2021.
|
Predicators |
Food craving |
COR (95%CI) |
P-Value |
AOR 95%CI |
P-Value |
||
|
Yes N (%) |
No N (%) |
||||||
|
Age in years |
19-24 |
138(80.2) |
36(19.8) |
0.29(0.14-0.62) |
0.001 |
0.17(0.06-0.44) |
<0.001** |
|
25-29 |
156(86.2) |
25(13.8) |
0.41(0.22-1.04) |
0.062 |
0.56(0.34-0.89) |
0.028* |
|
|
>30 |
130(92.9) |
10(7.1) |
1 |
|
1 |
|
|
|
Family size |
<4 |
253(80.6) |
61(19.4) |
0.24(0.12-0.49) |
<0.001 |
0.64(0.28- 1.44) |
0.277 |
|
>4 |
171(94.5) |
10(5.5) |
1 |
|
1 |
|
|
|
ANC |
<4 |
183(75.6) |
59(24.4) |
0.15(0.08-0.29) |
<0.001 |
0.14(0.08-0.34) |
<0.001** |
|
>4 |
241(95.2) |
12(4.8) |
1 |
|
1 |
|
|
|
MUAC |
< 21cm |
135(91.2) |
13(8.8) |
2.08(1.01-3.93) |
0.023 |
2.25(1.06-4.78) |
0.034* |
|
>21cm |
289(83.3) |
58(16.7) |
1 |
|
1 |
|
|
|
History of Abortion |
Yes |
62(77.5) |
18(22.5) |
0.51(0.28-0.92) |
0.025 |
0.94(0.30-2.93) |
0.916 |
|
No |
362(87.2) |
53(12.8) |
1 |
|
1 |
|
|
|
No of meals per day |
Twice |
23(60.5) |
15(39.5) |
0.46(0.21-0.65) |
<0.001 |
0.41(0.14- 1.19) |
0.101 |
|
Three times |
331(90.4) |
35(9.6) |
2.84(1.56-5.17) |
0.001 |
1.34(0.62-2.62) |
0.414 |
|
|
Four times and more |
70(76.9) |
21(23.1) |
1 |
|
1 |
|
|
|
Iron/folate supplemen- tation |
Yes |
166(80.6) |
50(19.4) |
0.27(0.16-0.47) |
<0.001 |
0.20(0.10- 0.38) |
<0.001** |
|
No |
258(92.5) |
21(7.5) |
1 |
|
1 |
|
|
|
History of pregnancy complication |
Yes |
64(73.6) |
23(26.4) |
0.37(0.21-1.04) |
0.002 |
0.23(0.11-0.49) |
0.001* |
|
No |
360(88.2) |
48(11.8) |
1 |
|
1 |
|
|
*Significant at P value <0.05, ** significant at p value <0.001, AOR= adjusted odds ratio, COR: Crude Odds Ratio,
Factors Associated with Food Aversion
Regarding food aversion, mothers who earned <3000 ETB per month were 56% [AOR, 0.44 (95% CI: 0.24, 0.81)] less likely to food aversion than those who earned >9000ETB per month. Mothers who used family planning were 3.5 times [AOR, 3.45 (95% CI: 2.21, 5.40)] more likely to have food aversion than their counterparts. The odds of food aversion among mothers who got iron/folate supplementation were 2.5 times [AOR, 2.47 (95% CI: 1.59, 3.85)] more likely to havefood aversion than the counterpart (Table 8).
Table 8: Results of Bivariate and multivariable Logistic Analysis of factors associated with food aversion among pregnant women attending antenatal care in Nifas Silk sub-city health facilities, Addis Ababa Ethiopia, 2021.
|
Predicators |
Food craving |
COR (95%CI) |
P-Value |
AOR 95%CI |
P-Value |
||
|
Yes N (%) |
No N (%) |
||||||
|
Average monthly income (in birr) |
<3000 |
39(27.7) |
102(72.3) |
0.52(0.31-0.87) |
0.012 |
0.44(0.24- 0.81) |
0.008 * |
|
3000-6000 |
99(58.2) |
71(41.8) |
1.89(1.19-3.02) |
0.007 |
1.71(0.99-2.94) |
0.056 |
|
|
6000-9000 |
11(18.6) |
48(81.4) |
0.31(0.15-0.66) |
0.002 |
0.46(0.20-1.05) |
0.065 |
|
|
>9000 |
53(42.4) |
72(57.6) |
1 |
|
1 |
|
|
|
ANC |
<4 |
142(58.7) |
100(41.3) |
4.57(3.10-6.72) |
<0.001 |
3.45(2.21-5.40) |
<0.001* |
|
>4 |
60(23.7) |
193(76.3) |
1 |
|
1 |
|
|
|
Family planning |
Yes |
94(59.5) |
64(40.5) |
3.11(2.11-4.61) |
<0.001 |
2.11(1.32-3.37) |
0.002* |
|
No |
108(32.1) |
229(67.9) |
1 |
|
1 |
|
|
|
No of meals per day |
Twice |
23(60.5) |
15(39.5) |
0.95(0.42-1.99) |
0.822 |
1.32(0.53-3.25) |
0.557 |
|
Three times |
122(33.3) |
244(66.7) |
0.30(0.19-0.48) |
<0.001 |
0.58(0.34-1.03) |
0.064 |
|
|
>Four times |
57(62.6) |
34(37.4) |
1 |
|
1 |
|
|
|
Iron/folate supplemen- tation |
Yes |
115(48.6) |
101(51.4) |
2.51(1.74-3.63) |
<0.001 |
2.47(1.59-3.85) |
<0.001** |
|
No |
87(31.1) |
192(68.9) |
1 |
|
1 |
|
|
|
Household evaluation of amount of serving |
Not enough |
57(32.6) |
118(67.4) |
0.58(0.39-0.86) |
0.006 |
0.61(0.38-1.11) |
0.075 |
|
Enough |
145(45.3) |
175(56.7) |
1 |
|
1 |
|
|
*Significant at P value <0.05, ** significant at p value <0.001, AOR= adjusted odds ratio, COR: Crude Odds Ratio,
Discussion
The prevalence of pica (22%) was higher as compared to a study done in Tehran, Iran 8.33 % and lower as compared to a study done in Dale Woreda, SidamaZone, SNNPRS, Ethiopia: 30.4%, Western Kenya was at 27.4%, Nigeria 38.9%,Dares Salaam; Tan¬zania Pica, 63.7%[17, 5, 13, 12, 20]. This variability might be due to attributed to multiple factors including differences in diagnostic criteria and measurement underreporting in regional differences, dietary and cultural practices, and differences in the populations sampled (e.g. ethnicity, socioeconomic status). Furthermore, among the pregnant mothers, the most common type was soil (clay, sand, wall mud) (11.5%). This result was consistent with a study done in Dale Woreda, Sidama zone, SNNPRS, Ethiopia: and Dares Salaam; Tanzania [5, 20].
The magnitude of craving (40.8%) was higher when compared to a study done in Dares Salaam, Tanzania 75.5%, Western Kenya 73.8%, Dale Woreda, SidamaZone, SNNPRS, Ethiopia, 43.5%, another study done in southern Ethiopia 72% [20, 13, 5, 7]. The same to above the difference might be regional changes, dietary and cultural practices, and differences in the populations sampled (e.g. ethnicity, socioeconomic status). Pregnant mothers experi¬enced food craving more than one-fifth (21.4%) craved vegetable and their reason was due to flavor (69.1%). This finding was in line with a study in. southern Ethiopia, which considered craving to be a call (“demand”) by the fetus, that a mark would develop on the fetal body [7].
The proportion of food aversion (85%) was lower a study done in Dares Salaam, Tanzania food aversion 70.1%; Dale Woreda, SidamaZone, SNNPRS, Ethiopia: 67.9%, another study done in southern Ethiopia 65% [20, 5, 7]. This might be due to socio-de-mographic and economic, cultural factors. The most common averted food among pregnant women were milk and milk prod¬ucts 6.5% and cereals 4% and 18.4 % of participants were due to smell of food. Supporting studies were found in Dale Woreda, Si-damaZone, SNNPRS, Ethiopia:, other south Ethiopian studiesand Western Kenya [5, 7, 13]. This might be because food aversion is considered a physiological mechanism where one learns to distin¬guish safe and toxic foods, the human perceptual systems become more sensitive and certain food, smells and tastes are avoided and this frequently triggers pregnancy sickness like nausea and vom¬iting [28].
Mothers who can’t able to read and write were 3 times more likely to practice pica than those who had college and above educational status. Supporting studies found a study was done in Western Ken¬ya, Nigeria and Tehran, Iran [13, 12, 17]. This might be due to that awareness of women concerning dietary practice including iron supplementation and also, more attention to them by their hus¬bands and family towards these pregnancy symptoms.
Mothers who crave food were 76% less likely to practice pica compared to those who haven’t had a food craving. Even though food aversion, craving and pica practices are closely linked to the dietary practice of pregnant women in Ethiopiaand in Tehran, Iran,the result from the current study were inconsistent [5, 17].
This might be attributed to multiple factors including differences in diagnostic criteria and measurement underreporting in regional differences, dietary and cultural practices.
The odds of pica practice and food craving among mothers who got iron/folate supplementation were higherthan their counterparts. It seems that iron supplementation before and/or during pregnancy has a protective effect against pica practice a study in Tehran, Iran, although there were no associations between iron supplementation and pica practice in some studies[17, 29, 9]. The result of the study was also observed that the likelihood of having pica practice and food cravings were 57% and 77% lower in mothers with a history of pregnancy-related complications com-pared to mothers who didn’t respectively. The result was consis-tent in the study done in Tehran, Iran, which revealed, there was a significant association between pica practice and pregnancy com¬plications like cesarean birth [17]. Therefore, the kind of delivery is unknown. Further studies should be conducted concerning the association between pregnancy-related symptoms and pregnan¬cy-related complications.
Additionally, family planning users before pregnancy wasa pos-itive association with both pica practice and food aversion. This study also revealed that the likelihood of having food cravingswas less likely as mothers get older.This might be due to the result of exposure, health education and awareness increases as a pregnant mother gets older.
As compared with mothers who visit ANC > 4 times, the likeli-hood of food craving was 86% less likely for mothers with four and below ANC visits. This might be since ANC has a positive impact on the dietary practice modification by iron/folate supple¬mentation, health education.
Mothers who had <23cm MUAC were 2.25 less likely to have food cravings compared to those who have >21cm MUACsize. This is because these pregnancy problems resulted in micronutri-ent deficiency: some studies have reported associated of pica with increased anemia, low plasma zinc level, low hematocrit, and low hemoglobin [11, 16].
Mothers who earned <3000 Ethiopian birr per month were 56% less likely to have food aversion than those who earned >9000 Ethiopian birr per month. Supporting studies were found that food aversion was higher in low-income countries and among individ¬uals with limited education [14, 27]. The study has a limitation on being a cross-sectional studydesign which does not establish a causal relationship between the three common pregnancies related to dietary practice and determinants.
Conclusion
The result of the current study revealed thatpica practice, food aversion, and food craving were prevalent in the study area. Age of pregnant women, educational status of pregnant women, fam¬ily size, family planning, ANC visit, iron/folate supplementation,having low MUAC size, history of pregnancy complicationwere factors associated with those pregnancy-related symptoms.Pro-grams and interventions are needed to reduce the prevalence of pica practice, food aversion and craving behavior and to ensure that the pregnant women in the study area have optimal meal pat¬terns and good nutritional status.A due emphasis should also be given to strengthening the health extension program to improve and provide participatory nutrition educationto create awareness and to develop behavior change communication that pregnant women should practice appropriate eating habits and consume foods that promote their health and that of the fetus. Health care workers/nutritionists may use these findings to provide appropri¬ate nutrition counseling and education to guide women to make a wise choice of foods to improve their health and nutritional sta¬tus during pregnancy.Pica practice, food aversions and cravings should be investigated early during antenatal follow-up, and ad¬vice should be offered.
Abbreviations and Acronyms
ANC: Antenatal Care;
AOR: Adjusted Odds Ratio;
BMI: Body Mass Index;
CDC: Centers for Disease Control and Prevention;
Hgb: Hemoglobin;
CI: Confidence Interval;
IDA: Iron Deficiency Anemia;
MUAC: Middle Upper Arm Circumference;
NGOs: Non-Governmental Organizations;
SD: Standard Deviation;
WHO: World Health Organization.
Ethical Clearance
The ethical issue of this study was approved by the ethical com¬mittee of the Jimma University, department of public health and official permission to undertake the study was obtained from the Addis Ababa health beauro. The supportive staffs (i.e. card office, ANC clinics were informed about the purpose of the study and verbal consent was obtained. Confidentiality of patient informa¬tion was assured and information recorded anonymously.
Acknowledgement
The authors extend their special thanks to both data collectors and supervisors. Additionally, the health facilities that data were taken.
Availability of Data and Materials
The datasets used and/or analyzed during the current study are available fromthe corresponding author.
Authors Contribution
Conceptualization: GS and MF. Formal analysis: GS, GG, and DT. Development or design of methodology: MF, GS. Entering data into computer software: GS and MF. Supervision: GG and DT. Writing original draft: MF and GS. Writing review and editing: MF, GS. All authors read and approved the final manuscript.
References
- Lindsay, K. L., Gibney, E. R., McNulty, B. A., & McAuliffe,F. M. (2014). Pregnant immigrant Nigerian women: an exploration of dietary intakes. Public Health, 128(7), 647-653.
- Christian, P., Mullany, L. C., Hurley, K. M., Katz, J., & Black,R. E. (2015, August). Nutrition and maternal, neonatal, and child health. In Seminars in perinatology (Vol. 39, No. 5, pp. 361-372). WB Saunders.
- Walsh, J. M., & McAuliffe, F. M. (2015). Impact of maternal nutrition on pregnancy outcome–does it matter what pregnant women eat?. Best Practice & Research Clinical Obstetrics &Gynaecology, 29(1), 63-78.
- Lacey, E. P. (1990). Broadening the perspective of pica: literature review. Public Health Reports, 105(1), 29.
- Yoseph, H. H. (2015). Prevalence of food aversions, cravings and pica during pregnancy and their association with nutritional status of pregnant women in Dale Woreda, Sidama zone, SNNPRS, Ethiopia. International Journal of Nutrition and Metabolism, 7(1), 1-14.
- Coronios-Vargas, M., Toma, R. B., Tuveson, R. V., &Schutz,I. M. (1992). Cultural influences on food cravings and aversions during pregnancy. Ecology of food and nutrition, 27(1), 43-49.
- Demissie, T., Muroki, N. M., &Kogi-Makau, W. (1998). Food aversions and cravings during pregnancy: Prevalence and significance for maternal nutrition in Ethiopia. Food and Nutrition Bulletin, 19(1), 20-26.
- Fawcett, E. J., Fawcett, J. M., &Mazmanian, D. (2016). A meta-analysis of the worldwide prevalence of pica during pregnancy and the postpartum period. International Journal of Gynecology & Obstetrics, 133(3), 277-283.
- Khajavishojaii, K. (2000). prevalence of pica in women referred to Prenatal care clinics of university hospitals in Tehran. Daneshvar 8: 43–46.
- Khoushabi, F., Ahmadi, P., Shadan, M. R., Heydari, A., Miri, A., &Jamnejad, M. (2014). Pica practices among pregnant women are associated with lower hemoglobin levels and pregnancy outcome. Open Journal of Obstetrics and Gynecology, 2014.
- Geissler, P. W., Prince, R. J., Levene, M., Poda, C., Beckerleg,S. E., Mutemi, W., & Shulman, C. E. (1999). Perceptions of soil-eating and anaemia among pregnant women on the Kenyan coast. Social science & medicine, 48(8), 1069-1079.
- Aminu, M. B., Mohammed, A., Muhammed, B. A., Abdul-razak, T., &Chinedu, A. (2019). Prevalence of pica among pregnant women attending antenatal clinic in a tertiary facility in Nigeria. Annals of African Medical Research, 2(2).
- Kariuki, L., Lambert, C., Purwestri, R., &Biesalski, H. K. (2016). Trends and consequences of consumption of food and non-food items (pica) by pregnant women in Western Kenya. NFS journal, 5, 1-4.
- Balarajan, Y., Ramakrishnan, U., Özaltin, E., Shankar, A. H., & Subramanian, S. V. (2011). Anaemia in low-income and middle-income countries. The lancet, 378(9809), 2123-2135.
- Rabel, A., Leitman, S. F., & Miller, J. L. (2016). Ask about ice, then consider iron. Journal of the American Association of Nurse Practitioners, 28(2), 116-120.
- Miao, D., Young, S. L., & Golden, C. D. (2015). A metaâ?ÂÂanalysis of pica and micronutrient status. American Journal of Human Biology, 27(1), 84-93.
- Ezzeddin, N., Zavoshy, R., Noroozi, M., Jahanihashemi, H., &Riseh, S. H. (2015). Prevalence and risk factors for pica during pregnancy in Tehran, Iran. Eating and Weight Disorders-Studies on Anorexia, Bulimia and Obesity, 20(4), 457-463.
- Orloff, N. C., &Hormes, J. M. (2014). Pickles and ice cream! Food cravings in pregnancy: hypotheses, preliminary evidence, and directions for future research. Frontiers in psychology, 5, 1076.
- OGALLO, O. I. (2008). Prevalence of PICA practices and associated factors among pregnant women attending antenatal care clinic at PCEA Kikuyu hospital. University of Nairobi, Kenya.
- Myaruhucha, C. N. (2009). Food cravings, aversions and pica among pregnant women in Dar es Salaam, Tanzania. Tanzania Journal of Health Research, 11(1).
- Edition, F. (2013). Diagnostic and statistical manual of mental disorders. Am Psychiatric Assoc, 21(21), 591-643.
- López, L. B., Ortega Soler, C. R., & Pita Martín de Portela, M.L. (2004). Pica during pregnancy: a frequently underestimated problem. Archivoslatinoamericanos de nutricion, 54(1), 17-24.
- Samson NegussieAPMDOaG. Obstetrics and Gynecology For Health Science Students Lecture Note. text book. April 2006:36.
- WHO/CDC WGDoA. Worldwide Prevalence of Anemia 1993–2005. WHO Press, Geneva, Switzerland. 2008.
- Ronzio, R. A. (2003). The encyclopedia of nutrition and good health. Facts on file. Inc. p, 547.
- Alvarez M. Food aversion vs. anorexia: What’s the differ-ence? 2015.
- Rose, E. A., Porcerelli, J. H., & Neale, A. V. (2000). Pica: common but commonly missed. The Journal of the American Board of Family Practice, 13(5), 353-358.
- Barkow JH, Cosmides L, Tooby J. Pregnancy sickness as adaptation: a deterrent to maternal ingestion of teratogens, . 1995:327-66.
- Boatin, A., Wylie, B., Singh, M. P., Singh, N., Yeboah-Ant-wi, K., & Hamer, D. (2012). 671: Prevalence of and risk factors for pica among pregnant women in Chhattisgarh, India. American Journal of Obstetrics & Gynecology, 206(1), S299.