
Journal of Research and Education(JRE)
ISSN: 2996-2544 | DOI: 10.33140/JRE

Research Article - (2024) Volume 2, Issue 2
Exploring the Impact of Social Sector Expenditure on Economic Growth in India: An Econometric Approach
Received Date: Jun 01, 2024 / Accepted Date: Jul 08, 2024 / Published Date: Aug 05, 2024
Copyright: ©©2024 Jitendra Kumar Sinha. This is an open-access article distributed under the terms of the Creative Commons Attribution License, which permits unrestricted use, distribution, and reproduction in any medium, provided the original author and source are credited.
Citation: Sinha, J. K. (2024). Exploring the Impact of Social Sector Expenditure on Economic Growth in India: An Econometric Approach. J Res Edu, 2(2), 01-11.
Abstract
The development process worldwide has revealed a relationship between expenditure in social sectors and economic development. The growth-propelling role of the social sector has been widely discussed by academicians and policymakers. This paper examines the causal relationship between social sector spending and economic development using annual time series data from 1972-73 to 2022-23 for India. A comprehensive set of econometric techniques is employed to determine the causal relationship between social sector expenditure and economic development in India, with the Augmented Dickey-Fuller (ADF) and Phillips-Perron (PP) unit root tests utilized to test for stationarity. The results indicate a significant bi-directional relationship between GDP per capita and expenditures on education, family welfare, housing, urban development, water supply and sanitation, nutrition, social security, welfare, labor and labor laws, and the welfare of scheduled castes and tribes. However, a unidirectional causality from health expenditure to economic development is observed. These findings underscore the significant contribution of social spending to the economic growth of a developing country like India, providing valuable insights for policymakers in formulating appropriate policies.
Keywords
Social Expenditure, Per Capita GDP, Social Development, Human Development, Human Capital
Introduction
Social sector expenditures, which encompass investments in areas such as education, healthcare, and social welfare, are widely recognized as crucial drivers of economic growth. Several reasons underpin this perspective:
• Human capital development: Social sector expenditures contribute significantly to building human capital, defined as the knowledge, skills, and experience possessed by a population. For instance, investment in education enables individuals to acquire new skills, enhancing their productivity and earning potential, which, in turn, fosters economic growth.
• Health and productivity: Investments in healthcare reduce illness and disease, positively impacting labor productivity. Healthier individuals are better equipped to work and contribute to the economy, thereby driving economic growth.
• Social safety nets: Expenditures on social welfare programs provide a safety net for vulnerable individuals and families, reducing poverty and improving social welfare. This can lead to better social outcomes and reduced inequality, fostering a more stable and productive society.
• Overall, social sector expenditures can contribute to economic growth by enhancing human capital development, increasing labor productivity, and providing a safety net for vulnerable individuals and families. However, the impact of these expenditures on economic growth can vary depending on the specific policies and programs implemented and the broader economic and political context.
In recent years, social sector expenditure has played a significant role in transforming India, both domestically and globally. Notable changes include:
• Health and Sanitation: Significant improvements have been made in the health and sanitation sector. Initiatives like the Swachh Bharat Abhiyan, which aimed to make India open-defecation-free, and Ayushman Bharat, which provides health insurance to the poor, have improved access to basic healthcare and sanitation services, leading to better health outcomes and an improved quality of life for many Indians.
• Education: India's investment in education has improved over the years, with initiatives such as the Right to Education Act, which guarantees free and compulsory education to all children up to the age of 14, and the launch of digital education platforms like Swayam, which has made education accessible to millions of people across the country. These investments have improved literacy rates and increased the number of educated individuals in the country, positively impacting economic growth.
• Poverty reduction: Social sector expenditures have also contributed to poverty reduction in India. The National Rural Employment Guarantee Act (NREGA) has employed millions of rural workers, while initiatives like the National Food Security Act have ensured access to basic food and nutrition for the poor.
• Global recognition: India's social sector expenditure has gained global recognition, with programs like Ayushman Bharat being lauded by the World Health Organization and other international organizations. India's efforts in improving social welfare and human development have helped the country improve its global human development rankings, reflecting progress in improving the quality of life for its citizens. In summary, India's social sector expenditure has played a vital role in improving the country's social and economic indicators, contributing to its transformation both domestically and on the global stage.
Outcome of Social Sector Expenditure
Social sector expenditure has had a significant positive impact on the economic growth of India. Investments in education, healthcare, and social welfare have contributed to human capital development, increased labor productivity, and reduced poverty and inequality, all of which foster economic growth.
Human Capital Development: Investments in education lead to an increase in skilled workers, boosting productivity and economic growth. Enhanced educational initiatives, such as the Right to Education Act and digital platforms like Swayam, have significantly improved literacy rates and the number of educated individuals in India. Health and Productivity: Healthcare investments reduce illness and disease, resulting in a healthier workforce and reduced absenteeism, which contribute to economic growth. Programs like Ayushman Bharat have improved access to healthcare, leading to better health outcomes.
Social Safety Nets: Social welfare programs provide a safety net for vulnerable individuals and families, reducing poverty and enhancing social welfare. This contributes to improved social outcomes and reduced inequality, fostering a stable and productive society. Initiatives like the National Rural Employment Guarantee Act (NREGA) and the National Food Security Act have played pivotal roles in poverty reduction.
Recent Investments and Initiatives: India has made significant investments in social sector expenditures through programs like Ayushman Bharat, NREGA, and Swachh Bharat Abhiyan. These initiatives have improved social welfare and human development, contributing to India's overall economic growth and development.
Alignment with International Standards: India’s social sector expenditure aligns broadly with international standards set by organizations like the United Nations and the World Health Organization. These standards emphasize investments in healthcare, education, and social welfare, as well as the reduction of poverty and inequality. India has made significant progress in these areas, but there is still room for improvement, particularly in public health spending and addressing disparities in healthcare access between urban and rural areas.
State-wise Impact: The impact of social sector expenditure on economic growth varies across states in India, influenced by factors such as investment levels, specific policies and programs, and the broader economic and political context. For example, Kerala, known for its heavy investment in social sectors, has achieved high literacy rates and life expectancy, contributing to higher economic growth. Similarly, states like Tamil Nadu and Andhra Pradesh have seen improvements in human capital development and economic growth due to substantial investments in education and healthcare. However, challenges remain in effectively targeting and implementing social sector investments, and broader economic and political factors can also influence growth outcomes.
To sum up Social sector expenditure in India has played a vital role in improving social and economic indicators, contributing to the country's transformation both domestically and globally. While broadly in line with international standards, continued efforts are needed to enhance the effectiveness of investments in social welfare and human development. State-wise variations in the impact of social sector expenditure highlight the importance of context-specific policies and implementation strategies. Investments in healthcare, education, and social welfare remain critical to long¬term economic growth and development across India.
Significance of Social & Economic Progress
The extant literature in macroeconomics has underscored the significance of both social and economic progress in the economic development of a nation [1,2]. India has shown immense interest in the development of both sectors as they contribute significantly to economic growth. Over the past several decades, India’s development expenditure as a percentage of total spending has remained around 60% of the total expenditure (Figure 1). While social development expenditure increased from 28% in 1975 to 35% in 2019, economic sector expenditure has remained steady at around 30% of total spending.
In terms of GDP, developmental outlays grew from merely 1% of GDP during 1985-1986 to 17% of GDP in 2021-2022. Similarly, social sector spending increased from 0.27% of GDP in 1985- 1986 to 9.58% of GDP in 2021-2022. The increasing trend in social and economic sector expenditure highlights the critical role these investments play in fostering overall economic development. Social sector investments in areas such as education, healthcare, and social welfare improve human capital, labor productivity, and social stability, which are essential for sustained economic growth. On the other hand, economic sector investments in infrastructure, industry, and technology drive economic expansion and development. India’s commitment to enhancing social and economic progress is evident from the substantial increase in development expenditure over the years. This trend signifies the recognition of the intertwined nature of social and economic development in achieving long-term economic growth and improved living standards for the population.
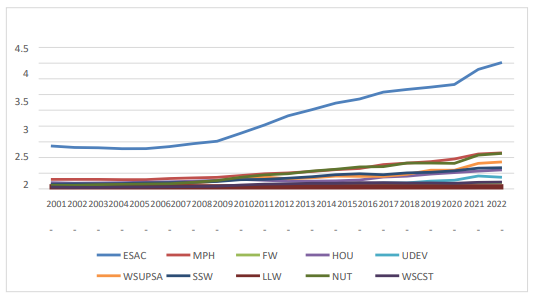
Figure 1: Composite Expenditure of State and Central Governments as % of Total Expenditures
Identification of Social Sectors and Their Economic Linkages: This paper has identified ten key social sectors:
• Education, Sports, Art, and Culture (EASC);
• Medical and Public Health (MPH);
• Family Welfare (FW);
• Water Supply and Sanitation (WSUPSA);
• Housing (HOU);
• Urban Development (UDEV);
• Welfare of Scheduled Castes, Scheduled Tribes, and Other Backward Classes (WSCST);
• Labor and Labour Welfare (LLW);
• Social Security and Welfare (SSW);
• Nutrition (NUT).
The focus of this paper is on sector-specific spending within these ten sectors and its causal linkage with economic growth. Among these, education sector spending is the highest, accounting for 4% of GDP, while spending on the other sectors ranges from 0.5% to 1% of GDP (Table 1).
|
Year |
ESAC |
MPH |
FW |
HOU |
UDEV |
WSUPSA |
SSW |
LLW |
NUT |
WSCST |
|
2002 - 2003 |
1.367 |
0.306 |
0.055 |
0.196 |
0.041 |
0.069 |
0.150 |
0.028 |
0.114 |
0.057 |
|
2003 - 2004 |
1.314 |
0.299 |
0.055 |
0.181 |
0.039 |
0.079 |
0.159 |
0.025 |
0.112 |
0.050 |
|
2004 - 2005 |
1.312 |
0.299 |
0.051 |
0.192 |
0.044 |
0.085 |
0.164 |
0.025 |
0.132 |
0.048 |
|
2005 - 2006 |
1.279 |
0.296 |
0.049 |
0.198 |
0.046 |
0.113 |
0.167 |
0.027 |
0.143 |
0.056 |
|
2006 - 2007 |
1.284 |
0.296 |
0.046 |
0.221 |
0.052 |
0.121 |
0.185 |
0.027 |
0.149 |
0.059 |
|
2007 - 2008 |
1.350 |
0.326 |
0.047 |
0.231 |
0.046 |
0.118 |
0.198 |
0.028 |
0.160 |
0.068 |
|
2008 - 2009 |
1.439 |
0.349 |
0.048 |
0.241 |
0.060 |
0.176 |
0.211 |
0.039 |
0.206 |
0.076 |
|
2009 - 2010 |
1.513 |
0.368 |
0.052 |
0.278 |
0.073 |
0.242 |
0.239 |
0.034 |
0.263 |
0.090 |
|
2010 - 2011 |
1.774 |
0.420 |
0.064 |
0.305 |
0.100 |
0.365 |
0.289 |
0.040 |
0.367 |
0.119 |
|
2011 - 2012 |
2.037 |
0.478 |
0.076 |
0.270 |
0.089 |
0.378 |
0.301 |
0.044 |
0.440 |
0.147 |
|
2012 - 2013 |
2.321 |
0.510 |
0.082 |
0.245 |
0.114 |
0.323 |
0.339 |
0.049 |
0.481 |
0.162 |
|
2013 - 2014 |
2.526 |
0.560 |
0.088 |
0.248 |
0.113 |
0.346 |
0.390 |
0.050 |
0.567 |
0.180 |
|
2014 - 2015 |
2.726 |
0.616 |
0.104 |
0.259 |
0.141 |
0.406 |
0.448 |
0.064 |
0.620 |
0.184 |
|
2015 - 2016 |
2.866 |
0.653 |
0.106 |
0.288 |
0.140 |
0.398 |
0.478 |
0.071 |
0.693 |
0.200 |
|
2016 - 2017 |
3.079 |
0.770 |
0.147 |
0.373 |
0.190 |
0.394 |
0.455 |
0.071 |
0.710 |
0.194 |
|
2017 - 2018 |
3.167 |
0.821 |
0.147 |
0.404 |
0.192 |
0.463 |
0.512 |
0.062 |
0.821 |
0.190 |
|
2018 - 2019 |
3.239 |
0.870 |
0.147 |
0.471 |
0.242 |
0.598 |
0.532 |
0.061 |
0.821 |
0.185 |
|
2019 - 2020 |
3.324 |
0.952 |
0.159 |
0.515 |
0.277 |
0.593 |
0.577 |
0.070 |
0.807 |
0.178 |
|
2020 - 2021 |
3.803 |
1.115 |
0.185 |
0.570 |
0.409 |
0.814 |
0.657 |
0.092 |
1.078 |
0.206 |
|
2021 - 2022 |
4.021 |
1.145 |
0.195 |
0.605 |
0.364 |
0.856 |
0.673 |
0.106 |
1.129 |
0.216 |
Table 1: Social Sector Expenditure of India as% of GDP
Government Commitment to Social Sector Development: Although India is the fifth largest economy globally, a significant portion of its population still relies on government provision of essential services. According to the Economic Survey 2020-21, "The government is committed to investing in social sectors such as education, healthcare, skill development, employment opportunities, housing, and sanitation to bring overall improvement in socio-economic indicators and achieve SDGs" (Volume 2, pp. 361). This underscores the Indian government's commitment to developing the masses and fulfilling social obligations by addressing issues like illiteracy, malnutrition, poverty, and unemployment through resource allocation to meet societal needs.
To uplift the quality of life of its citizens, the Indian government has initiated the establishment of the Social Stock Exchange (SSE), aimed at channeling more resources into the social sector. The inclusion of Corporate Social Responsibility (CSR) funds, mandated at 2-3% of companies' profits by the Companies Act 2013, has further bolstered social sector spending. The SSE panel and the Securities Exchange Board of India (SEBI) are currently formulating guidelines to help the government identify priority sectors and focus developmental policies on them.
To achieve the Sustainable Development Goals (SDGs) by 2030, India is actively attracting investments in social sector impact bonds and green bonds, making funds available for social sector development. Paper Organization:
Section 4: Theoretical background and perspective on social sector spending.
Section 5: Literature review.
Section 6: Data and methods.
Section 7: Results and discussion.
Section 8: Conclusion.
Section 9 : Recommendations for Enhancing Social Sector Investment in India.
Theoretical Perspective
Human Resource Development Approach
This approach posits that social sectors enhance human capital, defined as "the stock of skills and productive knowledge embodied in people." It refers to economic agents who can generate income. Proponents of this theory, such as emphasize that human capital formation occurs when individuals invest in education, health, on-the-job training, and job market information. Investments in sectors like education, health, and labor welfare improve labor force productivity and are justified for two main reasons [3,4]. Increased Financial Return: Education spending leads to a higher per capita income.
Improved Firm-Level Productivity: Better health enhances productivity at the firm level.
Human development has been considered an alternative approach to social development. According to the United Nations Development Program (UNDP), human development is "the process of enlarging people's choices and focuses on the state of existence of people, including empowerment, cooperation, equity in basic capabilities and opportunities, sustainability, and security." This approach emphasizes improving individuals' basic capabilities through education, health, and nutrition.
To sum up, while the human development approach views human beings as ends in themselves, the human resource development approach focuses on the means, i.e., the productivity aspects of human beings. A commonality between the two concepts is that human resource development provides the precondition for human development, which, in turn, contributes to economic growth.
Social and Economic Development
To understand the impact of social sector spending on economic development, it is essential to highlight the outcomes of social expenditure in the form of social development. The UNDP defines social development as "sustainable human development which enhances human capabilities for enlarging human choices." It comprises three main aspects: social services, social transfers, and social integration.
Social Services: These include health and education services.
Social Transfers: This entails social security, livelihood generation, and remunerative employment.
Social Integration: This aspect focuses on reducing violence through peace initiatives.
Street (1981) and Ghai (2000) confirm that strong leadership committed to social service provision, robust state capacity, infrastructure, and the state's central role in providing social services, along with the composition of social spending (especially on primary education and healthcare), are key factors in determining social development [5,6].
Social development is viewed as a process of transformation in values, institutions, and practices, driven by deliberate policy and planning with the active involvement of concerned people to raise their living standards and quality of life. Economic development, on the other hand, refers to the increase in per capita income, per capita value-added, and other economic indicators of a country's citizens.
Literature Review
The literature reveals mixed evidence on the relationship between public expenditure and economic development. Public spending in the social sector influences development by fostering socially inclusive, healthy, and economically robust societies, thereby enhancing productivity [1,2,7-14]. Contrarily, a negative causal relationship between state spending on education and health and economic development in African nations is observed, primarily due to corruption, bureaucratic inefficiencies, and underinvestment found no relationship between social sector expenditure and economic growth [15,16].
Education and health are the primary components of social sector spending. For example, Gupta and compared the efficiency of education and health spending in 37 African countries with those in Asia, Europe, and America, finding significant inefficiencies in African nations due to high government wages and suboptimal intra-sectoral resource allocation, unrelated to private spending [17]. highlighted that improved access to schools and reduced child mortality were key concerns for the Indian government, prompting substantial investment in education and health sectors [18].
Public expenditure on healthcare protects against health hazards such as malnutrition and infant and maternal mortality, improves the quality of life, and develops human resources [8,19,20]. Argue that public expenditure on transport and communication accelerates economic growth by facilitating socio-economic activities [21,22]. Improved sanitation and clean drinking water supply also yield significant health and productivity benefits [23,24]. Public expenditure on social security enhances the educational and health conditions of vulnerable sections, improving their living standards [25, 26]. Thus, public expenditure on education, health, and basic economic infrastructure fosters a harmonious relationship between social and private interests, enhancing labor productivity and contributing to overall economic development.
Regarding the cyclicality of social spending, examined economic growth and social sector spending in middle-income economies, finding that education expenditure is acyclical while health spending is pro-cyclical [27]. In contrast, in high-income countries, spending on education and health is counter-cyclical. Compared developed and emerging countries, finding that social spending on education and health is procyclical in developing countries and cyclical in developed ones, with health and education spending being procyclical during good times and cyclical during bad times [28].
Emphasized the importance of skilled individuals for sustainable economic and social progress, while demonstrated that education spending is crucial for per capita income growth [29,30].Used regressions to show the significance of an educated labor force for economic efficiency and growth, particularly higher education in developed countries [31]. Found a significant causal relationship between economic growth and human resource development, highlighting the importance of education for economic progress [32].
Supported such policies theoretically, while claimed that educational achievement enhances efficiency and global competitiveness [33,34]. Stressed the need for India to double higher education enrolment to sustain economic growth, warning of potential demographic catastrophe without adequate educational facilities [35]. Noted that developed countries spend a higher proportion of GDP on education while developing nations need to improve resource allocation for education [36]. Showed that increased education expenditure enhances economic growth in 79 countries [37].
Argued that a country's institutional structure determines whether education investments significantly affect growth [38]. Recommended free education up to graduation level in India to improve human resource development, warning that insufficient investment in youth could turn a demographic dividend into a liability [36]. Estimated income elasticity for education and health outlay, emphasizing the role of education in promoting economic growth. Projected that India's workforce will grow significantly, potentially overtaking China's economic growth by 2030 with adequate human capital investment [40]. Found a long-term relationship between education expenditure and economic growth in 14 major Asian countries [41].
Suggested that while basic education in China built a large low-skill labor force, future growth requires more investment in human capital [42]. The human capital theory explains the role of education in productivity, while the signaling theory sees education as an indicator of worker ability. Found low education levels in disadvantaged social groups in India, advocating for improved access to formal education to enhance labor productivity and signal worker ability [43]. Access to formal education is crucial for economic growth through human resource development.
Data and Method
The study employs annual time series data on ten social sector expenditure and economic development variables, including gross domestic product (GDP) and per capita income, spanning the period from 1972-73 to 2021-2022 for India (refer to Table 2). Specifically, the study examines expenditure on the following sectors: education; sports, art, and culture; medical and public health; family welfare; water supply and sanitation; housing; urban development; the welfare of scheduled castes, scheduled tribes, and other backward classes; labor and labor welfare; social security and welfare; and nutrition. Data for this analysis are sourced from the EPWRF database.
|
GDPPC |
Per Capita Gross Domestic Product |
|
ESAC |
Education, Sports, Art, and Culture |
|
MPH |
Medical and Public Health |
|
FW |
Family Welfare |
|
WSUPSA |
Water Supply and Sanitation |
|
HOU |
Housing |
|
UDEV |
Urban Development |
|
WSCST |
The welfare of Scheduled Caste, Scheduled Tribes and OBC |
|
LLW |
Labor and Labour Welfare |
|
SSW |
Social Security and Welfare |
|
NUT |
Nutrition |
Table 2: List of Variables
A battery of econometric techniques for determining the causal relationship between social sector expenditure and economic development in India. The Augmented Dickey-Fuller (ADF) and Phillips Perron (PP) unit root test to test the stationarity. The ADF test is as follows:
DYt = a0 + a1t + a2Yt -1 + åa j DYt - j + et (1)
The null hypothesis i.e. has a unit root, is rejected when the absolute ADF test value is higher than the critical value. It implies that the coefficient is significantly other than zero and thus is stationary or does not contain a unit root. On the other hand, the Phillips-Perron (PP) test is a modified Dickey-Fuller test that corrects autocorrelation and heteroskedasticity in the error term εt. One advantage of this test over conventional ADF is it selects lag length by itself. It is given by the following equation:
![]()
Next to determine the optimal lag length the VAR model was used. The optimal number of lag lengths (k) is selected by using the Akaike (AIC), Hannan and Quinn (HQIC), and Schwarz’s Bayesian (SIC) information criteria. Lutkepohl (1993) was followed to link the maximum lag lengths (max) and the number of endogenous variables in the system (m) to the sample size (T) using the formula m x kmax=T1/3. After estimating the optimal lag, we estimate the long-run relationship(s) between the variables included in vector Yt, where Yt includes several integrated series at the same level. The long-run relationships between the variables included in vector Yt are estimated using the Johansen Maximum Likelihood approach. Specifically, we denote Yt as a vector autoregressive process of order k (i.e., VAR(k))
Yt = A0 + Σ Ai Yt-i + μt …… (3)
Δ Yt = A0 + π Yt-I + Σ r i Yt-I + μt …….(4)
where Yt denotes a vector containing social sector expenditure variables and per capita GDP. To examine the long-run relationship(s) among variables under study, Johansen's (1988) test has been established to test for the existence of cointegration relationships among the eleven variables of the model (r<11) [45].
This is equivalent to testing the hypothesis that the rank of matrix M in Eq. (4) is at most r. Reduced-rank regression can then be used to form a likelihood ratio test of that hypothesis based on the so-called trace statistic, or the maximum eigenvalue statistic.
Next, to ascertain the direction of causal flows, we employ the Toda and Yamamoto (1995) causality test, as all series under consideration are found to be I [45]. The advantage of using this test is, it can be applied in any of the following cases i.e., the VARs may be stationary around a deterministic trend, integrated of any arbitrary order, or co-integrated of any arbitrary order. Although, it is like the conventional Granger causality test but has one superior property i.e., with extra lags depending on the maximum order of integration of the series under consideration augments the results. In this approach, we construct a vector-autoregressive model (VAR) in their levels with a total of (k+dmax) lags, where k is the optimal number of lagged terms included which is determined by AIC / SIC criteria. Thus, if k = 1 and if two series yt and xt have different orders of integration, viz., I (0) and I (1) respectively so that dmax =1, then one extra lag is added to each variable. Thus a VAR with two lags is constructed and we conduct a Wald test which follows an asymptotic χ2 distribution and is applied if the series under consideration are I (0), I (1), or I (2). It can be also considered even if the series is non-cointegrated and/or the stability and rank conditions are not satisfied, provided “the order of integration of the process does not exceed the true lag length of the model” [45].
Results and Discussions
The results of the Augmented Dickey-Fuller (ADF) and Phillips-Perron (PP) tests, as presented in Table 3, affirm the non-stationarity of the study variables at their levels. Both tests fail to reject the null hypothesis of a unit root, indicating non-stationarity. Consequently, the variables were examined at a higher order of differencing. Upon applying first differencing to the variables, the unit root tests reject the null hypothesis at the specified level of significance, indicating that the variables achieve stationarity at the first difference. Thus, the study identifies these variables as integrated of order one.
With the variables now stationary in their first differences, the study proceeds to conduct the Johansen Cointegration Test, the results of which are detailed in Table 4. The trace statistics and maximum eigenvalues indicate a long-run relationship between the social sector expenditure variables and GDP per capita. This finding supports the study's principal objective of investigating the hypothesized causality between public expenditure across various social sectors and per capita GDP
|
|
ADF Test |
PP TEST |
Order of Integration |
||
|
Level |
1st Diff |
Level |
1st Diff |
||
|
GDP |
6.25 |
-3.47** |
10.68 |
-3.36*** |
I(1) |
|
GDPPC |
1.17 |
-3.24** |
6.34 |
-4.17* |
I(1) |
|
ESAC |
9.09 |
-6.26* |
10.13 |
-5.17* |
I(1) |
|
MPH |
11.76 |
-3.74** |
6.74 |
-8.24* |
I(1) |
|
FW |
4.93 |
-4.94* |
10.17 |
-5.01* |
I(1) |
|
HOU |
11.27 |
-4.92* |
3.18 |
-6.89* |
I(1) |
|
UDEV |
6.06 |
-6.01* |
6.49 |
-5.83* |
I(1) |
|
WSUPSA |
0.36 |
-10.74* |
6.44 |
-3.25** |
I(1) |
|
SSW |
7.84 |
-4.91* |
8.59 |
-5.90* |
I(1) |
|
LLW |
3.26 |
-3.83** |
8.13 |
-3.67** |
I(1) |
|
NUT |
2.97 |
-4.76* |
2.46 |
-4.84* |
I(1) |
|
WSCST |
5.56 |
-3.95** |
6.61 |
-3.94** |
I(1) |
*, ** , *** denotes significance at 1%, 5% and 10% respectively
Table 3: Unit Root Test
|
Null Hypothesis |
Trace Stat |
5% critical value |
Max Eigen Value |
5% critical value |
|
Ho: r ≤ 0 |
1270.56 |
334.98 |
283.23 |
76.58 |
|
Ho: r ≤ 1 |
996.32 |
285.14 |
234.70 |
70.54 |
|
Ho: r ≤ 2 |
764.63 |
239.24 |
197.68 |
64.50 |
|
Ho: r ≤ 3 |
566.94 |
197.37 |
165.67 |
58.43 |
|
Ho: r ≤ 4 |
397.28 |
159.53 |
113.96 |
52.36 |
|
Ho: r ≤ 5 |
278.32 |
125.62 |
87.9 |
46.23 |
|
Ho: r ≤ 6 |
193.39 |
95.75 |
71.5 |
40.08 |
|
Ho: r ≤ 7 |
111.86 |
69.82 |
57.1 |
33.88 |
|
Ho: r ≤ 8 |
62.69 |
47.86 |
32.5 |
27.58 |
Author’s Estimation
Table 4: Johansen Cointegration Test
Table 5 Presents the Outcomes of the Toda and Yamamoto Causality Tests
The findings reveal a bi-directional causality between per capita GDP and expenditure on education. This underscores India's substantial increase in education spending, rising from 1% of GDP in 2000 to over 4% of GDP by 2019, reflecting the recognized role of education in fostering economic growth. This surge has enhanced the education sector by improving school accessibility, enhancing teacher training, integrating modern technology into classrooms, and providing students with enhanced learning resources, as similarly documented by Sutherland et al. (2010) [46].
Additionally, the study identifies a unidirectional causal relationship between health expenditure to per capita GDP, indicating that improving and safeguarding the health of the populace contributes to economic growth. Despite India's accelerated economic expansion in recent decades, the growth rate of health expenditure has not kept pace, increasing from 0.36% of GDP in 2000 to 1.145% of GDP in 2021-22.
|
|
F-stat |
Prob |
|
GDPPC - ESAC |
2.52 |
0.09 |
|
ESAC- GDPPC |
17.94 |
0.00 |
|
GDPPC - MPH |
0.31 |
0.67 |
|
MPH- GDPPC |
13.55 |
0.00 |
|
GDPPC - FW |
3.77 |
0.04 |
|
FW- GDPPC |
13.92 |
0.00 |
|
GDPPC - HOU |
2.69 |
0.07 |
|
HOU- GDPPC |
25.98 |
0.00 |
|
GDPPC - UDEV |
5.78 |
0.01 |
|
UDEV- GDPPC |
6.31 |
0.00 |
|
GDPPC - WSUPSA |
6.15 |
0.00 |
|
WSUPSA - GDPPC |
5.06 |
0.01 |
|
GDPPC - SSW |
0.62 |
0.45 |
|
SSW - GDPPC |
10.19 |
0.00 |
|
GDPPC -LLW |
13.25 |
0.00 |
|
LLW- GDPPC |
21.60 |
0.00 |
|
GDPPC - NUT |
9.30 |
0.00 |
|
NUT - GDPPC |
5.26 |
0.03 |
|
GDP PC- WSCST |
2.11 |
0.09 |
|
WSCST - GDPPC |
11.12 |
0.00 |
Table 5: Toda and Yamamoto Causality Test
Expenditure on various social sector domains such as family welfare, housing, urban development, water supply, sanitation, nutrition, social security, welfare, labor welfare, and the welfare of scheduled castes and tribes exhibits bi-directional causality with GDP per capita, as indicated by the findings. This implies that the government's budgetary allocations in these areas are instrumental in improving citizens' quality of life and fostering social development, thereby catalyzing overall economic development.
The bi-directional causality also suggests that India's economic growth influences government expenditure on the social sector. As economic growth boosts individuals' income levels, it creates demand for enhanced social amenities, prompting the government to allocate resources accordingly [47-50].
Discussion & Conclusion
Investing in social sectors enhances labor force productivity, health, competitiveness, and efficiency, collectively contributing to higher economic growth. The pursuit of social sustainability is crucial for achieving sustainable growth, necessitating increased investment in human capital to extend life expectancy and cultivate a skilled workforce capable of supporting business activities. This approach also fosters innovation and entrepreneurship within the Indian economy, aligning with the findings of the World Development Report (WDR) 2013, which emphasizes the role of essential services like health and education in job creation and improving living standards through inclusive growth.
In the Indian context, development initiatives have increasingly prioritized the provisioning of social services since the advent of the Plan era. Despite a notable rise in the share of social sector expenditure within total plan expenditure, overall public sector spending on critical social sectors remains comparatively low by international standards. Currently, India allocates approximately 2.8% of GDP to education and 1.0% to healthcare, markedly lower than the European Union's expenditure of 5.5% on education and 7.5% on health from their general government accounts. For instance, Canada dedicates over 11% of GDP to healthcare and nearly 5% to education.
By 2030, India is projected to have the largest young population globally, intensifying the demand for education. This demographic trend necessitates higher budgetary allocations, ideally around 6% of GDP as recommended by national education policies and commissions, yet rarely exceeded 4%. Inadequate financial support jeopardizes human resource development in a labor-abundant nation, resulting in deficient education infrastructure that restricts access and compromises educational quality. Insufficient central government funding transforms education into a private good rather than a public one, impeding equitable access to education and healthcare.
Education and health are considered merit goods and should ideally be subsidized or provided free to ensure accessibility irrespective of financial capacity. Current disparities in access to education and healthcare persist due to financial barriers, contributing to India's lower Human Development Index (HDI). While India's education system is globally esteemed, its capacity falls short of meeting escalating demands, prompting concerns from policymakers, experts, academics, and researchers regarding both quality enhancement and the skill gap in the workforce.
This study examines the causal links between social sector expenditure and economic development in India from 1972-73 to 2020-2021, offering critical insights for effective resource allocation and policy formulation. The findings underscore significant bi-directional causal relationships between GDP per capita and expenditures across various sectors, underscoring the importance of optimal public expenditure management for advancing India's human development and poverty alleviation indices. Strategic enhancement of public expenditure remains imperative for fostering sustainable economic growth and improving societal well-being in India.
Recommendations for Enhancing Social Sector Investment in India.
Increase Budget Allocations
Education: Raise the budgetary allocation to at least 6% of GDP by 2030, aligning with national education policies and commissions' recommendations. This will help address the demand from India's projected largest young population globally. Healthcare: Elevate healthcare spending to match international standards, aiming for a minimum of 5% of GDP to ensure comprehensive health services for all citizens.
Policy Implementation and Monitoring
Establish robust frameworks for monitoring the allocation and utilization of funds in education and healthcare to ensure transparency and efficiency. Develop and implement policies that specifically target underserved regions and communities, ensuring equitable access to social services.
Public-Private Partnerships (PPPs)
Encourage PPPs to bridge funding gaps and enhance service delivery in the education and healthcare sectors. Leverage private sector expertise and innovation to improve infrastructure, technological integration, and overall quality of services.
Focus on Human Capital Development
Invest in teacher training programs, curriculum development, and educational technology to improve the quality of education. Strengthen healthcare infrastructure, including primary care facilities, hospitals, and specialized health services, to improve overall health outcomes.
Addressing Skill Gaps and Promoting Entrepreneurship
Implement vocational training programs and skill development initiatives to bridge the gap between education and employment, aligning with industry needs. Support entrepreneurship through funding, mentorship programs, and incubation centers, fostering innovation and economic diversification. 9.6. Subsidies and Free Provision of Merit Goods Ensure that education and healthcare are subsidized or provided free of charge to guarantee access for all, regardless of financial capacity. Develop targeted subsidy programs for disadvantaged groups to promote inclusivity and reduce disparities.
Utilize International Benchmarks
Regularly compare India's social sector spending and outcomes with international benchmarks to identify areas for improvement and adopt best practices.
Collaborate with international organizations and institutions to gain insights and support for policy development and implementation.
Strengthen Data Collection and Research
Enhance data collection mechanisms to gather comprehensive and accurate information on social sector performance. Promote research and studies on the impact of social sector investments on economic growth and human development, using findings to inform policy decisions.
Community Engagement and Awareness
Increase public awareness about the importance of education and healthcare investments for long-term economic growth and societal well-being. Engage communities in the planning and implementation processes to ensure that interventions are contextually relevant and widely accepted.
Long-Term Strategic Planning
Develop and implement long-term strategic plans for social sector development, with clear goals, timelines, and accountability mechanisms.
Regularly review and adjust strategies based on emerging trends, demographic changes, and economic conditions to ensure sustained progress.
Implementing these recommendations will help India achieve higher economic growth by enhancing labor force productivity, health, and competitiveness through strategic investment in social sectors.
References
- Sen, T. K., & Karmakar, K. (2007). Reprioritisation of public expenditure for human development. Publications Unit, National Institute of Public Finance and Policy.
- Dev, S. M., & Ravi, C. (2007). Poverty and inequality: All-India and states, 1983-2005. Economic and Political weekly, 509-521.
- Schultz, T. W. (1961). Investment in human capital. The American economic review, 51(1), 1-17.
- Becker, S., & Green, D. (1962). Budgeting and employee behavior. The journal of Business, 35(4), 392-402.
- Streeten, P. (1981). Development ideas in historical perspective. In Development perspectives (pp. 100-132). London: Palgrave Macmillan UK.
- Ghai, D. (2000). Social development and public policy: Some lessons from successful experiences. In Social development and public policy: A study of some successful experiences (pp. 1-45). London: Palgrave Macmillan UK.
- Mundle, S. (1998). Financing human development: some lessons from advanced Asian countries. World Development, 26(4), 659-672.
- Arora, S. (2001). Health, human productivity, and long-term economic growth. The Journal of Economic History, 61(3), 699-749.
- Guha, A., & Chakraborty, D. (2003). Relative positions of human development index across Indian States: some exploratory results. Artha Beekshan, 11(4), 166-181.
- Majumder, R. (2004). Human development in India: Regional pattern and policy issues.
- KP, K., & Pillai N, V. (2007). Social security in India: The long lane treaded and the longer road ahead towards universalization.
- Sinha, J. K. (2019). Influence of technologies on the growth rate of GDP from agriculture: A case study of sustaining economic growth of the agriculture sector in Bihar. Statistical Journal of the IAOS, 35(2), 277-287.
- Sinha, J. K. (2022). Economic impact of unemployment and inflation on output growth in Bihar during 1990–2019. Statistical Journal of the IAOS, 38(1), 309-318.
- Sinha, J. K. An investigation into the convergence of economic growth among Indian States and the path ahead. Statistical Journal of the IAOS, (Preprint), 1-12.
- Eggoh, J., Houeninvo, H., & Sossou, G. A. (2015). Education, health and economic growth in African countries. Journal of Economic Development, 40(1), 93.
- Kormendi, R. C., & Meguire, P. G. (1985). Macroeconomic determinants of growth: cross-country evidence. Journal of Monetary economics, 16(2), 141-163.
- Gupta, S., & Verhoeven, M. (2001). The efficiency of government expenditure: experiences from Africa. Journal of policy modeling, 23(4), 433-467.
- Gupta, S., Verhoeven, M., & Tiongson, E. R. (2002). The effectiveness of government spending on education and health care in developing and transition economies. European Journal of Political Economy, 18(4), 717-737.
- Bloom, D. E., & Canning, D. (2005). Health and economic growth: Reconciling the micro and macro evidence. Working Papers, 42. Centre on Democracy, Development and the Rule of Law. Stanford University.
- Majhi, H., & Mallick, M. (2018). Health infrastructure development in tribal districts of Odisha: An analysis. Orissa Economic Journal, 50(1-2), 128-134.
- Esfahani, H. S., & Ramirez, M. T. (2003). Institutions, infrastructure, and economic growth. Journal of development Economics, 70(2), 443-477.
- Floud, R., Fogel, R. W., Harris, B., & Hong, S. C. (2011). The changing body: health, nutrition, and human development in the western world since 1700. Cambridge University Press.
- Purohit, B. (2014). Eficiency of social sector expenditure in India. Routledge.
- Pattayat, S. S., & Rani, P. (2017). Social sector development and economic growth in Haryana. Journal of Economics and Economic Education Research, 18(3), 1-13.
- Ohlan, R. (2013). Pattern of regional disparities in socioeconomic development in India: District level analysis. Social indicators research, 114, 841-873.
- Sen, V., & Sahoo, R. K. (2017). Agriculture Labuor and Social Security Policies in Dhenekal District of Odisha-It's International Ramifications. Journal of International Economics, 8(1), 81-96.
- Doytch, N., Hu, B., & Mendoza, R. U. (2010). Social spending, fiscal space and governance: An analysis of patterns over the business cycle. UNICEF Policy and Practice, second draft.
- del Granado, J. A., Gupta, S., & Hajdenberg, A. (2013). Is social spending procyclical? Evidence for developing countries. World Development, 42, 16-27.
- Lucas Jr, R. E. (1988). On the mechanics of economic development. Journal of monetary economics, 22(1), 3-42.
- Becker, G. S., Murphy, K. M., & Tamura, R. (1990). Human capital, fertility, and economic growth. Journal of political economy, 98(5, Part 2), S12-S37.
- Blundell, R., Dearden, L., Meghir, C., & Sianesi, B. (1999). Human capital investment: the returns from education and training to the individual, the firm and the economy. Fiscal studies, 20(1), 1-23.
- Ranis, G., Stewart, F., & Ramirez, A. (2000). Economic growth and human development. World development, 28(2), 197-219.
- Pissarides, C. A. (2000). Human capital and growth: a synthesis report.
- Douglass, J. A. (2010). Higher education budgets and the global recession: Tracking varied national responses and their consequences.
- Dukkipati, U. (2010). Higher education in India: Sustaining long-term growth. South Asia Monitor, 141(01).
- Bhatia, K., & Dash, M. K. (2011). A demand of value based higher education system in India: A comparative study. Journal of public Administration and policy Research, 3(5), 156.
- Musai, M., Mehrara, M., & Fakhr, S. G. (2011). Relationship between education and economic growth (international comparison). European Journal of Economics, Finance and Administrative Sciences, 29, 26-32.
- Dastidar, S. G., Mohan, S., & Chatterji, M. (2012). The relationship between public education expenditure and economic growth: The case of India (No. 273). Economic Studies, University of Dundee.
- Shi MeiLing, S. M. (2014). Empirical analysis on the relationship between human capital investment and economic growth in rural areas: based on the data of Henan.
- Mehdi, A., & Chaudhry, D. (2015). Human capital potential of India's future workforce (No. 308). Working Paper.
- Mallick, L., Das, P. K., & Pradhan, K. C. (2016). Impact of educational expenditure on economic growth in major Asian countries: Evidence from econometric analysis. Theoretical and applied economics, 2(607), 173-186.
- Li, H., Loyalka, P., Rozelle, S., & Wu, B. (2017). Human capital and China’s future growth. Journal of Economic Perspectives, 31(1), 25-48.
- Unni, J., & Sarkar, S. (2012). Education and Employment: Do the education level/skills of our youth match relevant jobs?. Institute of Rural Management, Anand.
- Johansen, S. (1988). Statistical analysis of cointegration vectors. Journal of economic dynamics and control, 12(2-3), 231-254.
- Toda, H. Y., & Yamamoto, T. (1995). Statistical inference in vector autoregressions with possibly integrated processes. Journal of econometrics, 66(1-2), 225-250.
- Sutherland, D., Price, R., & Gonand, E. (2010). Improving public spending efficiency in primary and secondary education. OECD Journal: Economic Studies, 2009(1), 1-30.
- Sinha, J.K . (2024a): Deciphering the Mysteries of India’s Economic Slowdown: A Deep Dive into the Root Causes. Philosophy International Journal. Vol.7 (2); pp. 1-8. 2024.
- Sinha, J.K.(2024b): "Unraveling the Enigma of the Indian Economic Slowdown: Exploring the Underlying Determinants”. Archives of Humanities & Social Sciences Research, Vol. 1 (2), pp.1-10.
- Schultz, T. W. (1961). Investment in human capital. The American economic review, 51(1), 1-17.
- Lütkepohl, H. (2013). Introduction to multiple time series analysis. Springer Science & Business Media.