
Journal of Geology & Mining(JGM)
ISSN: 3066-4950 | DOI: 10.33140/JGM


Research Article - (2024) Volume 1, Issue 1
Estimation of High-Resolution Digital Elevation Model (Dem) from SAR Data Over the Confluence Region of Nigeria
2Center for Geodesy and Geodynamics, Toro Bauchi State, Nigeria
Received Date: Nov 04, 2024 / Accepted Date: Dec 19, 2024 / Published Date: Dec 30, 2024
Copyright: ©©2024 Ahmadu A. A, et al. This is an open-access article distributed under the terms of the Creative Commons Attribution License, which permits unrestricted use, distribution, and reproduction in any medium, provided the original author and source are credited.
Citation: Ahmadu, A. A., Dodo, J. D., Abubakar N. O. (2024). Estimation of High-Resolution Digital Elevation Model (Dem) from SAR Data Over the Confluence Region of Nigeria. J Geol Min, 1(1), 01-10.
Abstract
Estimating a wide area high resolution digital elevation model (DEM) over the confluence region of Nigeria from sentinel- 1synthetic aperture radar (SAR) data is crucial. This study leveraged geospatial technology to gain critical insights into the region's hydrology, terrain information and characteristics. These components play a crucial role in estimating the surface roughness of terrains for flood control and mitigation efforts, enabling the identification of areas vulnerable to erosion, rapid runoff, potential floodplains and possible drainage basins. The implications of this research are significant because it provides precise data for flood modeling, early warning systems, urban planning, watershed management and different types of possibly agriculturally influenced activities that are viable in the Confluence region. The research captured elevation values ranging from 79.59 meters to 529.27 meters. These detailed digital elevation model data allowed for precise terrain analysis, facilitating the identification of flood-prone areas, elevation extremes, and drainage patterns. A contour map was also generated from the DEM data, featuring contour intervals of 100 meters, which provides a clear visualization of the region's topography. Furthermore, the study delved into the analysis of key hydrological components, including slope, aspect and flow direction. As floods become increasingly severe and exacerbated by climate variables, these findings provide a foundation for building resilient communities and sustainable flood mitigation measures. The results underscore the major role of geospatial technology in addressing hydrological challenges and emphasize the importance of data-driven decision- making for a more secure and sustainable future in the face of evolving climate patterns.
Keywords
Sentinel-1 SAR, Confluence Region, Dem, Contour, Elevation Extremes and Flow Direction
Introduction
The digital elevation model (DEM) is a widely used national geospatial infrastructure in many fields, such as topographic mapping, ocean monitoring, glacial evolution detection, smart city identification, global land change, hydrologic and geologic analyses, hazard monitoring, natural resource exploration and agricultural management. The quality of a DEM is the basis for these applications and is checked during every step of estimation, from the collection of elevations to the interpolation implemented for resampling [1]. Elevation maps are physical and tangible 3-D demonstrations of earth surface topography. DEMs are crucial in the determination of terrain attributes such as elevation at any point, slope and aspect. Terrain features such as drainage basins and channel networks can also be identified [2]. A high spatial resolution DEM with high accuracy and precision high elevations has numerous applications such as natural resource management, engineering, infrastructure projects, crisis management and risk analysis, archaeology, security, the aviation industry, forestry, energy management, surveying and topography, landslide monitoring, subsidence analysis, and spatial information systems [3]. DEMs, acquired by stereo imaging, LiDAR, and synthetic aperture radar (SAR) images, are ideal tools for representing the surface of the earth [4].
The launch of Sentinel-1 on 3rd April 2014 opened an era of accessible spaceborne radar imagery, and its potential has been demonstrated throughout all fields of application [5]. The European Copernicus Sentinel-1 (S-1) satellite mission, operated by the European Space Agency (ESA), provides a global, continuous, all-weather, day-and-night acquisition of synthetic aperture radar (SAR) imagery of the Earth’s surface, as it operates in the microwave component of the electromagnetic spectrum in the C-band frequency range (3.75 to 7.5 cm wavelength) [6]. Among all the data sources of geospatial information, digital elevation models (DEMs) hold special value because of their numerous applications. As an alternative to airborne measurements and optical imagery, spaceborne synthetic aperture radar (SAR) sensors are employed to measure the earth’s elevation [7]. These data are from sensors that are oriented in a pattern (side looking) providing perfect detail of the relief [8]. The valuable feature of Sentinel-1 (SAR) data is the ability to generate high-resolution DEMs.
The retrieval of height information has been acknowledged since the 1970s; however, its ability to perform topographic mapping based on stereoscopic methods applied to amplitudes, also called radargrammetry, has yielded images that are reportedly limited. Moreover, its full potential lies in the exploitation of phase information, which allows the measurement of topographic variation via radar interferometry (In SAR) [9]. Interferometric techniques have a wide variety of applications, such as topographic mapping, digital elevation modeling, classification of land surfaces, volcanic hazards and seismic events, and land subsidence monitoring [10].
Radar interferometry (RF) is an advanced technique adopted to produce digital elevation models (DEMs). The principle of DEM generation involves obtaining height values using interferometric phase information from two SLC images at different times and orbit positions. The advantages of using radar interferometry to generate. DEMs include the fact that the objects on the Earth’s surface are not distracted by cloud cover and that the acquired data can be used in both day and night mode. Exploring this topic is more important than obtaining a low-resolution DEM because it yields better and more reliable results. The confluence region of Nigeria has suffered a great deal of water hazard from two major rivers the Niger River and the Benue River. This study maps out the area vulnerable to risk analysis in the region and provides information that will facilitate infrastructural development through the generation of high-resolution DEMs, contour maps, map areas suitable for wind energy establishment and hydrological component maps around the study area. This study focused on exploiting SAR data and open-source software for image processing to increase the current knowledge on the potential of low-level plains along confluence regions and, in turn, to contribute to risk prevention and mitigation [11].
Image Selection Criteria for DEM Estimation
An important step for successful DEM generation is the selection of an image pair with suitable properties. Among others, favorable conditions include:
i. The temporal baseline, as it is influenced by the time between the first and the second image, must be kept as short as possible to reduce the risk of temporal decorrelation affecting the phase [12].
ii. The perpendicular baseline is affected by the distance between the satellites’ positions at the time of image acquisition, which should be between 150 and 300 meters. It would have an angle between both acquisitions that allows the retrieval topographic variations from parallax-like effects: targets of different heights are displaced relative to each other in the two images based on their altitude. A helpful tool to identify the baseline of two images and to find suitable image pairs is provided by the Alaska Satellite Facility: ASF Baseline tool.
iii. Atmospheric conditions: Conducive atmospheric conditions are also a major criterion because water vapor in the lower atmosphere causes phase delays and potentially decreases the quality of measurement. It is therefore advisable to select images acquired during dry season periods and to ensure that no rainfall occurs during both image acquisitions.

Figure 1.2: Image Geometry and Phase Decorrelation
Study Area
Nigeria is a tropical equatorial region located in western Africa bounded by Niger, Cameroon, Benin and the Atlantic coast. Nigeria lies between latitude 40 and 140 N and between longitudes 20 and 150 E (geographical alliance of lowa on 14 April 2009).
The confluence region lies within the geographical coordinates of Latitude 7020ÃÂ?¹27.25ÃÂ?ºN to 708ÃÂ?¹7.52ÃÂ?ºN and Longitude 6°05′43.36′′E to 7°52′8.64′′E. The North Central geopolitical zone is also referred to as the middle belt of Nigeria covering Kogi, part of FCT, part of Nasarawa and some part of Benue (https://en.m.wikipedia.org).
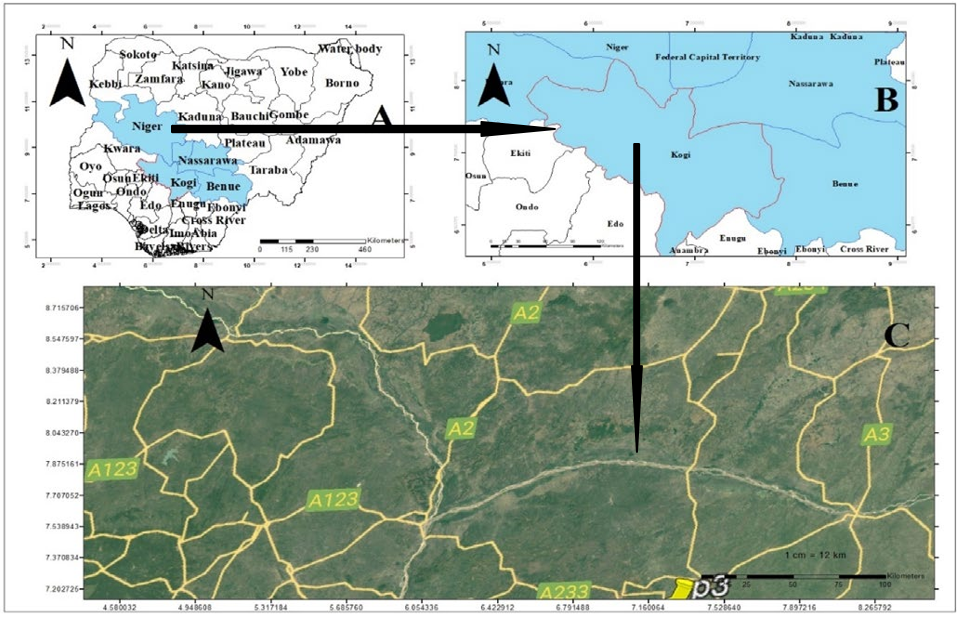
Figure 1.2: Map of the Study Area. a). Map of Nigeria Showing the Confluence Region. b). Confluence Region. c). Google Earth Image of The Confluence Region (source: author)
Materials and Method
Materials Used
Below are the materials using the project.
a. Quantum GIS (QGIS)
b. Sentinel Application Toolbox (SNAP) and SNAPHU
c. Google Earth pro
Data Set and Source
The following datasets were used during the course of this study.
i. The Nigerian shape file was obtained from the GADM database (www.gadm.org), version 2.5, July 2015.
ii. Satellite image of the study area obtained from Google Earth Pro
iii. SAR data from the Copernicus ESA iv. Precise orbit determination (POD)
|
S/N |
DATA TYPE |
DATA NAME |
DATA DATE |
DATA SOURCE |
|
1 |
Secondary data |
Google earth imagery |
2021 |
Google earth pro |
|
2 |
Secondary data |
Sentinel 1 (SLC) |
2019 |
ESA |
|
3 |
Secondary data |
Precise orbit data (POD) |
2019 |
ESA |
Table 3.1: Data Set and Source
|
File name |
DATA TYPE |
DATA NAME |
DATA DATE |
DATA SOURCE |
|
Type |
Acquisition |
Track |
Orbit |
Google earth pro |
|
S1A_IW_ SLC_1SDV_20190923T1745… |
SLC |
23Sep2019 |
30 |
29152 |
|
S1A_IW_SLC_1SDV_20190514T1745… |
SLC |
14May2019 |
30 |
27227 |
|
S1A_IW_SLC_1SDV_20190526T1745… |
SLC |
26May2019 |
30 |
27402 |
|
S1A_IW_SLC_1SDV_20190502T1745… |
SLC |
02May2019 |
30 |
27052 |
Table 3.2: Data Set Characteristics
Methods
This section presents the methodology adopted in this study. Figure 3.1 depicts the flow of the methodology. It is subjected to the following stages:
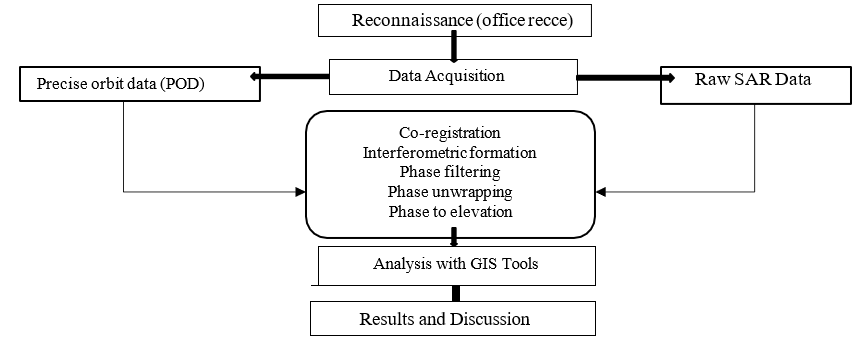
Figure 3.1: Methodology Flow Diagram
3.3 Data Analysis (Processing Steps)
I. Processing with the Sentinel Application Tool Box (SNAP) The processing was carried out with a sentinel application tool box (SNAP), an open-source software package developed by the European Space Agency (ESA), in the following steps: Co-registration
Co-registration of SAR images is a necessary and critical component of any interferometric processing chain for accurate estimation of phase differences through coarse fine resampling, which estimates the range and azimuth shift offset from multiple pairs and applications such as DEM generation and interferometric deformation analysis. The S-1 TOPS Split was applied to select the AOI for the analysis. Currently, each sub-swath is processed separately using image statistics to align both products at sub-pixel accuracy. To exploit the phase difference of the acquisitions, a stack containing both products was created. The test was performed individually and successively.

Figure 3.2: Stack Overview of the Dataset
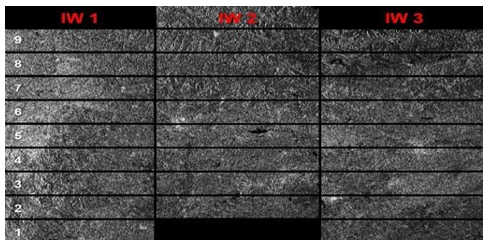
Figure 3.2: Interferometric Wide Swath IW1, IW2 and IW3 Levels of Bursts
Orbit auxiliary data containing the satellite position information acquisition were applied. The precise orbit determination (POD) service for Sentinel-1 provides precise orbit ephemerides (POEs). The POE files cover 28 hours with orbit state vectors at intervals of 10 seconds. They are generated one per day and are delivered within 20 days after data acquisition.
a) Interferogram Formation and Coherence Estimation
An interferogram is formed by cross multiplying the complex conjugate of the reference image with the complex conjugate of the secondary image. The amplitude of both images is multiplied, while the phase represents the phase difference between the two images. The interferometric phase of each SAR image pixel depends only on the difference in the travel paths from each of the two SARs to the considered resolution cell. Accordingly, the computed interferogram contains phase variation.
b) Phase Filtering
This process was performed to reduce noise to aid phase unwrapping. Goldstein filtering is adopted, and the interferometric fringes become smoother after filtering the peak in the spectrum (caused by the fringes), given a higher relative weight. Phase filtering greatly reduces the residue, and the phase unwrapping step enhances the phase unwrapping accuracy.
c) Phase Unwrapping
The ambiguity of phase measured modulo 2π faced by interferometric techniques for every pixel P limit access to the main value which is denoted by j(p)1. To determine the relief or movement field, it will be necessary to return to the exact phase value denoted by Φ(P). Such a stage is called phase unwrapping and consists of finding the right multiple k of 2π [13]:
F ( p) = j ( p) + 2k ( p)p
where j (p)Î [- p ,p ].
In two dimensions, the measure modulo 2π turns a continuous model into a network of fringes, the edges of which (brutal transitions from 0 to 2π) depend only on the origin of phases on the complex circle. In the range direction, each line in all sub- swaths with the same time tag merges adjacent sub-swaths; for the overlapping region in the range, merging is performed midway between sub-swaths, creating a wrapped interferogram stack, using the SNAPHU package to prepare the data for unwrapping. The unwrapping process was implemented outside of the SNAP using the command terminal.
d) Range Doppler Terrain Correction
Due to the topographic variation in the scene and the tilt of the satellite sensor, the distances are distorted in the SAR IMAGE dataset. Image data not directly at the sensor nadir location will have some distortion. Terrain corrections are intended to compensate for this distortion so that the geometric representation of the image will be as close as possible to the real world (Laur et al., 2004).

Figure 3.4: Terrain Correction (Source: Sentinel Application Tool Box)
After terrain correction, the generated DEM was reprojected to WGS 1984 zone 32N and was saved in Geotiff for further analysis. The DEM was also exported to Google Earth Pro to validate the exact extent of coverage and area of interest (AOI).
Maps Production using QGIS
a) Contour Map
Contours do not extend beyond the spatial extent of the raster, and they are not generated in areas with no data. The contour type is used to produce either contour lines or polygons. The DEMs generated in this study have raster with values between 65.3 and 524.69, and the contour interval is set to 100m. Value output feature classes were created and represented with different color regions. The generated DEM was used to create a contour map. A raster dataset was generated, and the x, y coordinate sets were computed using a raster computer and then exported to Excel. Afterwards, the surface (contour) was generated using the elevation data as the input file.
b) Slope Map
The slope range of values in the output depends on the type of measurement unit. In this study, the metric measurement is used for degrees, and the range of slope values is 0 to 90; for percent rise, the range is 0 to essentially infinity. A flat surface is 0 percent, a 45-degree surface is 100 percent, and as the surface becomes more vertical, the percent rise becomes increasingly larger. The input raster needs to be resampled, and the bilinear technique was adopted with the addition of DEM data.
c) Flow Direction
The generation of flow direction, which is quite similar to that of the formal (slope) DEM file, was used as the row data. The above steps constitute the conventional way of doing so, but in this study, the dataset was resampled to reduce the resolution and increase the cell size for proper visualization of each pixel. The resampled dataset was reclassified to properly arrange or change the value in the raster, and then the point to raster operation was carried out to identify which observer points were visible from each raster surface location. The basic component needed in this subset is the high-resolution DEM generated.
Results and Discussion
Results depicting high-resolution digital elevation model DEM data from SAR data using an interferometry approach over the confluence region are discussed. The study used open-source software (the sentinel application tool box SNAP) to co-register the raw SAR data and subsequently from interferogram fringes. The data were further processed by unwrapping the phase through an extra plugin called SNAPHU, which aids phase-to-elevation, in which the generated elevation was reprojected and saved to a suitable format.
Digital Elevation Model (DEM)


A: Google Earth environment B: GIS-extracted map to a suitable scale
Figure 4.1: Sentinel-1A Digital Elevation Model (DEM)
The utilization of digital elevation models (DEMs) derived from synthetic aperture radar (SAR) imagery has provided valuable insights into the region's terrain and numerous applications. The DEM generated from the sentinel-1 pixel was reprojected to geodetic coordinates at the WGS1984 datum projection and exported in KML format to be viewed in the Google Earth environment to check the validity of its spatial extent as shown. It was further saved as Geo. Tif for further analysis in the geospatial realm.
The generated digital elevation model (DEM) has a spatial resolution of 10 meters. This high-resolution DEM provides an intricate representation of the terrain, with elevation values ranging from 8.271 meters to 846.754 meters as the lowest and highest points, respectively. As shown in figure 4.1A and figure 4.1B, blue indicates places with lower elevations, and water bodies, such as tributaries, discharge of water channels into major rivers (the Niger River and the Benue River); brown areas also indicate areas with high elevations or higher elevations, as shown in figure 4.1A/B. This level of detail is crucial for accurate hydrological analyses and precisely identifies low-lying areas prone to flooding/ landslides and regions with elevated terrain that play a critical role in watershed delineation.
Contour Map

Figure 4.2: Contour Map
From the generated DEM, a contour map with contour intervals of100 meters is produced. Contour maps offer a visual representation of the terrain's elevation in a clear and interpretable manner. As the elevation values of this digital elevation model (DEM) range from 8.271 to 846.754 meters, the contour lines are placed at 0, 200, 400, 600 and 800 meters, which are the elevations throughout the extent of the image. This map provides a valuable tool for understanding the topography of confluence regions, aiding in the identification of potential floodplains, ridges, and valleys. It also assists in the delineation of drainage basins and channel networks. Contour lines are useful because they depict and show the shape of the land surface (topography) on a map.
Slope Map

Figure 4.3: Slope Map
Figure 4.3 shows the slope map with varying percentages for every color realm. Slope maps are able to identify or highlight mesoscale geological landforms, and slope maps can be used to highlight structural and sedimentological features. The slope information derived from the DEM allows the identification of areas with varying degrees of inclination. Steeper slopes are indicative of rapid runoff, which can contribute to increased surface runoff during heavy rainfall events. The navy-blue color indicates a gentle slope with a gradual increase in color to brown, which is the steepest region on the map. Understanding slope distribution aids in identifying areas susceptible to erosion and flash flooding.
Flow Direction Map
Flow direction analysis is akin to the "compass" of hydrological study as a guide to the intricate pathways that water follows across the region's diverse topography. To vividly portray these directions, the study utilized arrows as visual aids, highlighting the primary flow directions within the confluence state/region.
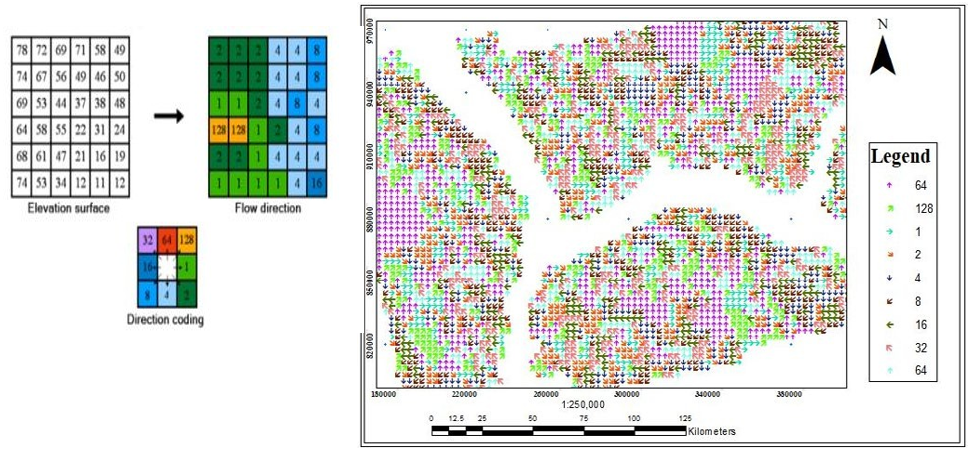
Figure 4.3.1: Flow Direction Visual Aid Arrow
Eastward flow (→) is shown in green. Numerous areas where water predominantly flows eastward were revealed. These regions often represent valleys and low-lying areas that direct runoff toward specific drainage basins or river systems. Predicting flood-prone/ landslide zones and identifying potential areas at high inundation risk are crucial.
Westward flow (←) is shown in navy blue. In contrast, some areas exhibit a concentrated westward flow pattern. These regions may include watersheds that ultimately feed into westward-flowing rivers or reservoirs. By identifying these flow directions, the study provides insights into the connectivity of surface water systems and can anticipate potential impacts downstream.
Northward flow (↑) is shown in red. Arrows pointing north signify areas where water primarily moves northward. These flow patterns are influenced by the local topography, including ridges and slopes that channel water toward northern watersheds. This approach is invaluable for understanding regional hydrological dynamics.
Southward flow (↓) is shown in sky blue. Similarly, southward- pointing arrows indicate regions where surface water predominantly flows south. These areas may encompass catchment zones that direct water toward southern rivers or lakes. Recognizing these southward flow patterns assists in evaluating potential flood routes and their implications.
Flowdirections are instrumental in delineating natural flow paths within the confluence region. These data can be used to identify potential drainage pathways, which are crucial for flood prediction and mitigation efforts. By visualizing flow direction with arrows, we not only gain a deep understanding of hydrological patterns but also equip decision makers with intuitive tools to assess flood/landslide vulnerability, plan infrastructure, and formulate sustainable water resource management strategies.
Summary of Findings
The resulting slope map provides a comprehensive understanding of the terrain inclination within the confluence region. Key findings from the slope map are as follows:
i. Steep slopes: Identified areas with steep slopes indicating potential zones of rapid runoff during rainfall, posing erosion and landslide risks; the study included fewer areas with steep slopes.
ii. Gentle slopes: Highlighted regions with gentle slopes are favorable for urban development and agriculture due to reduced erosion potential. According to the slope analysis, the total coverage area has a gentle slope; that is, most of the area is a low- elevation land plain.
iii. Moderate slopes: Shown regions with moderate slopes, striking a balance between runoff risk and land usability.
iv. Flow Direction: The analysis of flow direction demonstrates how surface water naturally flows across the landscape:
a) Primary Drainage Routes: Determine the main pathways through which water converges and flows; this process is essential for understanding the regional hydrological network.
b) Confluence Points: Identified areas where multiple flow paths converge, indicating significant drainage basins or river confluence regions. In this study, how water flows from various tributaries discharges into major rivers as it converges in Lokoja, Kogi State and flows continuously downward is clearly shown on the direction map.
c) Hydrological connectivity: This metric reflects the interconnect- edness of water bodies and aids in the assessment of water flow patterns and potential flood/landslide routes.
These findings collectively contribute to a comprehensive under- standing of the topographical and hydrological characteristics of the Confluence region. The insights gained are instrumental for ef- fective urban planning, flood risk assessment, and sustainable en- vironmental management strategies in the study area. In summary, the approach to flow direction aspect and slope analysis places a strong emphasis on the visual representation of hydrological path- ways.
Conclusion
Comprehensive analysis of DEM data derived from SAR imagery, along with contour maps and hydrological components, is valuable for addressing the pressing issue of flooding around study areas. As climate change continues to exacerbate hydrological challenges, these findings are essential for building resilient communities and sustainable flood mitigation measures. The estimation of 10-meter resolution DEMs, contour mapping, and detailed analysis of hydrological components, including slope and flow direction, have provided insight into the complex topography of the study area. The implications of this research are far-reaching and offer precise data for advanced flood modeling, urban planning, watershed management, and community engagement. This study provides a roadmap for sustainable flood mitigation and water resource management in the face of evolving climate patterns.
In summary, this study underscores the indispensable role of geospatial technology and data-driven decision-making in building resilient communities and safeguarding the environment. The insights presented herein could serve as a catalyst for informed policy decisions, proactive flood mitigation measures, and a more secure and sustainable future for the Confluence State of Nigeria [14-36].
Acknowledgement
The aim of this research was to determine the effectiveness of the ESA for accessing a freely available dataset and developing a sentinel application toolbox (SNAP) software. The study, however, also aimed to evaluate the tireless effort of the RUS Copernicus service in training activities. The effort of other freely available software and materials used in this study is highly appreciated. The use of Materials (Internet facility and computer) from Ahmadu Bello University (ABU), Zaria is also greatly appreciated. Other literature that serves as a guide by several authors found online is highly appreciated for making the study a reality.
References
- Zhou, G., Song, B., Liang, P., Xu, J., & Yue, T. (2022). Voids filling of DEM with multiattention generative adversarial network model. Remote Sensing, 14(5), 1206.
- Hayati, N., Kurniawan, A., & Taufik, M. (2015). RADAR INTERFEROMETRY APPLICATION FOR DIGITAL ELEVATION MODEL IN MOUNT BROMO, INDONESIA. Geoid, 10(2), 222-226.
- Amitrano, D., Martino, G. D., Iodice, A., Mitidieri, F., Papa, M. N., Riccio, D., & Ruello, G. (2014). Sentinel-1 for monitoring reservoirs: A performance analysis. Remote Sensing, 6(11), 10676-10693.
- Ghannadi, M. A., Alebooye, S., Izadi, M., & Moradi, A. (2022). A method for Sentinel-1 DEM outlier removal using 2-D Kalman filter. Geocarto International, 37(8), 2237-2251.
- Dai, K., Li, Z., Tomás, R., Liu, G., Yu, B., Wang, X., ... & Stockamp, J. (2016). Monitoring activity at the Daguangbao mega-landslide (China) using Sentinel-1 TOPS time series interferometry. Remote Sensing of Environment, 186, 501- 513.
- Matgen, P., Martinis, S., Wagner, W., Freeman, V., Zeil, P., & McCormick, N. (2020). Feasibility assessment of an automated, global, satellite-based flood-monitoring product for the Copernicus Emergency Management Service. Luxembourg: Publications Ofice of the European Union.
- Ghannadi, M. A., Enayati, H., & Khesali, E. (2017). Interferometric Sentinel-1 DEM generation: a case study in Tehran, Iran. In ISPRS Internatinal Joint Conference. Tehran, Iran: ISPRS.
- Balasubramanian, A. (2017). Digital elevation model (DEM) in GIS. University of Mysore.
- Braun, A. (2021). Retrieval of digital elevation models from Sentinel-1 radar data–open applications, techniques, and limitations. Open Geosciences, 13(1), 532-569.
- Nikolakopoulos, K., & Kyriou, A. (2015). Preliminary results of using Sentinel-1 SAR data for DSM generation. European Journal of Geography, 6(3), 52-68.
- Abubakar, A. A., Dodo, J. D., & Abubakar, N. O. (2024). Estimation of High-resolution Digital Elevation Model (DEM) From Sar Data Over the Confluence Region.
- Braun, A. (2020). DEM generation with Sentinel-1 Workflow and challenges. SkyWatch Space Applications Inc.: Waterloo, ON, Canada.
- Ferretti, A., Monti-Guarnieri, A., Prati, C., Rocca, F., & Massonet, D. (2007). InSAR principles-guidelines for SAR interferometry processing and interpretation (Vol. 19).
- Agbonkhese, O., Agbonkhese, E. G., Aka, E. O., Joe-Abaya, J., Ocholi, M., & Adekunle, A. (2014). Flood menace in Nigeria: impacts, remedial and management strategies.
- Arshad, S., Kazmi, J. H., Shaikh, S., Fatima, M., Faheem, Z., Asif, M., & Arshad, W. (2022). Geospatial assessment of early summer heatwaves, droughts, and their relationship with vegetation and soil moisture in the arid region of Southern Punjab, Pakistan. Journal of Water and Climate Change, 13(11), 4105-4129.
- Abubakar, A. A., Dodo, J. D., & Abubakar, N. O. (2024). Estimation of High-resolution Digital Elevation Model (DEM) From Sar Data Over the Confluence Region.
- Brouziyne, Y., Abouabdillah, A., Bouabid, R., & Benaabidate,L. (2018). SWAT streamflow modeling for hydrological components’ understanding within an agro-sylvo-pastoral watershed in Morocco. J. Mater. Environ. Sci, 9(1), 128-138.
- Abubakar, A. A., Dodo, J. D., & Abubakar, N. O. (2024). Estimation of High-resolution Digital Elevation Model (DEM) From Sar Data Over the Confluence Region.
- Do, H. T., Limet, S., & Melin, E. (2011). Parallel computing flow accumulation in large digital elevation models. Procedia Computer Science, 4, 2277-2286.
- Esteban, F. D., Tassone, A., Menichetti, M., & Lodolo,E. (2017). Application of slope maps as a complement of bathymetry: example from the SW Atlantic. Marine Geodesy, 40(1), 57-71.
- Hiremath, P. S., & Kodge, B. G. (2011). Generating contour lines using different elevation data file formats. arXiv preprint arXiv:1103.4914.
- Jacobsen, K. (2003). DEM generation from satellite data.EARSeL Ghent, 273276(4).
- Jenny, B., Stephen, D. M., Muehlenhaus, I., Marston, B. E., Sharma, R., Zhang, E., & Jenny, H. (2018). Design principles for origin-destination flow maps. Cartography and Geographic Information Science, 45(1), 62-75.
- Moothedan, A. J., Dhote, P. R., Thakur, P. K., Garg, V., Aggarwal, S. P., & Mohapatra, M. (2020, March). Automatic flood mapping using Sentinel-1 GRD SAR images and Google Earth Engine: a case study of Darbhangah, Bihar. In The Proceedings of National Seminar on ‘Recent Advances in Geospatial Technology & Applications (pp. 1-4).
- Hawker, L., Rougier, J., Neal, J., Bates, P., Archer, L., & Yamazaki, D. (2018). Implications of simulating global digital elevation models for flood inundation studies. Water resources research, 54(10), 7910-7928.
- Apicella, L., De Martino, M., & Quarati, A. (2022). Copernicus user uptake: From data to applications. ISPRS InternationalJournal of Geo-Information, 11(2), 121.
- Melvin, W. L., & Scheer, J. (2013). Principles of modern radar: advanced techniques.
- Oguaghamba, O. A., & Onyia, M. E. (2019). Gully erosion control in Nigeria: World Bank/NEWMAP perspective on hydrological data analysis. In Conference paper presented at University of Nigeria, Nsukka, Enugu.
- Pryde, J. K., Osorio, J., Wolfe, M. L., Heatwole, C. D., Benham, B. L., & Cardenas, A. (2007). Comparison of watershed boundaries derived from SRTM and ASTER digital elevation datasets and from a digitized topographic map.
- Panagoulia, D., & Dimou, G. (1998, April). Definitions and effects of droughts. In Proceedings of the conference on mediterranean water policy: building on existing experience, mediterranean water network, Valencia, Spain (Vol. 16).
- Perrou, T., Garioud, A., & Parcharidis, I. (2018). Use of Sentinel-1 imagery for flood management in a reservoir- regulated river basin. Frontiers of Earth Science, 12, 506-520.
- Xiao-Ping, R., Xue-Tao, Y., Jin, L., Muhammad Aqeel, A., & Xian-Feng, S. (2016). An algorithm for generation of DEMs from contour lines considering geomorphic features. Earth Sciences Research Journal, 20(2), 1-9.
- Scheer, J., & Holm, W. A. (2010). Principles of modern radar.
- Glade, T., & Alexander, D. E. (2013). Classification of naturaldisasters.
- Loissios, D., Tzelepis, N., & Nakos, B. (2021). A methodology for creating analytical hill-shading by combining different lighting directions.
- Zhou, Q. (2017). Digital elevation model and digital surface model. International Encyclopedia of Geography: People, the Earth, Environment and Technology, 1-17.