
Advancement in Dairy Science Research(ADSR)


Research Article - (2023) Volume 1, Issue 1
Determinants of Non-Oil Import in Nigeria from 1981 - 2016
Received Date: Oct 06, 2022 / Accepted Date: Oct 12, 2022 / Published Date: Jan 21, 2023
Copyright: ©©2023 Salisu Temitope Q. This is an open-access article distributed under the terms of the Creative Commons Attribution License, which permits unrestricted use, distribution, and reproduction in any medium, provided the original author and source are credited.
Citation: Salisu, T. Q. (2023). Determinants of Non-Oil Import in Nigeria from 1981
Abstract
This study investigated the determinant of non-oil import in Nigeria from 1981 – 2016 using Hechscher Ohlin theory. Different diagnostic test was carried out which include unit root test, co-integration test and Error correction model. The Augmented Dickey Fuller (ADF) and Philip-Peron unit root test was also carried out to check the long run and short run relationship of the variables. Co-integration test was carried out to determine if there is the existence of a long-run association between the variables. The ECM method was used to provide the relationship between the explanatory variables and the dependent variable. The ECM results revealed that factor abundance, gross domestic product and inflation are statistically significant while exchange rate and total reserve are statistically insignificant. Also, the result of the study revealed that all the explanatory variables are positively related to non-oil import in Nigeria except gross domestic product which is negatively related to non-oil import.
Keywords
Non-Oil Import Domestic Exchange Rate
Introduction
The importance of foreign trade in the development process has been of interest to development economists. Indeed, this has been stressed in the two-gap programming model developed by [1, 2]. Imports are a key part of international trade and are vital to eco- nomic growth. Both exports and imports of developing countries are subject to periodic fluctuations in the world market, and rev- enue from this source tends to oscillate [3]. Imports are goods or services brought into one country from another. Countries are most likely to import goods that domestic industries cannot produce as efficiently or cheaply. They may also import raw materials or com- modities that are not available within its borders but are required in industries for the production of finished goods and services. Im- ports and exports exert a profound influence on the consumer and the economy. These imports provide more choices to consumers. But when there is too much import in relation to exports it can dis- tort a nation’s balance of trade and devalue its currency. However, imports are a vital component of the economy. A high level of im- ports indicates robust domestic demand and a growing economy. Again, the expansion of domestic absorption which reveals supply inadequacies in the system, such that aggregate demand outweighs supply. To make up for the supply shortfalls and cut down on the surging inflationary consequences, Nigeria relied on imports, to the extent that imports as a component of total trade, particularly non-oil imports, have persistently been on a steady rise, resulting in deficits in Nigeria’s overall trade Balance of Payments, [4,6].
Nigeria is a developing country, whose imports are highly dom- inated with consumer goods. This may be due to the poor infra- structure, low level of technology and a high cost of business operation which are very detrimental to the manufacturers whose activities would boost the level of exports that in the long run boost economic growth and cause the exchange rate to appreciate. However, since the major components of imports in Nigeria as at 2015 were base metals, machinery and mechanical appliances, electrical equipment, vehicles, aircraft vessels and associated transport equipment which constitute 47.8% of the total expenditure on im- ports [7]. which could in the long run promote local production.
Imports are crucial part of external trade and the import of pro- ductive commodities specifically, is important for domestic investment and economic progress. Evidence available generally points out that most low-income countries and indeed Nigeria registered a continuous decline in their earnings from foreign exchange from the beginning of the 1980s and in recent years [8].
As a developing economy, Nigeria has had her own share of high nominal value of aggregate import over the years. This has been the order since independence in 1960, and has been made worse by the oil boom of the 1970s that gave rise to an increase in av- erage income, and subsequently increase in the demand for im- port. Evidence shows a concentration of these import volumes on the side of the non-oil sector, such that non-oil imports have over time been on a steady growth path. The nominal value of non- oil imports rose from an average of N36.55 billion, representing 96.8% of total import into Nigeria within the period 1970-1979, to N118.36 billion, representing 93.4% of total import in the period 1980-1989, N3.48 trillion in the period 1990-1999, representing 79.9% of total import and N19.33 trillion, representing 82.0% of total imports over the period 2000-2008/2. These represent an av- erage growth rate of 22%. This growth in the value of imports has in the literature been attributed to a number of factors which include expansion in crude oil exports that considerably raised for- eign exchange earnings, the over-valuation of the naira during the period of controls, and liberal trade policies, born out of the desire to provide capital goods and raw materials for import substituting industries; both of which made access to imports easy. Again, the expansion of domestic absorption which reveals supply inadequa- cies in the system, such that aggregate demand outweighs supply. To make up for the supply shortfalls and cut down on the surging inflationary consequences, Nigeria relied on imports, to the extent that imports as a component of total trade, particularly non-oil im- ports, have persistently been on a steady rise, resulting in deficits in Nigeria’s overall trade Balance of Payments, [9,11].
Objective of the Study
The main objective of this study is to examine the determinants of non-oil import in Nigeria. The specific objectives are to
• Investigate the factors determining non-oil import in Nigeria.
• determine the relative importance of drivers of non-oil import in Nigeria
Nigeria Import Policies
The Federal Government has replaced the current reshipment in- spection scheme with a destination scheme, and has moved from the Brussels definition of value to a system based on WTO Agree- ment.
A value added tax of 5% applies to both domestically produced and imported goods; and excise duties, ranging from 20% to 40%, are applied on certain imports. Additional layers of duty are pay- able for purposes such as port development and import supervi- sion. Government has also increased the number of goods on the import prohibition list. Nigeria has not imposed any trade defence measure; however, the authorities have indicated the need to pro- tect local industries from dumping and unfair competition within the WTO framework.
Measures Directly Affecting Imports
Customs Procedures and Valuation
The importation of goods to Nigeria is governed by the Customs and Excise Management Act; Customs and Excise Notices; and guide lines set out by the Federal Ministry of Finance. Under these provisions, importers do not need to be registered, since registra- tion with the Corporate Affairs Commission under the Companies and Allied Decree of 1999 is sufficient to import all but a few reg- ulated goods.
Importers must complete an import declaration form: Form M, other required documents include: an attested invoice, bill of en- try, copy of bill of lading/airway bill, a packing list, certificate of insurance, a bank receipt for import duties, a clean report of inspection issued by the reshipment inspection agent. The Gov- ernment has stepped up efforts to bring efficiency to the customs administration. Reforms to customs services are one of the core components of the Government’s current reform programme. The objectives of the programme are to modernize and speed up cus- toms clearance; simplify and rationalize tariffs, duties, and waiver; improve revenue collection by customs; and strengthen and pro- fessionalized customs services. The measures taken (or planned) include: a downward shift in port taxes and levies, and elimination of some redundant port security agencies; the establishment of a unit to fight corruption in the provision of customs services; and administrative changes to the management and operation of NCS. It is reported that the efforts to modernize and professionalize the Nigerian Customs Service and the Nigerian Port Authority have helped to reduced port congestion and clearance rates, particularly at Lagos Apapa port, which handles over 40% of Nigeria’s trade.
Rules of Origin
Rules of origin are the criteria needed to determine the national source of a product. Their importance is derived from the fact that duties and restrictions in several cases depend upon the source of imports. There is wide variation in the practice of governments with regard to the rules of origin. While the requirement of sub- stantial transformation is universally recognized, some govern- ments apply the criterion of change of tariff classification, others the ad valorem percentage criterion and yet others the criterion of manufacturing or processing operation. In a globalizing world it has become even more important that a degree of harmonization is achieved in these practices of Members in implementing such a requirement.
Rules of origin are used to implement measures and instruments of commercial policy such as anti-dumping duties and safeguard measures. it is also used to determine whether imported products shall receive preferential treatment, and also it is used for trade statistics purpose as well as an application of labelling and mark- ing requirements and for government procurement. Nigeria’s non-preferential rules of origin are contained in Customs Duties Art. Nigeria also applies the ECOWAS rules of origin under which a finished product has community origin.
Custom Tariffs
Within the context of accelerated integration amongst ECOW- AS member states, Nigeria is committed to adjusting its tariffs to the ECOWAS common external tariff, ranging from zero to 20% with a four-band tariff structure, by 2007. In general, Nigeria has lagged behind in trade reforms and hence has higher average and dispersed tariffs. Alignment with the ECOWAS CET should bring about liberalization and rationalization of Nigeria’s current tariff regime and help simplify customs administration.
Duty Exemptions and Concessions
The general import guidelines provide for exemptions from duties on a number of goods, including: aircraft, their part and ancillary equipment; lifesaving appliances; all goods imported for the offi- cial use of a Consular Officer, where the Government of the coun- try represented grants similar privileges; furniture and personal effect of diplomats; goods obtained free as technical assistance materials form donor international organizations or countries; per- sonal and household effects in passengers’ baggage; and military hardware and uniforms.
Various tariff concessions are also in place to attract investment. Duty concessions are granted on certain raw materials used by manufacturers in the communications, telecommunications, glass, baby napkin, motor cycle and bicycle industries, by virtue of their status as bonafide manufacturers. Various special duty concessions have also been granted to the British America Tobacco Company to enable it set up a tobacco plant in Nigeria. Tariff concessions also apply on fertilizers, in support of the agricultural sector.
Preferential Tariffs
A preferential tariff duty rate is a rate of duty that is lower than the normal tariff duty rate in the Tariff of a country. A preferential duty rate can be applied to certain goods from certain specified countries and groups of countries. This is done to accord with trade agreements that the country has entered into. Also, in accordance with the Generalised System of Preferences, a preferential duty rate is available to certain goods produced or manufactured in de- veloping countries. Applying a preferential tariff duty rate to goods is referred to as giving those goods preferential tariff treatment. As a member of ECOWAS, Nigeria provides tariff preferences to other ECOWAS member states
Other Duties and Taxes
Nigeria bound other duties and charges on all imports at 80%. Additional duties applying only to imports include: a port devel- opment levy of 7% of the duties payable; an ECOWAS commu- nity levy of 0.5%; a Comprehensive Import Supervision Scheme charge of 1% on the f.o.b. value of imports, a national automotive council levy of 2% on vehicles and parts; and a levy of 10% on the importation of both sugar and rice.
Excise Duty
Excise duties, which had been abolished at the time of the last TPR of Nigeria, were reintroduced in 1999 on, inter alia, spirits, ciga- rettes, alcoholic beverages, and cosmetics, at rates ranging from 20% to 40%. Excise duties apply to the duty-inclusive price of imports, and to the sales price of locally produced goods.
Anti-Dumping and Countervailing Measures
The Customs Duties (Dumped and Subsidies Goods) Act 1958 provides for the imposition of a special duty on any goods deemed to be dumped by companies or subsidized by any Government or authority outside Nigeria. Under the Act, goods are regarded as having been dumped if the export price is lower than the “fair mar- ket price”.
Import Prohibitions, Quantitative Restrictions, and Licensing
Under Nigeria’s Customs Legislation, import prohibition can be applied to protect domestic industries, to reduce balance of pay- ments deficits as anti- dumping measures and for moral, safety and other processes. The Government modifies the import prohibition list, adding or subtracting items, through notices and decrees.
Trends Analysis of Non-Oil Import and Gross Domestic Prod- uct in Nigeria from 1981-2016
Figure 1 below shows the trend of non-oil export and the Nigeria Gross Domestic Product. During the period of 1981 and 1985, the non-oil export was 9.2% while gross domestic product had a neg- ative value of -4.76811. Again, between the period of 1986 and 1990, the growth rate of the non-oil export reduced to 1.25 but gross domestic product increased by 0.56533%. Also, between the periods of 1991 – 1995, the growth rate of the non-oil import in- creased to 9.17% causing the gross domestic value to increase be- tween the same periods by 3.11641%. During the periods of 1996 and 2000, the non-oil import growth rate reduced to 2.01 causing gross domestic product reduction to 2.13567. Also, between the periods of 2001 and 2005, the non-oil growth rate reduced again to 1.42% while gross domestic product increased to 11.52075%. Between the period of 2006 and 2010, the growth rate of the non- oil import reduced to a negative value of -0.26% which made gross domestic product of that period to reduce by 6.33774%. Between the period of 2011 and 2015, the growth rate of the non-oil import increased to 6% while gross domestic product growth rate reduced to 5.7421%. It shows that both non-oil import and gross domestic product have been subject to volatility overtime.
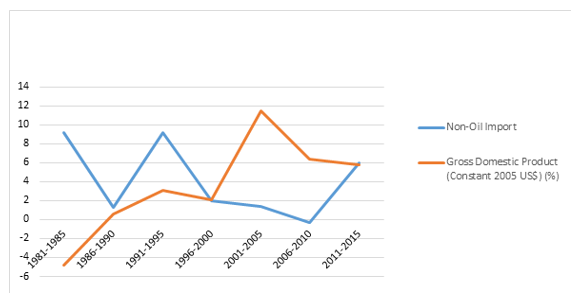
Figure 1: Trend of Non-Oil Import and Gross Domestic Product in Nigeria from 1981 - 2016
Source: Author’s Computation from World Development Indica- tors (WDI, 2016)
Trends Analysis of Exchange Rate, Non-Oil Import and Gross Domestic Product in Nigeria from 1981-2016
Figure 2 below shows the trends of exchange rate, non-oil import and Gross domestic product in Nigeria from 1981 – 2016. From the year 1981 to 1985, the rate of exchange is 0.66578 while non- oil export was 9.2% and gross domestic product was -4.76811%. during the following period, growth of exchange rate increased to 3.71321% while non-oil imports reduced to1.25% and gross do- mestic product increased to 0.56533. During the period of 1991 to 1995, the growth rate of exchange rate, non-oil import and gross domestic product increased to 15.86152%, 9.17% and 3.1164% respectively. During the period of 1996 to 2000, the growth rate of exchange rate increased again to 35.97797% while the growth rate of non-oil import and gross domestic product reduced to 2.01% and 3.1164% respectively. Also, during the period of 2001 to 2005, the growth rate of exchange rate and gross domestic product in- creased to 119.12342% and 11.52075% respectively but non-oil import reduced to 1.42%. During the period of 2006 to 2010, the growth rate of exchange rate increased again to 130.63637% and non-oil export dropped to a negative value of -0.26% causing gross domestic product to reduce to 6.33774%. Also, between 2011 and 2015, the growth rate of exchange rate increased to 155.50459% while non-oil import picked to 6% and gross domestic product re- duced to 5.7421%.
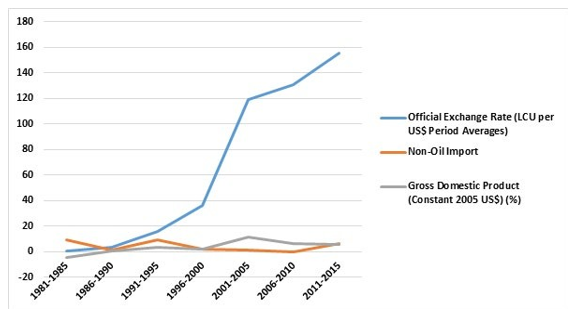
Figure 2: Trends of Exchange Rate, Non-Oil Import and Gross
Domestic Product in Nigeria from 1981-2016
Source: Author’s Computation from World Development Indica- tors (WDI, 2016)
Empirical Review
Used imperfect substitution approach to derive the aggregate im- port demand function on the basis of disaggregated expenditure components from 1972 – 2008 [12]. This derived import demand function is then empirically tested for Pakistan by using co-in- tegration and error correction mechanism. The empirical results showed that elasticity of import demand with respect to different macro components of final expenditure is different. The import de- mand in Pakistan is affected positively and significantly by all ex- penditure components. The relative prices have negative but insig- nificant relationship with import demand in Pakistan. The findings indicate that use of aggregate expenditure variable in the aggregate import demand function leads to aggregation bias because differ- ent macro components of final expenditure have different import contents.
Analysed the factors influencing import demand in Nigeria from period of 1980-2014 using import demand theory. the estimated import demand using ordinary least square and found that real in come, domestic price change and exchange rate, all have nega- tive but significant impact on total import demand while degree of openness, gross capital formation and external debt have positive and significant implication of total import demand in Nigeria [13].
Investigated the determinants of the import in turkey from the pe- riod of 2003- 2014 using import demand model and found that Income elasticity of import is much higher than the price elasticity of import in turkey. Empirical evidence demonstrates that 1% rise in real exchange rate will lead to 0.29% increase in import, 1% rise of export will lead to 0.86% increase on import and 1% rise of real exchange rate will lead to 3.14% increase on import [14].
Similarly, analyzed Turkish aggregate demand behaviour of im- port during the period of 1982-2002 using vector error correction model and auto regressive distribution lag approach. The study found that there is a long run relationship among import demand, real income, and relative prices and that import demand for turkey is relatively elastic in income and relatively inelastic in prices [15].
In this paper, import structure and economic growth in Kenya during 1975-2011 is estimated to assess the major determinants of import and an error correction model was adopted. The results show Kenya imports are significantly determined by real GDP, real exchange rate, foreign reserves and trade openness. The statistical- ly significant of the lagged error correction term suggests import and its determinants are co-integrated hence have long run equi- librium [16].
Investigated the determinant of import demand in sub-Sahara Afri- can during the period of 1995-2012 using consumer demand theo- ry and adopted fixed effect estimation technique and random effect estimation technique. They found that income, price of import, foreign reserves and degree of openness and the precious year im- port are highly significant and positively related to import [17].
By using data from the period of 1970-2002, analysed the aggre- gate import demand and expenditure components in Ghana. The study found that, an inelastic and positive relationship exists be- tween the three-expenditure component and aggregate import de- mand. Relative price is also inelastic but negatively impact aggre- gate demand [18].
Examined the relationship between export, import, and economic growth Korea between 1980-2003 using growth model and import model. The study found that Import has a significant positive effect on productivity growth but exports do not [19].
Investigated the econometric analysis of Jamaica’s import demand function with the US and UK during the period of 1996-2010 by applying co-integration analysis and error correction model, they found out that income has a lower and negative elasticity in the short run compared with the long run. Relative prices are three times as elastic in the short run than in the long run. Volatility is negative in the long run, but positive in short run. Foreign reserves behave the same irrespective of time. Overall, change takes place much faster in the long run than in the short run. In Jamaica-UK trade, GDP, and volatility are less elastic in the short run than in long run, but real foreign reserves and relative price adjust much faster [20].Moreover, in contrast to the long run, real foreign re- serves and volatility are both negative in the short run. Tight mon- etary policy has had a significant impact in the short run only in Ja- maica’s import demand function with the UK but not with the US
Methodology
The theoretical framework for this study is based on Hech- scher-Ohlin model which was developed by Swedish economist Eli Heckscher and his student Bertil Ohlin. This theory is estab- lished on comparative advantage of a country in both production and export which the country is better endowed. The theory con- sists of two important theorems, namely the Heckscher-Ohlin the- orem and factor price equalization theorem. The Heckscher-Ohlin theorem examines the reasons for comparative cost differences in production and states that a country has comparative advantage in the production of that commodity which uses more intensively the country"s more abundant factor. The factor price equalization the- orem examines the effect of international trade on factor prices and states that free international trade equalizes factor prices between countries, relatively and absolutely a thus serves as a substitute for international factor mobility.
The assumptions of the theory are based on the ideology that there are two countries involved, each country produces two commod- ities (labor intensive and capital intensive) and has two factors (labor and capital). There is a perfect competition in both com- modities and factors. There is difference in factor supply between two countries. There is dissimilarity in factor intensity of each commodity. For the same commodity in different country the pro- duction remains the same. In both countries the demand is iden- tical and there is full employment. In both countries technology knowledge is the same, goods are produced with land and labor in technology that satisfy constant return to scale. Home has a higher ratio of labor to land than foreign does. There is no transportation cost and free exist.
Heckscher-Ohlin theory also states that a country will export goods that use its abundant factor intensively and import goods that use its scare factors intensively. In the two-factor case, it states 'A cap- ital abundant country will export the capital intensive good while the labor abundant country will export the labor intensive good'. Hecksher and Ohlin have explained the basis of international trade terms of factor endowment.
NOM = f (FactorAbundance)................................................. (1)
Factor Abundance = f(KLR) ...................................................(2)
Where KLR is capital-labor ratio, hence, since factor abundance = (KLR) the model will be rewritten as:
NOM = f(KLR) ...........................................................................(3)
Where NOM is non-oil import, K is Capital and L is labour. KLR is therefore Capital-Labour ratio (factor intensity).
Following the theoretical framework above, non-oil import is a function of factor abundance. Also, there are other determinant of import according to the theoretical framework above which are ex- change rate, gross domestic product, foreign reserve and inflation according to [20,23]
NOM = f (EXCH, GDP, FRV & INF)........................................... (4)
To make the model robust and different, the current study will in- clude factor abundance in the model. Therefore, the model will rearrange as;
NOM = f (KLR, EXCH, GDP, FRV & INF) ....................................(5)
Were
NOM = Non- Oil Import (% of merchandise imports)
KLR = Proxied by capital-labor ratio
EXR = Official exchange rate (LCU per US$, period average)
GDP = Gross Domestic Product (constant 2005 US$)
FRV = Total reserves (includes gold, current US$)
INF = Inflation Rate (Consumer Prices, Annual %)
Therefore, the linear function of equation (5) will be given below as:
NOM = a0 + a1KLR + a2EXCH+ a3GDP + a4FRV + a5INF + u … (6)
Moreso, the variables will be transformed to their natural log- arithms to eliminate any serial correlation and to normalize the variables.
LN(NOM) = a0 + a1LNKLR+ a2LN(EXCH) + a3LN(GDP) + a4L- N(FRV) + a5LN(INF) + u (7)
• a0 tells us the expected value of NOM when all the explanato- ry variables have zero effect.
• a1 is the effect of a change in KLR on NOM while holding all explanatory variables constant.
• a2 is the effect of a change in EXCH on NOM while holding all explanatory variables constant.
• a3 is the effect of a change in GDP on NOM while holding all explanatory variables constant.
• a4 is the effect of a change in FRV on NOM while holding all explanatory variables constant.
• a5 is the effect of a change in INF on NOM while holding all explanatory variables constant.
u is the stochastic or error term with all the standard attributes. It captures the effect of other variables that could affect NOM but which are not included in the model.
Data Sources and Description
Annual data covering the period from 1981 to 2016 will be em- ployed. Non-oil import, Official exchange rate (LCU per US$, period average), factor abundance (using gross capital formation and labour as a % of population) gross domestic product, total re- serves (includes gold, current US$) and inflation rate (Consumer Prices, Annual %) will be the variables of interest. Essentially, for the reason of uniformity in measurement, and clarity in the in- terpretation of findings, the variables will be transformed to their natural logarithms to eliminate any serial correlation. The data will be sourced from Central Bank of Nigeria statistical bulletin and World Development Indicator. Hence, FA will be used to measure KLR in the analysis.
Estimated Result from Diagnostic Test
Unit Root Test
The study test for unit roots on log of non-oil import (LNNOM), factor abundance (LNFA), exchange rate (EXCHI), log of gross domestic product (LNGDP), log of total reserve (LNFRV) and inflation (INF). In other to test for unit root of the variables, Aug mented Dickey-Fuller (ADF) unit Root Test and Philip-Peron Test will be employed. The study makes use of unit root in order to guard against spurious regression and correlation result and also to guarantee that our inference regarding the important issue of stationarity is unlikely driven by the choice of testing procedures used.
However, the result is presented below and carried out without constant and trend
Decision Rule
If t* > ADF critical value, ==> do not reject null hypothesis, i.e., unit root exists.
If t* < ADF critical value, ==> reject null hypothesis, i.e., unit root does not exist.
A non-stationary time series can be converted into a stationary time series by differencing.
The results of the stationarity tests of variables at level and first difference are presented in the table below.
Unit Root Test Using Augmented Dickey-Fuller (ADF) In Nigeria: 1981-2016
|
Variables |
Order |
T-statistics |
Probability Value |
Remark |
|
LNNOM |
Level |
-2.951125 |
0.7968 |
I (1) |
|
First difference |
-2.951125 |
0.0000*** |
||
|
LNFA |
Level |
-2.948404 |
0.9455 |
I (1) |
|
First difference |
-2.957110 |
0.0066*** |
||
|
EXCH |
Level |
-2.948404 |
0.9000 |
I (1) |
|
First difference |
-2.951125 |
0.0001*** |
||
|
LNGDP |
Level |
-2.948404 |
0.9915 |
I (1) |
|
First difference |
-2.951125 |
0.0009*** |
||
|
LNFRV |
Level |
-2.948404 |
0.8541 |
I (1) |
|
First difference |
-2.951125 |
0.0001*** |
||
|
INF |
Level |
-2.948404 |
0.3139 |
I (1) |
|
First difference |
-2.951125 |
0.0001*** |
||
|
Note: *** implies 5% |
||||
Source: Author’s Computation from E-view9
Unit Root Test Using Phillips-Perron (PP) in Nigeria: 1981-2016
|
Variables |
Order |
T-statistics |
Probability Value |
Remark |
|
LNNOM |
Level |
-2.948404 |
0.8476 |
I (1) |
|
First difference |
-2.951125 |
0.0000*** |
||
|
LNFA |
Level |
-2.948404 |
0.9272 |
I (1) |
|
First difference |
-2.951125 |
0.0038*** |
||
|
EXCH |
Level |
-2.948404 |
0.8971 |
I (1) |
|
First difference |
-2.951125 |
0.0001*** |
||
|
LNGDP |
Level |
-2.948404 |
0.9870 |
I (1) |
|
First difference |
-2.951125 |
0.0000*** |
||
|
LNFRV |
Level |
-2.948404 |
0.8884 |
I (1) |
|
First difference |
-2.951125 |
0.0000*** |
||
|
INF |
Level |
-2.948404 |
0.0888 |
I (1) |
|
First difference |
-2.951125 |
0.0000*** |
||
|
Note: *** implies 5% |
||||
Source: Author’s Computation from E-view9
The above results in Table 5.3a and 5.3b showed that the vari- ables are non-stationary at levels. The unit root tests applied to the variables at levels reject the null hypothesis of stationarity of all the variables used. The variables are therefore differenced once in order to perform stationarity tests on difference variables. After differencing the variables once, all the variables were confirmed to be stationary. The ADF and PP test applied to the first difference of the data series accept the null hypothesis of stationarity for all the variables used. It is, therefore, worth concluding that the variables are integrated of order one. Therefore, the variables will be co-in- tegrated in order to ascertain the existence of long run relationship of the variables.
Co-integration Tests
In the table below, the null hypothesis of no co-integrating vec- tor can be rejected for all the variables used in the study and the empirical findings reinforce the conclusions about the presence of long-run relationship between LNNOM, LNFA, EXCH, LNGDP, LNFRV and INF. However, the results of the co-integration test of variables are presented in below
Unrestricted Co-integration Rank Test (Trace)
|
Unrestricted Cointegration Rank Test (Trace) |
||||
|
Hypothesized |
|
Trace |
0.05 |
|
|
No. of CE(s) |
Eigenvalue |
Statistic |
Critical Value |
Prob.** |
|
None * |
0.754001 |
118.9427 |
95.75366 |
0.0005 |
|
At most 1 * |
0.554348 |
71.26016 |
69.81889 |
0.0382 |
|
At most 2 |
0.418827 |
43.78079 |
47.85613 |
0.1146 |
|
At most 3 |
0.339423 |
25.32877 |
29.79707 |
0.1500 |
|
At most 4 |
0.247855 |
11.23093 |
15.49471 |
0.1977 |
|
At most 5 |
0.044476 |
1.546840 |
3.841466 |
0.2136 |
|
Trace test indicates 2 cointegrating eqn(s) at the 0.05 level |
||||
|
* Denotes rejection of the hypothesis at the 0.05 level |
||||
|
**MacKinnon-Haug-Michelis (1999) p-values |
||||
Source: Author’s Computation from E-view9
Empirical results from the two table above show that both the maximum eigenvalue and trace tests on statistics have values greater than the critical values at 5 per cent level of significance. Therefore, the null hypotheses of no co-integrating vectors (r = 0; r ≤ 1) against the specific alternatives are clearly rejected. Trace test at most two cointegrating equation while Max-engen value test indicated one co-integrating equation. According to both trace and max-engien value the study can state that there are long run relations among the six variables.
Determinant of Non-Oil Import
The study adopted the error correction Model (ECM) approach to examine the determinant of non-oil import in Nigeria from 1981 – 2016. The ECM method produces reliable estimates for small sample size and provides a check for robustness of the results and for estimation of a single co-integrating relationship that has a combination of I (1) since the stationarity test confirmed it. In or- der to achieve asymptotic efficiency, this technique modifies error correction model to account for serial correlation effects and test for the endogeneity in the regressors that result from the existence of Co-integrating Relationships and also to test for the speed of the variable adjustment to long run.
Error Correction Model
|
Variable |
Coefficient |
Std. Error |
t-Statistic |
Prob. |
|
LNFA |
25.10921 |
2.349815 |
10.68561 |
0.0000 |
|
EXCH |
0.001890 |
0.002962 |
0.637952 |
0.5289 |
|
LNGDP |
-1.747278 |
0.421576 |
-4.144629 |
0.0003 |
|
LNFRV |
0.261069 |
0.190369 |
1.371385 |
0.1815 |
|
INF |
0.009085 |
0.005305 |
1.712553 |
0.0983 |
|
C |
25.99200 |
8.807406 |
2.951153 |
0.0065 |
|
ECM (-1) |
-0.156793 |
0.194446 |
5.806356 |
0.0002 |
|
R-squared |
0.983983 |
Mean dependent var |
6.152600 |
|
|
Adjusted R-squared |
0.980424 |
S.D. dependent var |
2.435025 |
|
|
Akaike info criterion |
0.865593 |
|
|
|
|
Schwarz criterion |
1.179844 |
|
|
|
|
Log likelihood |
-7.715080 |
|
|
|
|
F-statistic |
276.4529 |
|
|
|
|
Durbin-Watson stat |
1.976862 |
|
|
|
Source: Author’s Computation from E-view9
Interpretation the ECM Result on the Determinant of Non-oil Import in Nigeria from 1981 – 2016
The table above shows the result of the ECM on the determinant of non-oil import in Nigeria. From the table, it is revealed that three variables are statistically significant where factor abundance are significant at 1%, 5% and 10% level of significant, gross do- mestic product is found to be significant at 5% and 10% level of significant while inflation is found to be significant at 10% level of significant. These variables i.e., factor abundance, exchange rate, total reserve and inflation are positively related to non-oil import in Nigeria therefore, a 1% increase in any of the explanatory vari- able mentioned earlier will increase non-oil import by 25%, 0.26, 0.001 and 0.09% respectively while gross domestic product which is negatively related to non-oil import but statistically significant therefore a 1% increase in gross domestic will bring about a reduc- tion of 1.7% in non-oil import.
Also, the result from the table showed that exchange rate and to- tal reserve are not statistically significant in determining non-oil import in Nigeria. It is shown that exchange rate and total reserve are positively related to economic growth where a 1% increase in these variables will cause non-oil import to increase 0.001890% and 0.261069% respectively.
The estimated coefficient of the error correction term has the ex- pected negative sign and significant at 5 percent. This implies that the independent variables responded speedily to long run changes in import demand model over the period of this study.
The R-squared of 0.983983 showed that the explanatory variables the ratio of capital and labor, exchange rate, the log of gross do- mestic product, log of total reserve and inflation explains about 98.3% of the total variation in non-oil import in Nigeria. The Adjusted R-squared of 0.980424 means that all the explanatory variables can only explained 98% variation in non-oil import in Nigeria. Durbin-Watson statistic of 1.976862 shows that there is no autocorrelation in the model.
Relative Importance of the Determinant of Non-Oil Import
The study will test for standardized coefficients or beta coeffi- cients. Standardized coefficients or beta coefficients are the esti- mates resulting from a regression analysis that have been standard- ized so that the variances of dependent and independent variables are 1.Therefore, standardized coefficients refer to how much stan- dard deviations of dependent variable will change, per standard deviation increase in the predictor variable. For univariate regres- sion, the absolute value of the standardized coefficient equals the correlation coefficient. Standardization of the coefficient is usually done to answer the question of which of the independent variables have greater effect on the dependent variable in a multiple regres- sion analysis, when the variables are measured in different units.
Formula for standardized beta test
β* = β * σX/σY
Where β* is the standardized beta, β is the unstandardized beta, σX is the standard deviation
Relative Importance of the Determinant of Non-Oil Import
|
VAR |
Unstandardized Coefficient |
Standard Deviation |
Standard Devia- tion of Non-oil |
Result |
Rank |
|
LNFA |
25.10921 |
0.113667 |
2.516173 |
1.1342 |
1.1342 |
|
EXCH |
0.001890 |
65.15979 |
2.516173 |
0.048944 |
-0.345041 |
|
GDP |
-1.747278 |
0.496877 |
2.516173 |
-0.345041 |
0.145542 |
|
FRV |
0.261069 |
1.402730 |
2.516173 |
0.145542 |
0.0637361 |
|
INF |
0.009085 |
17.65216 |
2.516173 |
0.0637361 |
0.048944 |
Source: Author’s Computation from E-view9
The table below shows the relative importance of the determinant of non-oil import. The result reveals that factor abundance is the most important determinant among the explanatory variable fol- lowed by gross domestic product and foreign reserve as second and third respectively. In the same vein, inflation was ranked forth while exchange rate has the least relative importance of the deter- minant of non-oil import.
Conclusion and Recommendation
This study investigated the determinant of non-oil import in Ni- geria from 1981 - 2016. Different diagnostic test was carried out which include descriptive statistics, correlation analysis, unit root test, co-integration analysis and ECM. The study found that factor abundance, gross domestic product and inflation are statistically significant while exchange rate and total reserve are statistically insignificant. Also, all the explanatory variables are positively re- lated to non-oil import in Nigeria except gross domestic product which is negatively related to non-oil import. The study concludes that factor abundance, gross domestic product and inflation and the determinant of non-oil import in Nigeria within the period cov- ered. Also, factor abundance has a lot to do with non-oil import according to the result from the analysis.
• Based on findings of this study the following policy rec- ommendations are put forward:
• The government and relevant monetary authorities should seek to employ and implement policies that stabilize the exchange rate given.
• inflation rate should be closely monitored and effectively managed.
• The non-oil sector should be developed to enhance the revenue base of the country as an alternative source of foreign re- ceipt. The over reliance on oil proceeds by the economy which in recent times have proved not to be stable should serve as a “red light” for policymakers on the need to diversify the country’s rev- enue sources.
• Various components that make up the non-oil sectors such as: agriculture, mining, service, small and medium enter- prises and manufacturing, should be given urgent developmental priority in terms of infrastructural provision because of their im- mediate returns to the economy. Also, proper exchange rate and inflation management policies aimed at improving performance of the non-oil sector as being adopted in recent times by the country’s monetary authorities should be maintained. This would help alle- viate some of the prolonged concerns of investors in the economy either in the short or long term. This would help boost investors’ confidence by ensuring returns on investment and improved over- all performance of the economy.
References
- McKinnon, R. I. (1964). Foreign exchange constraints in eco- nomic development and efficient aid allocation. The Econom- ic Journal, 74(294), 388-409.
- Egwaikhide, F. O. (1999). Determinants of imports in Nigeria:A dynamic specification.
- Hyacinth, E. I., Nteegah, A., & Ikpe, M. (2015). Determinants of Nigeria's non-oil import demand. South-Eastern Europe Journal of Economics, 11(1).
- Nteegah, A., & Mansi, N. (2017). Analysis of factors influenc- ing import demand in Nigeria. West African Journal of Indus- trial and Academic Research, 17(1), 88-100.
- Chani, M. I., Pervaiz, Z., & Chaudhary, A. R. (2011). Deter- mination of Import Demand in Pakistan: The Role of Expen- diture Components. Theoretical & applied economics, 18(8).
- Çil Yavuz, N., & Güris, B. (2006). An aggregate import de- mand function for Turkey: The bounds testing approach.
- Ayodotun, A., & Farayibi, A. (2016). Modelling the determi- nants of import demand in Sub-Sahara Africa. Available at SSRN 2828351.
- Kim, H., & Bianco, J. (2007). The affective turn: Theorizing the social. Duke University Press.
- Quadri, S. T. (2022). Determinants of Non-Oil Import in Ni-geria From 1981–2016.
- Frimpong, J. M., & Oteng-Abayie, E. F. (2007). Market re- turns and weak-form efficiency: The case of the Ghana Stock Exchange.
- Yusuf, W. A., Yusuf, S. A., Adesope, A. A. A., & Adebayo,O. Z. (2020). Determinants of rice import demand in Nigeria. Journal of Applied Sciences and Environmental Management, 24(5), 923-931.
- Udeh, S. N. (2015). Impact of monetary policy instruments on profitability of commercial banks in Nigeria: Zenith bank ex- perience. Research Journal of Finance and Accounting, 6(10).
- Bassey, F. A., Tobi, E. G., Bassey, I. F., & Ekwere, R. E. (2016). Liquidity management and the performance of banks in Nigeria. International journal of academic research in ac- counting, finance and management sciences, 6(1), 41-48.
- Adelman, I., & Robinson, S. (1989). Income distribution and development. Handbook of development economics, 2, 949- 1003.
- Dutta*, D., & Ahmed, N. (2004). An aggregate import de- mand function for India: a cointegration analysis. Applied Economics Letters, 11(10), 607-613.
- Erlat, G., & Akyüz, O. (2001). Country concentration of Turk-ish exports and imports over time. Economics Web Institutes.
- Osuntogun, A., Edordu, C. C., & Oramah, B. O. (1997). Po- tentials for diversifying Nigeria's non-oil exports to non-tra- ditional markets.
- Quadri, S. T. (2022). Determinants of Non-Oil Import in Ni-geria From 1981–2016.
- Too, H. K., & Gitau, H. K. B. R. (2021). What Explains the Trends of Wheat Imports in Kenya; A Cointegration Analysis Using ARDL-ECM Modelling.
- Nteegah, A., & Mansi, N. (2017). Analysis of factors influenc- ing import demand in Nigeria. West African Journal of Indus- trial and Academic Research, 17(1), 88-100.
- Adjasi, C. K., Abor, J., Osei, K. A., & Nyavor-Foli, E. E. (2012). FDI and economic activity in Africa: The role of lo- cal financial markets. Thunderbird International Business Re- view, 54(4), 429-439.
- Adeniyi, O., Oyinlola, A., Omisakin, O., & Egwaikhide, F. O. (2015). Financial development and economic growth in Nige- ria: Evidence from threshold modelling. Economic Analysis and Policy, 47, 11-21.
- World Bank. (2007). World development indicators 2007. The World Bank.