
Advancements in Journal of Urology and Nephrology(AJUN)
ISSN: 2689-8616 | DOI: 10.33140/AJUN
Impact Factor: 1.0


Research Article - (2020) Volume 2, Issue 3
Decaffeinated Coffee Consumption and Renal Function Impairment in Health and Diabetes: A Paradigm-Shift
2Department of Medicine (Renal Unit) University of Calabar Teaching Hospital Calabar, Nigeria
Received Date: Jul 18, 2020 / Accepted Date: Jul 22, 2020 / Published Date: Aug 03, 2020
Copyright: ©Christopher Edet Ekpenyong, et al. This is an open-access article distributed under the terms of the Creative Commons Attribution License, which permits unrestricted use, distribution, and reproduction in any medium, provided the original author and source are credited.
Abstract
Aim: The belief that decaffeinated coffee (DCAF) does not contain a physiologically relevant concentration of caffeine and therefore has no significant adverse effect on renal endpoints makes patients who are vulnerable to renal dysfunction, renal compromised state, medical conditions that contraindicate caffeine intake or those already on prescription medications known to adversely affect the kidney to sometimes substitute DCAF for caffeinated coffee even as the credibility of this paradigm remains disputable. Therefore, the present study aimed to assess the effect of DCAF consumption on markers of renal function and carbohydrate metabolism in health and diabetes.
Materials and Methods: Sixty Wistar Albino rats were divided into 12 groups (6pairs) (n=5per group) for male and female animals. Animals in group 1 served as normal control (NCTRL) and were given standard feed and water only. Animals in group 2 received standard feed plus DCAF. Group 3 was the diabetic (DIA) only group while groups 4, 5, and 6 were DIA plus DCAF treatment groups. After 4weeks of treatment, animals were sacrificed and blood obtained and analyzed for the biochemical indices of renal function and carbohydrate metabolism using standard methods.
Results: Serum creatinine (SCr) levels increased significantly in all DCAF treated groups compared with the NCTRL group in male and female animals. Serum electrolytes did not show any significant change across groups. Serum Urea (SUr) increased and decreased in DIA alone group and DIA plus DCAF groups respectively. Serum glucose, insulin, and HOMA-IR increased and decreased significantly in DIA alone group and DIA plus DCAF treated groups respectively compared with NCTRL and DCAF control groups.
Conclusion: The consumption of DCAF may adversely affect renal endpoints in health and diabetes but improves markers of carbohydrate metabolism in diabetes likely due to the re-enforcement effect of its caffeine and other bioactive constituents.
Keywords
Decaffeinated coffee, Kidney function, Diabetes, Creatinine
Introduction
The coffee drink is a dark-colored pleasing taste tea prepared from roasted coffee beans. It is extensively consumed in many countries for nutritional, recreational, and therapeutic purposes. A coffee bean is produced by a coffee plant, an evergreen shrub of the genus coffee; a member of the Rubiaceae family of flowering plants that grow to a height of about 3 to 3.5m. It is native to tropical Africa specifically Ethiopia, Sudan, and Madagascar. However, it is widely cultivated globally. Although there are several species of coffee, (>80 species) only 2 species (coffee Arabica and coffee Camphora) are commonly cultivated and have significant economic/commercial values.
The coffee drink contains several bioactive constituents in different proportions depending on the formulation (e.g., green coffee bean or roasted coffee) and preparations (brewed, instant and decaffeinated coffee (DCAF)). For instance, both green coffee bean and roasted coffee contain carbohydrates, lipids, proteins, peptides amino-acids, and polyphenols, but the concentrations of these nutrients are higher in the green coffee bean than the roasted coffee, likely due to differences in the processing temperature. Roasting enhances the degradation of trigonelline to several compounds including niacin and some volatile components. Other bioactive constituents found in roasted coffee include Mg+, K+, vitamin E, chlorogenic acids (CGAs), and melanoidins [1, 2]. Decaffeination also leads to loss of some water-soluble flavor and CGAs. Other constituents include monoamine oxidase inhibitors, β-carboline, and harmani, and caffeine which is responsible for the stimulant effect of CCAF and is unaffected by roasting. Besides being decaffeinated during production, several coffee species are naturally caffeine-free such as coffee bengalensis [3]. Habitual coffee consumption is associated with numerous desirable and undesirable health effects. According to Freeman et al., habitual coffee drinkers have a greater life span than non-drinkers [4]. One meta-analysis of 28 studies showed that every additional cup of caffeinated coffee DCAF taken per day decreased the risk of type 2 diabetes mellitus (T2DM) by 9% and 6% respectively [5]. However, consumption by a known T2DM could have detrimental effects.
Literature reports on the relationship between coffee consumption and renal endpoints are conflicting probably due to misclassification of coffee consumption and inadequate adjustment to potential confounders and residual confounders due to the study design. For instance, some studies do not specify the type of coffee used/ consumed by participants (Caffeinated or Decaffeinated). On the strength of these drawbacks, the present study aimed to assess the effect of DCAF consumption on renal endpoints and markers of carbohydrate metabolism in health and diabetes.
Materials and Methods
Animal Care and Use
Sixty Wister Albino rats weighing between 200gm and 250gm were obtained from the animal house of the Faculty of Basic Medical Sciences, University of Uyo, Uyo, Nigeria.
They were kept in five well-ventilated cages for one week to acclimatize and were adequately cared for following the principle of Laboratory Animal Care and Use including allowing access to food and water ad libitum throughout the period of the experiment (4weeks). They were fed rat chow (Vital Feeds, Grand Cereal Ltd. Jos). After determining the lethal dose (LD50) (192mg/kg) of the experimental DCAF (Nestle Nigeria Ltd.), the different doses of the DCAF assumed to contain 3% of caffeine and obtained from a local shop were calculated as 10%, 20% and 30% for low, medium and high dose groups respectively of the LD50. Accordingly, 19.2mg/kg, 38.4mg/kg, and 57.6mg/kg were used as low, medium, and high doses of the experimental DCAF sample.
Segregation and Treatment of Animals
The animals were randomly divided into 12 groups (6pairs) (n=5 per group) for each sex.
Group 1: Animals in this group served as normal control (NCTRL) and were orally gavaged 2ml of normal saline for 4wks.
Group 2: Animals in this group served as DCAF control and were orally gavaged with medium dose (38.4mg/kg) of DCAF. Medium dose of the DCAF was used as DCAF control given the empirical evidence that showed that moderate coffee consumption is associated with a lower risk of chronic diseases such as diabetes mellitus and diabetes-induced kidney disorders [6].
Group 3: Animals in this group served as diabetic (DIA) only group.
Group 4: Animals in this group served as DIA plus low dose (19.2mg/kg), of decaffeinated coffee (DCAFLD) group.
Group 5: Animals in this group served as DIA plus medium-dose (38.4mg/kg), of decaffeinated coffee (DCAFMD) group.
Group 6: Animals in this group served as DIA plus a high dose (57.6mg/kg), of decaffeinated coffee (DCAFHD) group.
Induction of Diabetes
Forty (20 males and 20 female) Wister Albino rats were randomly selected and induced with diabetes as follows: after 18hrs of fasting, diabetes was induced by a single intraperitoneal injection of streptozotocin (STZ) (65mg/kg-BW) dissolved in a freshly prepared 0.IM citrate buffer, 15 minutes after the intraperitoneal injection of nicotinamide (120mg/kg-BW) dissolved in normal saline was given. Seventy-two hours after the injection of STZ, blood samples were collected from the tail vein of the rats by pricking and used for the estimation of fasting blood sugar (FBS).
Biochemical Analysis
Markers of renal function tested included electrolytes Na+, K+, chloride (Cl-), bicarbonate (HCO -). Others include urea (Ur), creatinine (Cr-), and uric acid (UA). Serum electrolytes Na+ and K+ were measured by flame photometry (Jenson PEP 9) Jenson Scientific Limited, Bedfordshire (UK). Serum Cl- was measured by the ion-selective meter (Orion 730; Orion Research Inc; Boston MA). Serum creatinine (SCr-) was measured using Jaffe’s method using 0.75 Na+ hydroxide and 1% Picric acid (Sigma Chemicals, Perth, Balcatta, India). Serum Urea (SUr) and serum uric acid (SUA) were measured using a multi-channel automated analyzer (SYNCHRON, Los Angeles, CA, USA). Serum HCO - levels were measured by the enzymatic method. The serum insulin level was determined by an enzyme-linked immunosorbent (ELISA) method using a commercially available kit (Clouol-clone corp, Houston USA). Fasting blood sugar was measured by multi-channel. Automated system lipid pro-TM Model KM-001A; info Pia Co Ltd. South Korea. Homeostasis Model Assessment for Insulin Resistance (HOMA-IR) was calculated as follows; HOMA-IR= [fasting blood glucose (mmol/Lx) fasting insulin (µ/U/mol/22.5).
Statistical Analysis
Statistical analysis was carried out using statistical package for social sciences (SPSS), version 20.0. The one-way analysis of variance (ANOVA) and posthoc Tukey Least Significant differences LSD test were used to analyze the data and determine the significant levels respectively.
Data were expressed as Mean ± Standard Error of Mean (SEM) and bar charts were used to illustrate the variation in the numerical values across experimental groups P-values <0.05 were considered statistically significant.
Results
Results of the present study showed that animals treated with DCAF had a significant increase in SCr levels in both male and female groups (Figures 1a & 1b).
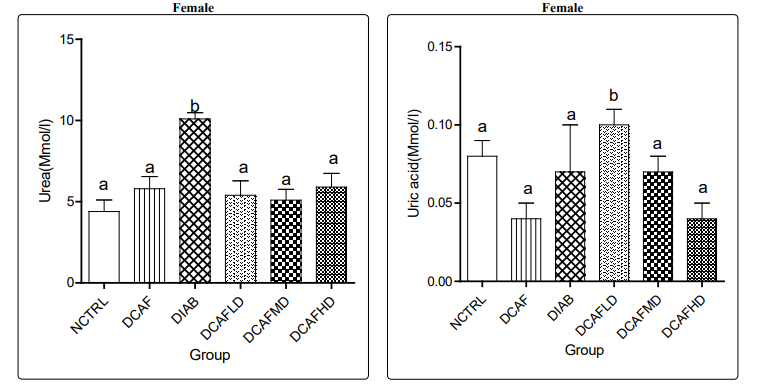
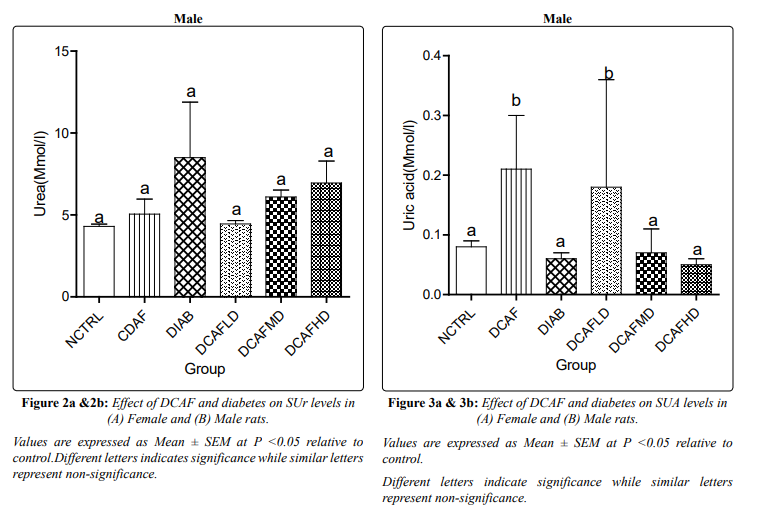
Figures 2a and 2b show that the increase in serum SUr level in the DCAF only male and female groups were not significantly different from levels in NCTRL groups. SUr levels increased significantly in the DIA alone group in both male and female animals. However, treatment of the DIA animals with different doses of DCAF caused a dose-independent significant decrease in SUr levels in both male and female animals compared with levels in the DIA alone group and a non-significant decrease in SUr level compared with NCTRL and DCAF control groups.
DIA plus low dose DCAF female animals had a significant increase in SUA level compared with NCTRL and DCAF control groups, whereas SUA levels in DIA plus medium and DIA plus high doses of DCAF in female animals showed a non-significant increase in SUA levels compared with NCTRL and DCAF alone groups. SUA increased significantly in DCAF alone and diabetes plus low dose male groups, compared with the NCTRL group. SUA did not differ significantly in other groups compared with NCTRL (Figures 3a & 3b).
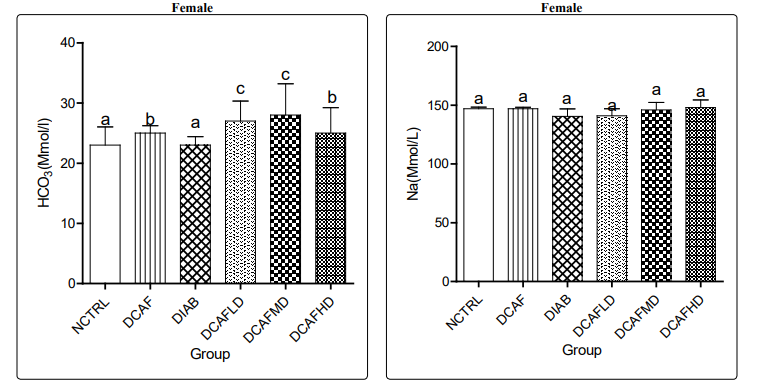
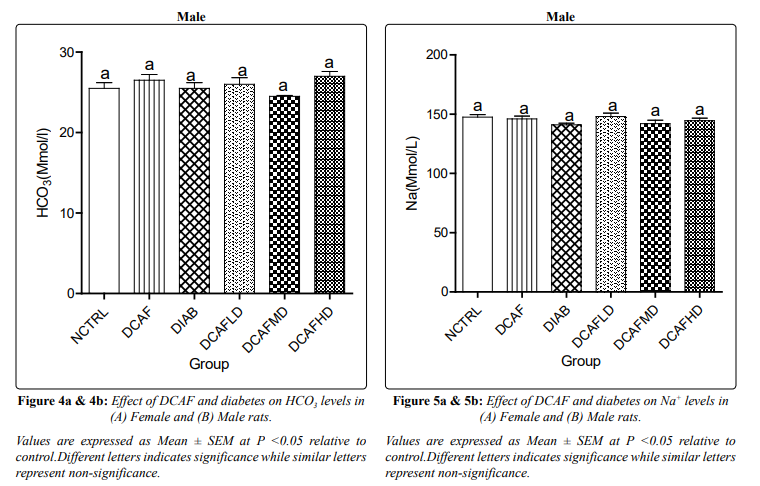
In female rats, treatment with DCAF caused significant increases in serum HCo - levels in DCAF control and DIA plus DCAF treated groups compared to levels in NCTRL and DIA control groups.
In male rats treated with DCAF caused no significant changes in serum HCo - levels in all experimental groups compared with NCTRL groups (Figures 4a & 4b).
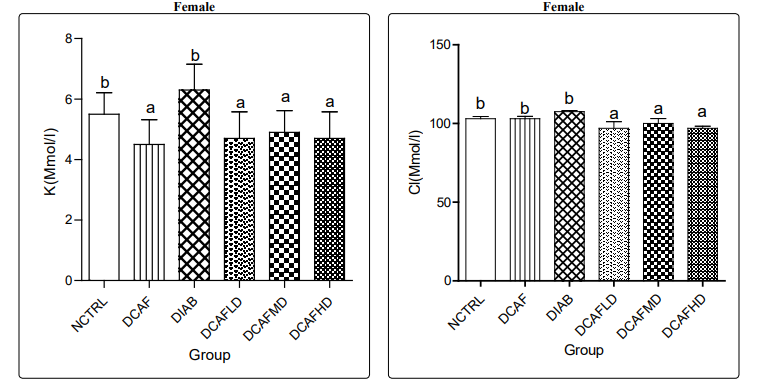
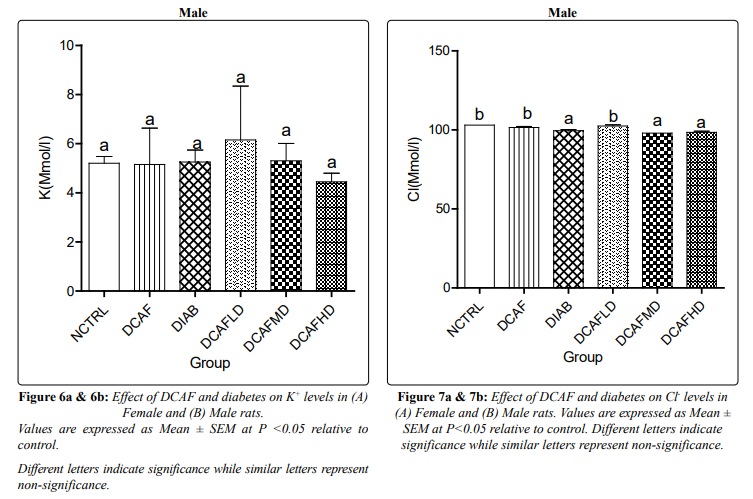
Treatment of animals with different doses of DCAF caused a non-significant change in serum Na+ levels in all groups and genders. In male rats, serum K+ level also followed a similar pattern, a non-significant change in all experimental groups. However, a significant reduction in serum K+ level was observed in the DCAF control female group compared to the NCTRL group. Serum K+ level in DIA control female animals was not significantly different from levels in the NCTRL group, interestingly; DIA animals treated with different doses of DCAF had dose-independent decreases in serum K+ levels (Figures 5a & 5b, 6a & 6b).
In female animals, there were no significant changes in serum Cl-levels in DCAF control and DIA control groups compared with the NCTRL group. However, the administration of different doses of DCAF caused dose-independent significant decreases in serum Cl-levels. In male rats, the administration of DCAF caused a significant decrease in serum Cl- levels in the DIA control group, DIA plus medium-dose DCAF, and DIA plus high dose DCAF groups compared with NCTRL and DIA control groups (Figures 7a & 7b).
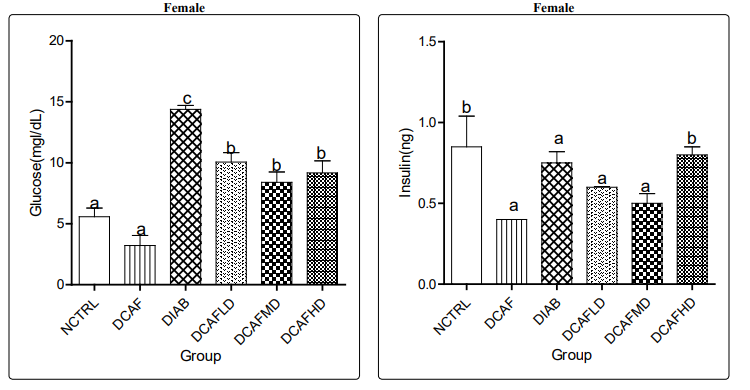
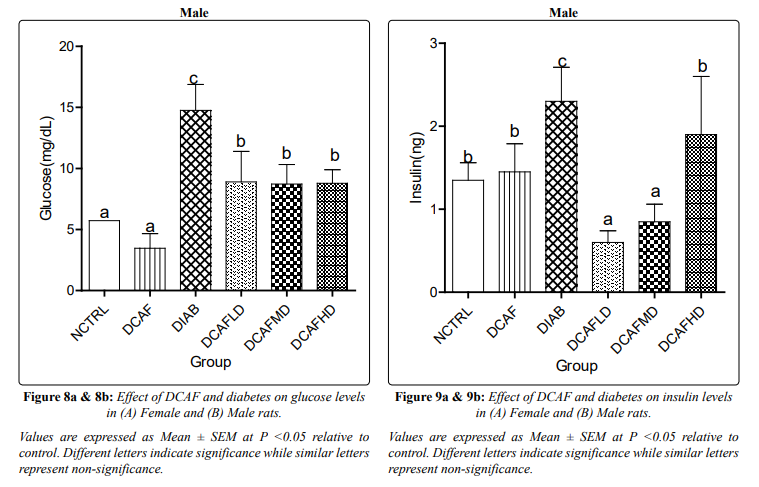
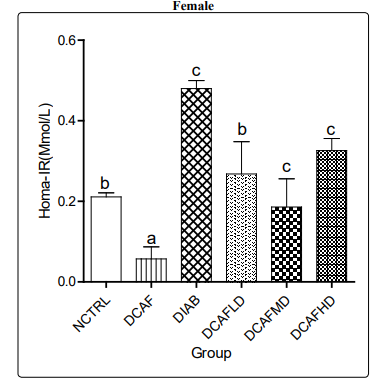
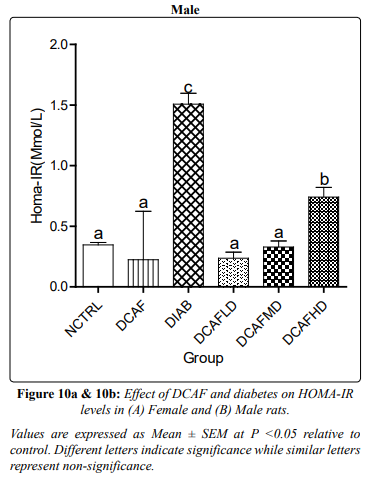
Serum glucose, insulin and calculated HOMA-IR increased and decreased significantly in DIA alone group and DIA plus DCAF treated groups compared with NCTRL and DCAF alone groups (Figures 8a & 8b, 9a & 9b, 10a &10b) respectively.
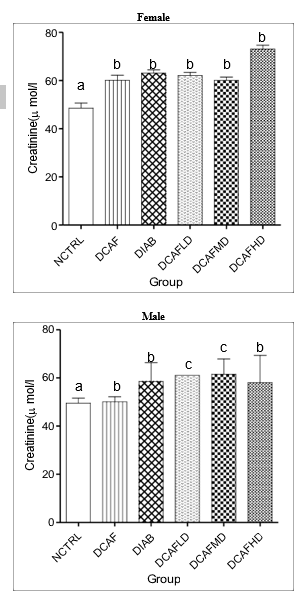
Figure 1a &1b: Effect of DCAF and diabetes on SCr levels in A) Female and (B) Male rats.
Values are expressed as Mean ± SEM at P <0.05 relative to control.
Different letters indicate significance while similar letters represent non-significance.
Discussion
The results of the present study showed that the consumption of DCAF was associated with a significant increase in SCr levels in all DCAF treated groups compared with the NCTRL group in both male and female animals. This finding suggests effect modification by the caffeine content of the DCAF on the association between DCAF consumption and renal endpoints in diabetes. It contradicts the existing notion that the consumption of DCAF is not detrimental to renal excretory function, especially the excretion of Cr since it contains a non-physiologically relevant concentration of caffeine. Accordingly, it is posited that due to the low caffeine content, the consumption of DCAF would enhance the glomerular hemodynamic modulating role of adenosine, through the control of afferent arteriolar vascular resistance and leading to increasing Cr excretion and by extension decrease SCr level [7]. This notion is based on the existing knowledge that caffeine inhibits adenosine receptors in the juxtaglomerular cells, increases renin secretion and angiotensin 11 formation and leading to increasing vasoconstriction of the renal vascular system, reduced renal blood flow, decreased GFR and ultimately causing increase SCr level.
One plausible explanation for the contrary results obtained in the present study is the effect of decaffeination methods on coffee bioactive constituents including the concentration of caffeine and other constituents. Many regulatory bodies such as the United Kingdom Registration Agency and Food and Drug Administration have issued guidelines that permit a maximum caffeine content of 0.3% dry weight for DCAF [8, 9]. Studies determining the caffeine content of DCAF drinks showed that DCAF frequently contains more caffeine than specification, and in various concentrations [9, 10]. For instance, a two-phase study to determine the caffeine content from a variety of DCAF drinks obtained from different coffee establishments and coffee shops showed that caffeine content of 6 DCAF from Starbucks expresso obtained from different outlets varies from 3.0 to 15.8mg per shot, while the caffeine content of DCAF from Starbucks brewed obtained from the same outlet ranged from 12.0-13.4mg/6-oz serving [10]. In general, the investigators found that the 10 DCAF samples from different outlets contained caffeine in the range of 0-13.9mg/16-oz serving. This underscores the need for patients who are vulnerable to caffeine effects to be cautious in the use of coffee purported to be DCAF as most of the DCAF frequently contain caffeine in concentrations greater than specification. Therefore, multiple intakes of DCAF with an average caffeine concentration may achieve serum caffeine level that is almost equivalent to the concentration found following the intake of caffeinated coffee or any other caffeinated beverage and can cause renal function impairment similar to that found following caffeinated coffee / beverage consumption. According to Baron and Roberts, a 150ml cup of caffeinated coffee contains about 60-120mg of caffeine, a concentration that can be met by the consumption of multiple servings of DCAF coffee per day. Other studies showed that the caffeine content in carbonated sodas was 18-48mg/12-oz serving and 20-40mg per150ml cup in tea [11, 12]. These are equivalent to the caffeine concentration in 2 to 4 servings of Starbucks brewed DCAF as reported in a study by McCusker et al., [10].
Also, some of the solvents/methods used in the process of decaffeination have been found to decrease the level of some vital compounds that are protective of the kidney. For instance, organic solvent decaffeination has been reported to produce CGAs losses of 16% in Arabica beans and 11% in Robusta bean [13]. Likewise, CGA losses were reported for the water decaffeination method [1]. Therefore, decaffeination-induced losses of renal protective compounds in the face of increasing level of renotoxic compound could produce paradoxical results similar to the observation in the present study.
Also, histopathological examination of the kidney in animals treated with both caffeinated and DCAF showed that both types of coffee caused distorted cytoarchitecture of the kidney, although more in caffeinated than DCAF group., This suggests that although the concentration of caffeine is low in DCAF, the consumption of multiple doses of DCAF could raise the serum caffeine concentration to a physiologically relevant level capable of causing a detrimental effect to the renal endpoints.
Besides decaffeination, other factors that can alter the caffeine and other bio-constituents of coffee include the degree of roasting, preparation methods (e.g., coffee grind setting and brew type), type of bean (Arabica versus Robusta), as well as genetic polymorphism and gut microbiome which is known to affect the bioavailability and type of coffee metabolites to which an individual is exposed [14]. Although some investigators argued that the consumption of low to moderate caffeine may not be detrimental to renal endpoints, it is worthy of note that the amount of caffeine required to produce effect varies from person to person and may be influenced by body size, differences in the extent of tolerance, and the inter-individual variation in caffeine metabolism [9, 15]. Interestingly, even low doses or acute intake of caffeine have been found to exert a significant effect especially, when taken in multiple doses throughout the day probably due to the reinforcement effect [16].
The non-significant changes in SUr level in the DIA plus DCAF groups in the present study can partly be explained by the glomerular hyper-filtration-induced decreased reabsorption of urea by the renal tubules.
The present study findings are novel and contradict the paradigm that the consumption of DCAF is not detrimental to renal endpoints. It underlines the clinical relevance to the practitioners and consumers especially those having medical conditions that require caffeine-free diets such as hypertension, arrhythmias, autosomal polycystic kidney disease, renal compromised individuals including the elderly or during vulnerable periods (such as before dialysis and after renal transplant), and in individuals on prescription medications or diets known to adversely affect the kidney such as prolonged intake of high protein diets, non-steroidal anti-inflammatory drugs, diuretics, aminoglycosides antibiotics, angiotensin-converting enzyme inhibitors, and anti-retroviral medications to be cautious in the use of DCAF. For instance, the intake of caffeine-containing beverages can worsen autosomal polycystic kidney disease by promoting cyst enlargement, palpitation, hypertension, and sometimes cardiac arrhythmias [10].
The significant reduction in serum glucose and insulin levels and the calculated HOMA-IR in the DIA plus DCAF groups compared with the DIA alone group support the inverse relationship between coffee consumption and the risk of T2DM as previously documented. This observation also supports the previous assertion that caffeine improves glucose homeostasis in the face of exacerbation of renal injury [17].
In a study of 40, 011 participants, Dieren et al., found that the consumption of 3.0 cups of coffee reduced the risk of T2DM by 42%. In a similar study, Bhupathiraju et al., reported that the consumption of >1 cup of coffee per day over 4 years’ period reduced the risk of developing T2DM by 11% [18, 19]. Coffee contains several bioactive constituents such as electrolytes, vitamins, polyphenolic acids including chlorogenic acid, caffeic acid, diterpenes, Mg+, vitamin E, and several other biologically active compounds.
It is conceivable and empirically proven that some of these bioactive constituents possess antioxidant, anti-inflammatory, and immune system modulating effects which are the underlined pathologies driving the onset, progression, and complications associated with T2DM and renal disorders [2].
Besides the beneficial effects of other biologically active compounds in coffee, caffeine component of coffee has been found to improve glucose homeostasis through the inhibition of adenosine receptors and thereby preventing adenosine from enhancing hepatic glucose production [17].
Conclusion
The consumption of multiple doses of DCAF may adversely affect renal endpoints in health and diabetes likely due to the re-enforcement effect of the caffeine content especially in individuals in a renal compromised state, during vulnerable periods such as during renal dialysis or renal transplant and those on prescription medications known to adversely affect the kidney, such as aminoglycoside antibiotics, non-steroidal anti-inflammatory drugs, diuretics, angiotensin-converting enzyme inhibitors, and anti-retroviral drugs. However, in diabetes, DCAF may improve markers of carbohydrate metabolism.
References
- Farah A (2012) Coffee constituents in: Chu YU, editor Coffee; emerging health effects and disease prevention. Oxford UK, Wiley-Black well.
- Ludwig IA, Clifford MN, Lean MEJ Hiroshi Ashihara, Alan Crozier, et al. (2014) Coffee biochemistry and potential impact on health. Food function. Royal Soc Chem 5: 1695-717.
- Mazzafera P, Magalhâes ANC (1991) Caffeina em folhas esementes de Coffee e Paracoffea. Rev. Bras Botanica 14: 157-160.
- Freedman ND, Park Y, Albert CC, Hollenbeck AR, Sinha R, et al. (2012) Association of coffee drinking with total and cause-specific mortality. N Engl J Med 366: 1891-1904.
- Ding M, Bhupathiraju SN, Chen M, Rob M van Dam, Frank B Hu, et al. (2014) Caffeinated and deCCAF consumption and risk of type 2 diabetes: a systematic review and a dose-response meta-analysis. Diabetes Care 37: 569-586.
- Hu EA, Selvin E, Grams ME, Steffen LM, Coresh J, et al. (2018) Coffee consumption and incident kidney disease: results from the atherosclerosis risk in communities (ARK) study. Am. J. Kidney Dis 72: 214-222.
- Rybakowska IM, Milczarek R, Siominska EM, Smolenski RT (2017) Effect of decaffeinated on function and nucleotide metabolism in the kidney. Mol Cell Biochem 439: 11–18.
- Ramalakshmi K, Raghavan B (1999) Caffeine in coffee: its removal. Why and how? Crit Rev Food Sci Nutr 39: 441-456.
- Umoh IU, Jimmy EO (2017) A comparative Histopathological effect of caffeinated and decaffeinated on the histomorphology of the kidney of adult male albino Wister rats. IOSR-JPBS 12: 62-66.
- McCusker RR, Fuehrlein B, Goldberger BA, Gold MS, Cone EJ, et al. (2006) The caffeine content of decaffeinated. J Anal Toxicol 30: 611-613.
- Baron JJ, Roberts HR (1996) Caffeine consumption. Food Chem Toxicol 34: 119-129.
- McCusker RR, Goldberger BA, Gold MS, Cone EJ (2003) The caffeine content of decaffeinated. J Anal. Toxicol 27: 611-613.
- Toci A, Farah A, Trugo LC (2006) Effect of decaffeination using dichloromethane on the chemical composition of Arabica and robusta raw and roasted coffees. Quim Nova. SBQ 29: 965-971.
- Poole R, Kennedy OJ, Roderick P, Fallofield JA, Hayes PC, et al. (2017) Coffee consumption and health: umbrella review of the meta-analysis of multiple health outcomes. BMJ 359: 5024.
- Herber Gast GCM, Van Essen H, Verschure WMM, Stehouwer CDA, Gansevoort RT, et al. (2016) Coffee and tea consumption concerning the estimated glomerular filtration rate: results from the population-based longitudinal doetichem cohort study. Am J Clin Nutr 103: 1370-1377.
- Hughes JR, Hunt WK, Higgins ST, Bickel WK, Fenwick JW, et al. (1992) Effect of dose on the ability of caffeine to serve as a reinforcement in humans. Behav. Pharmacol 3: 211-218.
- Tofovic SP, Salah EM, Jackso EK, Melhem M (2007) Early renal injury induced by caffeine consumption in obese, DIA. ZGF, Rats Renal Failure 29: 891-902.
- Dieren SV, Uiterwaal CSPM, Van der Schouw YTV, Van der DL, Boer JMA, et al. (2009) Coffee and Tea consumption and Risk of type 2 diabetes. Diabetologia 52: 2561-2569.
- Bhupathiraju SN, Pan A, Manson JE, Willett WC, Van Dam RM, et al. (2014) Changes in coffee intake and subsequent risk of type 2 diabetes: three large cohorts of US men and women. Diabetologia 57: 1346-1354.