


Research Article - (2020) Volume 5, Issue 1
Consumption of Chicken Products Therein Three Regions of Cameroon: Influencing Factors and Health Risk Perception Associated To the Use of Veterinary Drugs by Farmers
2Centre for Food and Nutrition Research, IMPM, PO Box 6163, Yaounde, Cameroon
3Advanced Teacher’s Training College for Technical Education, University of Douala, PO box 1872, Doua, Cameroon
Received Date: Oct 14, 2019 / Accepted Date: Feb 27, 2020 / Published Date: Mar 09, 2020
Copyright: ©Fabrice De Paul Tatfo Keutchatang, et al. This is an open-access article distributed under the terms of the Creative Commons Attribution License, which permits unrestricted use, distribution, and reproduction in any medium, provided the original author and source are credited.
Abstract
The presence of veterinary drugs in poultry products constitutes a potential danger for population health, chicken being one of the most consumed of these products. To assess consumer’s exposure, data on consumption amounts, factors influencing consumption and risk perception for consumers constitute the first step. Therefore, there is a need to have data on chicken consumption, factors influencing and risk perception for consumers. A cross-sectional survey using questionnaires was used to collect information from 905 households in the Center, Littoral and West regions of Cameroon between August 2017 and April 2018. The results showed that per capita consumption of both chicken and eggs per month were 1.2 kg (14.4 kg/ year) and 0.5 kg (6 kg/year) for the Centre, 0.9 kg (10.8 kg/year) and 0.5 kg (6 kg/year) for the Littoral, 0.8 kg (9.6 kg/year) and 0.6 kg (7.2 kg/year) for West regions. Chicken and eggs consumption is determined by household incomes, household member’s number and locality. Only 230 households affirmed to be aware of the usage of chemicals in chicken farming and 220 (95.6%) of them affirmed that chemicals are improper used by farmers. Ninety six households (10.6%) affirmed that all chicken types present the same risk. Consumption of chicken and eggs is good for the body, but great attention should be paid in their origins and to the recommendations for the Food Safety and Ins-pection Services on-line materials during chicken and eggs handling.
Keywords
Poultry, Eggs, Consumption, Health, Risk Perception
Introduction
Poultry products are good sources of animal proteins and others nutrients [1,2]. The necessity of securing the food supplier in terms of quality and quantity for the increasing population, as well as the need for animal proteins, health problems due to nutrition, consumers awareness and tendency to maintain a healthy and balanced diet, have all made the poultry sector a significant industry throughout the world [3]. Amongst poultry and others animals, chicken production is quicker and cheaper than other meat sources. By forbidding of some animal meats consumption, like pork, due to religious rules in islamic countries, and also higher price of red meats like beef and lambs, chicken gains more attention and plays an important role in public nutrition [4]. Chicken products consumption increases with the growing of population [3,5-7]. Their high demand, force the poultry breeding industry to produce more, which then leads to a further increase in the use of veterinary drugs such as antibiotics or hormones for growth stimulation and weight promotion [4]. Unfortunately these veterinary drugs also have side effects on human health which include allergic reactions to several antimicrobial drug classes, blood dyscrasias, carcinogenicity, and cardiovascular toxicity, to mention a few [8,9]. To limit risk, regulatory body sets maximum permitted concentrations for veterinary drug residues known as tolerances or maximum residue limits. The assessment of associated health risk worldwide is generally based on production and consumption data [10-12]. In contrast to developed countries where data on chicken meat and eggs are available and regularly updated, this is not always the case in developing countries [3,13,14]. Especially in Cameroon, poultry sector also plays an important role in poverty alleviation by means of incomes generation and household food security, but data on chicken products consumption in Cameroon date back to 2009 [15,16]. Furthermore, factors influencing consumption of chicken and eggs are not well known. Such situations are too embarrassing due to poultry sector performing, public nutrition and health problems, the more as veterinary drugs have been reported as being used by farmers above the recommended concentrations in this country [15,17]. This study was therefore designed to assess the health risk that can be associated through the collection of production and consumption data.
Material & Methods
Study Areas
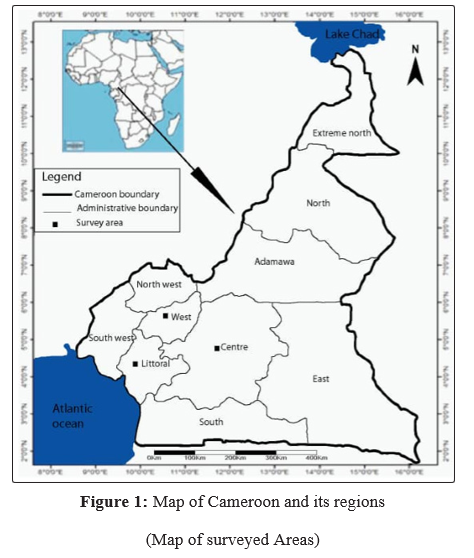
The study was conducted in three regions of Cameroon: the Centre, the Littoral and the West regions (Figure 1). The Central region covers 68.926 km2 and is composed of rolling hills on a vast plain with a mean altitude of 700–800 m, with lowered mounds. The climate has two wet seasons [18,19]. The Littoral region is covering an area of 20.239 km2 and housing more than 2.202.340 inhabitants. The population density is 124 inhabitants/ km2. The climate is humid and rainy. The west region covers 13.872 km2 and is mountainous, marked by highlands with a mean altitude of 1600 m and narrow valleys with catchments separating them. The climate has a unimodal wet season. The population density is relatively high, with about 143 inhabitants/km2 [18,19].
Questionnaire Design and Survey Data Collection
The survey was conducted between August, 2017 and April, 2018 using a questionnaire that was preliminary tested for better precision of the questions. A set of preliminary questionnaire was prepared as described by Baseline Survey: Household Survey Manual (FAnGR Asia Project Publication No: 2) this was field tested with 50 households [20]. In this pilot survey much attention was given to any new information, which was not designed to ask but was important and informative towards the objectives. Thus necessary modifications were made based on the feedback and the final questionnaire was prepared on the basis of the pilot survey. The structured questionnaire with both open-ended and closed questions was then applied to a total of 905 voluntary households who were randomly surveyed from selected study areas (502 households in the Center, 302 in the Littoral, and 84 in the West regions). The questionnaire consisted of 29 questions was divided in four main parts; socio-economic characteristics, chicken and eggs consumption and influencing factors, and risk perception
Data Analysis
Data obtained through questionnaires were coded, edited and entered in a data base system using Microsoft Excel software. Data were then exported to the Statistical Package for the Social Science 20.0 (SPSS). Descriptive statistics were used to summarize data as means and standard errors for continuous variables, and percentages for categorical variables. Pearson correlation coefficient was used to present relationship between variables. Variables with p-values under 0.05 were considered significant at 95% confident interval (CI). Chicken and eggs of different prices were bought, feathered and weighted at the laboratory. Weights obtained were used to estimate the number of chicken and egg consumed in each household surveyed in kilograms.
Results
Characteristics of Participating Household
As presented in table 1 participating households were mainly in the Center region (57%), 34 % in the Littoral and 9 % in West. Most respondents were female (61%). The age ranged between 17 - 21 years old (37%); 22-30 years (40%); 31-40 years old (13%); 41-51years old for 6%, and more than 50 year old (4%) but average ages were 28.8±10.9 year old for the Center, 22.5±6.5 years old for the Littoral and 28.9±12.1 years old for the West. Amongst respondents, 88 % percent were Christian, while 44% had a higher level of study and 54% of were pupil/students. The average sizes of numbers of person in the household were 5.4±3.7, 4.8±2.7 and 5.5±3.1 persons in the Center, Littoral and West regions respectively. Considering each household member, average sizes of children were 2.7±1.7, 1.9±1.0 and 2.3±1.3 for the Centre, Littoral and West respectively, while 2.0±1.2, 1.6±0.9 and 2.1±1.3 were the average sizes of teenagers for the same regions. Average sizes for adults in the Centre, Littoral and West region were as follow, 2.4±1.4, 2.5±1.5 and 2.1±1.3, while average sizes of elderly persons were 1.6±1.2 for the Center, 1.3±0.5 for the Littoral and 1.5±0.5 for the West regions. Household members were weighted according to their age and global weight averages for the three studied areas were found to be (25.2 ± 10.4) kg for children (4-12 years old); (54.0 ± 11.6) kg for teenagers (13-19 years old); (71.7 ± 11.3) kg for adults (20-59 years old) and (76.2 ± 13.9) kg for elderly persons (≥60 years old).
Table 1: General Information of Households in Each Region (N= 905)
|
Factor group |
Sub-group |
Number of household respondent in subgroup in Center (%) |
Number of household respondent in subgroup in Littoral (%) |
Number of household respondent in subgroup in West (%) |
Total (%) |
|
Sex |
Female |
340 (65.5) |
161(53.3) |
52 (61.9) |
553 (61.1) |
|
Male |
179 (34.5) |
141 (46.7) |
32 (38.1) |
352 (38.9) |
|
|
Overall (%) |
519 (100.0) |
302 (100.0) |
84 (100.0) |
905(100.0) |
|
|
Age |
17-27 |
299 (57.6) |
256 (84.8) |
52 (62.0) |
607 (67.1) |
|
28-38 |
129 (24.9) |
41 (13.6) |
17 (20.2) |
187 (20.7) |
|
|
39-49 |
58 (11.2) |
2 (0.6) |
7 (8.3) |
67 (7.4) |
|
|
50-60 |
24 (4.6) |
2 (0.6) |
7 (8.3) |
33 (3.6) |
|
|
>60 |
9 (1.7) |
1 (0.4) |
1 (1.2) |
11 (1.2) |
|
|
Level of study |
No education |
20 (3.9) |
6 (2.0) |
7 (8.3) |
33 (3.6) |
|
Primary |
108 (20.8) |
6 (2.0) |
15 (17.9) |
129(14.3) |
|
|
Secondary |
175 (33.7) |
164 (54.3) |
14 (16.7) |
352 (39.0) |
|
|
University |
216 (41.6) |
126 (41.7) |
48 (57.1) |
390 (43.1) |
|
|
Number of person’s interval |
1-5 |
292 (56.3) |
190 (62.9) |
41(48.8) |
523(57.8) |
|
6-10 |
199 (38.3) |
102 (33.8) |
38 (45.3) |
339(37.5) |
|
|
11-15 |
24 (4.6) |
9 (3.0) |
5 (6.0) |
38 (4.2) |
|
|
16-20 |
2 (0.4) |
1(0.3) |
0 (0.0) |
3 (0.3) |
|
|
21-50 |
2 (0.4) |
0 (0.0) |
0 (0.0) |
2 (0.2) |
|
|
Profession |
Unemployed |
20 (3.9) |
16 (5.3) |
8 (9.5) |
44 (4.9) |
|
Civil servant |
61 (11.8) |
12 (4.0) |
12 (14.3) |
85 (9.4) |
|
|
Worker |
223 (43.0) |
40 (13.2) |
26 (31.1) |
289 (31.9) |
|
|
Pupil/Student |
215 (41.4) |
234 (77.5) |
38 (45.3) |
487 (53.8) |
|
|
Monthly household incomes |
<10,000 Fcfa |
34 (6.6) |
26 (8.6) |
14 (16.7) |
74 (8.2) |
|
10,000-50,000 |
102 (19.6) |
98 (32.4) |
33 (39.3) |
233 (25.7) |
|
|
50,000-100,000 |
288 (55.5) |
137 (45.4) |
27 (32.1) |
452 (49.9) |
|
|
>100,000 |
95 (18.3) |
41 (13.6) |
10 (11.9) |
146 (16.2) |
Table 2: Repartition of Households in Terms of Consumption in Each Region (N=905)
|
Region |
Matrices |
Level of consumption |
Number of household (%) |
Average amount (kg) |
|
Center |
Chicken |
Weak consumer (< 5 kg/month) |
480 (92.5) |
4.0± 0.1 |
|
Average consumer ( 5 - 30 kg/ month) |
27 (5.2) |
22.2 ± 0.2 |
||
|
Big consumer (> 30 kg/month) |
12 (2.3) |
47.4 ± 4.8 |
||
|
Eggs |
Weak consumer (< 5 kg/month) |
391 (75.3) |
2.4 ±0.2 |
|
|
Average consumer ( 5 - 30 kg/ month) |
81 (15.6) |
19.4 ± 0.4 |
||
|
Big consumer (> 30 kg/month) |
47 (9.1) |
47.2 ± 0.3 |
||
|
Littoral |
Chicken |
Weak consumer (< 5 kg/month) |
292 (96.7) |
3.2 ±0.1 |
|
Average consumer ( 5 - 30 kg/ month) |
6 (2.0) |
21.2 ± 0.3 |
||
|
Big consumer (> 30 kg/month) |
4 (1.3) |
61.8 ± 14.0 |
||
|
Weak consumer (< 5 kg/month) |
230 (76.2) |
2.3 ± 0.2 |
||
|
Average consumer ( 5 - 30 kg/ month) |
72 (23.8) |
20.5 ± 2.6 |
||
|
Big consumer (> 30 kg/month) |
0 (0.0) |
0 |
||
|
West |
Chicken |
Weak consumer (< 5 kg/month) |
79 (94.0) |
3.4 ± 0.3 |
|
Average consumer ( 5 - 30 kg/ month) |
3 (3.6) |
18.7 ± 0.4 |
||
|
Big consumer (> 30 kg/month) |
2 (2.4) |
38.2 ± 1.4 |
||
|
Eggs |
Weak consumer (< 5 kg/month) |
48 (57.1) |
2.9 ± 1.2 |
|
|
|
Average consumer ( 5 - 30 kg/ month) |
36 (42.9) |
40.5 ± 1.1 |
|
Big consumer (> 30 kg/month) |
0 (0.0) |
0 |
||
|
|
|
|
Table 3: Estimated Amounts of Chicken and Eggs Consumed By Each Household Member
|
Household members |
Monthly averages of estimated amounts consumed (Kg) |
|
|
Chicken meat |
Chicken egg |
|
|
Children (4- 12 years old) |
2.7 ± 1.5 |
0.6 ± 0.04 |
|
Teenagers (13-19 years old) |
5.2 ± 2.4 |
0.7 ±0.05 |
|
Adults (20 -59 years old) |
4.0 ±1.9 |
0.8 ± 0.05 |
|
Aged people (60 years old and more) |
7.1 ± 4.4 |
0.6 ± 0.1 |
|
Global |
5.5 ± 0.3 |
2.5 ± 0.1 |
Table 4: Factor Influencing Chicken and Eggs Consumption: Statistic Values
|
Matrices |
Factor influencing consumption (a) |
X2 |
p-value |
|
Chicken |
Surveyed area |
288.158 |
0,001 |
|
household monthly incomes |
6596.773 |
0.000 |
|
|
Number of persons in the household |
2093.988 |
0.000 |
|
|
Eggs |
Surveyed area |
303.551 |
0,000 |
|
Household monthly incomes |
3961. 499 |
0.000 |
|
|
Number of person in the household |
3469.591 |
0,000 |
(a)Influencing significantly
Chicken and Eggs Consumption and Influencing Factors
All respondents in the three regions affirmed to consume chicken, while 99.8 % affirmed to consume eggs. The averages of amounts of chicken and eggs monthly consumed were estimated at (6.4 ±0.4) and (2.5±0.1) kg, (4.4±0.5) and (2.4±0.2) kg, (4.5± 0.8) and (3.1±0.5) kg for the Center, Littoral and West regions respectively (Table 2). In the three regions, households are mainly in the category of weak consumers of chicken and eggs, which means a consumption of less than 5 Kg/month. However, 42.9% of respondents in the west region appear to be average consumers of eggs (5-30 Kg/ month). Amounts of chicken and eggs consumed by each household were summarized and divided by the total number of persons in household surveyed in order to estimate per capita consumption for each surveyed area and values obtained in kg for both chicken and eggs per month (per year) were 1.2 (14.4) and 0.5 (6), 0.9 (10.8) and 0.5g (6), 0.8 (9.6) and 0.6 (7.2) for the Centre, Littoral and west regions, respectively. By summarizing per capita consumption of each region and dividing by three the per capita chicken consumption for all the study areas was found to be 1kg/month (12 kg/year) and 0.5kg (6 kg /year). Consumption of chicken and eggs was influenced by the area, household monthly incomes and number of person in the household (Table 4). Indeed, significant correlations were observed between amount of chicken monthly and number of person in the household (r2=0.093, p=0.033) in one way and between amount of eggs consumed and number of person in household (r2 =0.475, p=0.000) in on other way. A significant correlation (r2=0.280, p=0.000) was also observed between amounts of chicken monthly consumed and household incomes. Estimated monthly amounts averages (Kg) of chicken and eggs consumed by each person of the household according to their age for the three areas surveyed together are presented in table 3. Elderly people consume more chicken than any other household’s person and the same amount of eggs than children. Indigenous or backyard chickens (domestic chickens), exotic farming chickens including both broiler and layers (scavenging chickens), frozen chicken (industrial chickens and imported), exotic farming layer eggs and indigenous or villager eggs were well consumed and purchased amongst households. Indigenous chicken and eggs were more appreciated (100%), but practically farming broiler (80%) and layer egg (85%) were more consumed. Frozen chickens were also consumed but in low percentage (4.6%). Chicken was more consumed in tomato soup (89.5%) than any other of soup including groundnut soup (32%), pistachio soup (23.9%) and okra soup (10.8%). Chicken was also consumed as fried chicken only (70.4%), braised chicken (38.6%), smoked chicken (16.5%) and others chicken prepared forms (25.1%). Habit consumption of eggs included scrambled eggs (84.1%), boiled eggs (79.1%), simple fried eggs (72.2%), pistachio (16.5%), “sauted” eggs (13.6%), and other egg cooking forms (13.6%).
Risk Perception
Only 230 households affirmed to be aware of the usage of chemicals in chicken farming, while 675 (74.6%) were not. Amongst households aware of the usage of chemicals in chicken farming, 220 (95.6%) affirmed that chemicals are improper used by farmers during chicken farming. Ninety six households (10.6%) affirmed that all chicken types could present the same risk when consumed. One hundred and ninety (21.0%) households affirmed that chicken and eggs could have side effects on human health. Both chickens and eggs were reported to be mainly purchase at market, and secondary in farm, street, shop, and fisheries in all the areas. The respondents were also asked to indicate whether they usually wash raw chicken before cooking and results are presented in table 2. Twenty five percent (25%) of respondents in the center, 16 % in the Littoral and 1% in the West affirmed to wash chicken eggs before cooking.
Discussion
Our results indicated that chicken and eggs are consumed by the majority of households but in different amounts leading to their repartition as weak, average and big consumers for both chicken and eggs. The majority of households were classified as weak consumers (94.0%) for both chicken and eggs (73.9%). Per capita consumption amounts for chicken 12kg/year and eggs 6kg/year for the study areas were higher than those reported in previous study (4 kg for chicken and 0.9 kg for eggs) [21,22]. In fact, since 1960, overall chicken production has considerably grown than that of any other type of meat in both developing and developed countries as highlighted in previous study [23]. Furthermore nowadays, people are aware about chicken and egg’s high nutrients necessary for human health [24]. However, the level of consumption observed in our study is lower than those reported in developed countries like Chine, United States and European Union annually in previous studies [5,6,14]. Chicken (100%) was more likely than eggs (99.4%). Previous studies reported that chicken eggs were not more appreciated in Turkey because of their cholesterol contain that may has health concerns [13,24-26]. Level of chicken consumption was higher in the Center region followed by the Littoral region and weak in the West. Contrarily, level consumption of eggs was higher in the West region and weak and equal for Center and Littoral regions. This variation amongst surveyed areas is strengthened by significant correlation. As showed in table 3, elderly person consumed more chicken than any other household person, while they consumed less and the same amounts of eggs as children. This observation could be explained by the fact that majority of elderly persons surveyed was living alone and/ or with the small children and consumption depends to the age. Chicken and egg consumption was significantly influenced by the area, household monthly incomes and the number of persons in the household (Table 4). Aral et al., and Hadidjah Elly et al., reported that consumer income level, demographic factors, and product prices are generally thought to be the major factors that have an effect on the demand for chicken products [3,27]. Chickens produce locally were preferred than imported (frozen) chickens. Similar observations were reported by Dupraz and Awono, in Yaoundé and Femi Hadidjah Elly et al., in North Minahasa regency, where local fresh chicken were more preferred than imported ones [16,27]. Only 25.4% (230) of households surveyed were aware of the use of chemicals in chicken farming by farmers. Gondam et al., and Guiteya et al, reported that veterinary drugs are improper used by farmer in chicken farming in Cameroon [15,17]. These latter reported that the use of antibiotics as growth promoters in developing countries such as Cameroon, allows Cameroonian to purchase at reasonable cost, high quality meat and eggs. The non-awareness of households could result in a great risk of exposition because more awareness could exhibit more care. In fact, veterinary drugs used in chicken farming could result to non-desirable residues in chicken meat and eggs [28]. These non-desirable residues found in chicken meat and eggs may have side effects on consumer health [8,29-31]. The level of risk could also be increased by the lack of any traceability on the origin of products bought as observed during this study. In fact, it was observed that chicken and eggs were from unknown origin and bought anywhere and place (table 3). A study conducted by Koppel et al., on consumer practices for purchase, storage, and preparation of poultry and eggs in selected north and south American countries in 2015 showed that, several steps in the food production and distri¬bution system could be responsible for food con¬tamination; however, consumers often are the last ones to manipulate food before consumption and ultimately are responsible for any mishandling at home [32,33]. Manipulations of raw chicken through feathering and washing in the market, and washing before cooking as observed during these surveys could lead to contamination. In fact, feathering of chicken in the market could present several risks as cross contamination due to the use of the same water and knives used by many persons for chickens from different origins. Purchasing of chicken at fishery as register during this study presents also a risk of cross contamination because as chickens are not wrapping, many people could touch them living contaminants. Due to these observations it can be drawn that amongst area surveyed, risk perception could be great if consumers are not sensitized. The percentages of washing raw eggs before cooking observed in this study were less common as in Asian country but lower than those observed in Estonia and Italy, where 29 % and 44 % of consumers affirmed to wash raw eggs before cooking [32,33]. According to the Food Safety and Ins¬pection Services on-line materials washing raw meats and poultry is not recommended due to possible cross-contamination to kitchen surfaces [34]. So consumers could be exposed to both chemical and microorganisms founded in chicken and eggs as reported by Darko et al., Marshall and Levy and Odwar et al, [28,35-37]. This risk of exposition could be great for big consumers.
Conclusion
Chicken and eggs are consumed but in different amounts from one household to another and to one region to another; this lead to classify households as big, average and low consumer for both chicken and eggs. Per capita consumption of eggs is high in the west region and low in the Littoral. Elderly people and teenagers consumed more chicken, while children and teenagers consumed more eggs. Chickens and eggs consumption is affected by the locality, household incomes and household member’s number. Risk perception showed that risk factors are several, really perceived in different ways and could have great side effects on consumer health. Therefore attention should be paid to chicken and eggs origins and recommendation for the Food Safety and Ins¬pection Services on-line materials during handling chickens and eggs intended for consumption.
References
- Altan O, Yalcın S, Kocak C (1993) Egg consumption habits and factors affecting my consumption in different segments of the society. International Poultry Congress, Istanbul 178-194.
- Moretain JP (2005) Residues of antibiotics in food. Study and research laboratory for veterinary drugs and disinfectants, French Food Safety Agency (AFSSA), France pp 18.
- Yılmaz Aral, Erol Aydin, Pınar Demir, Ahmet Cumhur Akin, Yavuz Cevger, et al. (2013) Consumer preferences and consumption situation of chicken meat in Ankara Province, Turkey. Turkish Journal of Veterinary and Animal Sciences 37: 582-587.
- A Paryad, M Mahmoudi (2008) Effect of different levels of supplemental yeast (Saccharomyces cerevisiae) on performance, blood constituents and carcass characteristics of broiler chicks. African Journal of Agricultural Research 3: 835-842.
- Yum-Bir (2016b) Turkish Egg Producers Association (YUMBIR) Layer Farming Data. Ankara: Yumbir Publications.
- Food and Agriculture Organization. Commodities by country (2011) Available at http://faostat.fao.org/site/339/default.aspx.
- Food and Agriculture Organization (2017) Crops and livestock primary and processed, Available at: http://www.fao.org/ faostat/en/#data/QL.
- Goetting V, Lee KA, Tell LA (2011) Pharmacokinetics of veterinary drugs in laying hens and residues in eggs: a review of the literature. Journal of veterinary pharmacology and therapeutics 34: 521-556.
- Ronald E Baynes, Keith Dedonder, Lindsey Kissell, Danielle, Mzyk, et al. (2016) Health concerns and management of selected drug residues. Food and Chemical Toxicology 88: 112-122.
- Van Horne PLM and Achterbosch TJ (2008) Animal Welfare in Poultry Production Systems: Impact of EU Standards on World Trade. World’s Poultry Science Journal 64: 40-52.
- FAO/WHO (2011) Joint expert meeting on dietary exposure assessment methodologies for residues of veterinary drugs: Final report including report of stakeholder meeting. Rome, Italy.
- United States Environmental Protection Agency (USEPA) (2012) Poultry Production Phases http://www.epa.gov/ agriculture/ag101/poultryphases
- Cengizhan Mizrak, Ismail Durmus, Serdar Kamanli, Sahnur Erdogan Demirtas, Süleuman Kalebasi, et al. (2012) Determination of egg consumption and consumer habits in turkey. Turkey. Turkish Journal of Veterinary and Animal Sciences 36: 592-601.
- Haifeng Zhang, Jun Wang, Wayne Martin (2018) Factors affecting households’ meat purchase and future meat consumption changes in China: a demand system approach. Journal of Ethnic Foods 5: 24-32.
- RE Guetiya Wadoum, NF Zambou, FF Anyangwe, JR Njimou, MM Coman, et al. (2016) Abusive use of antibiotics in poultry farming in Cameroon and the public health implications, British Poultry Science 57: 483-493.
- Cathie Laroche Dupraz and Cyprien Awono (2009) Patterns and determinants of urban chicken consumption in Haiti and Cameroon: similar contexts, differentiated prospects. Working Paper SMART-LERECO N° 09-16.
- Mélanie Gondam Kamini, Fabrice Tatfo Keutchatang, Huguette Yangoua Mafo, Germain Kansci and Gabriel Medoua Nama (2016) Antimicrobial usage in the chicken farming in Yaoundé, Cameroon: a cross-sectional study. International Journal of Food Contamination 3: 10.
- BUCREP (Central Bureau of the Census and Population Studies) (2010) Censuses of the Cameroonian population. Presses du BUCREP.
- NIS-National Institute of Statistics (2006) Cameroon.
- Baseline Survey (2019) Household Survey Manual: Development and application of decision support tools to conserve and sustainably use genetic diversity in indigenous livestock & wild relatives. FAnGR Asia Project Publication No: 2.
- Emil Teleu Ngandeu, Alexandre Ngatchou (2006) First Assessment of the Poultry Sector in Cameroon: Structure and importance of the commercial and family poultry sector for a better understanding of the issue of Avian Influenza. Emergency assistance for the control and prevention of Avian Influenza Representation FAO Yaoundé, Cameroun pp 01-48
- MINEPIA-Ministry of Livestock, Fisheries and Animal Industries (2009) Master Plan for the Development of Livestock Industries in Cameroon Volume II: Cartography of the Paths 82p
- HS Chang (2007) Overview of the World Broiler Industry: Implications for the Philippines, Asian Journal of Agriculture and Development 4: 67-82.
- Khalid Zaheer (2015) An Updated Review on Chicken Eggs: Production, Consumption, Management Aspects and Nutritional Benefits to Human Health. Food and Nutrition Sciences 06: 12.
- Deborah J Brown, Lee F Schrader (1990) Cholesterol Information and Shell Egg Consumption. American Journal of Agricultural Economics 72: 548-555.
- Jang Yel Shin, Pengcheng Xun, Yasuyuki Nakamura, Ka He (2013) Egg Consumption in Relation to Risk of Cardiovascular Disease and Diabetes: A Systematic Review and Meta-Analysis. Am J Clin Nutr 98: 146-159.
- Femi Hadidjah Elly, Merry Manese, Nansi Margret Santa and Ingriet Deybie Rinny Lumenta (2015) Analysis of Livestock Product Consumption Coastal Household in North Minahasa Regency. Procedia Food Science 3: 364-370.
- Godfred Darko, John Kenneth Mensah, Sylvester Samuel Dapaah and Judith Odei (2015) Estimated dietary exposure to veterinary residues in chicken and eggs. International Journal of Food Contamination 2:16.
- Odwar JA, Kikuvi G, Kariuki JN and Kariuki S (2014) A cross-sectional study on the microbiological quality and safety of raw chicken meats sold in Nairobi, Kenya. BMC Research Notes 7: 627.
- MA Hamid, MA Rahman, S Ahmed and KM Hossain (2017) Status of Poultry Industry in Bangladesh and the Role of Private Sector for its Development. Asian Journal of Poultry Science 11: 01-13.
- Aulakh MS, JW Doran and AR Mosier (2006) Soil denitrification-significance, measurement, and effects of management 1992. Advances in Soil Science18: 01-57.
- Koppel K, Timberg L, Shalimov R, Vazquez-Araujo L, Carbonell- Barracchina AA, et al. (2015) Purchase, storage, and preparation of eggs and poultry in selected European countries: A preliminary study. Brit. Food J 117: 749-765.
- Koppel K, Suwonsichon S, Chitra U Lee J and Chambers EIV (2014) Eggs and Poultry Purchase, Storage, and Preparation Practices of Consumers in Selected Asian Countries. Foods 3: 110-127.
- FSIS (2013a) Food safety factsheets. Washing food: does it promote food safety? Available in: http://www.fsis.usda.gov/ wps/portal/fsis/topics/food-safety-education/get-answers/food-safety-fact-sheets/safe-food-handling/washing-food-does-it-promote-food-safety/washing-food.
- FAO (2009) Survey of consumer preferences for poultry products in Phnom Penh and Siem Reap, Cambodia. Prepared by Suon Seng and Olaf Thieme. AHBL - Promoting strategies for prevention and control of HPAI. Rome.
- Bonnie M Marshall, Stuart B Levy (2011) Food Animals and Antimicrobials: Impacts on Human Health. Clin Microbiol Rev 24: 718-733.
- Odwar JA, Kikuvi G, Kariuki JN and Kariuki S (2014) A cross-sectional study on the microbiological quality and safety of raw chicken meats sold in Nairobi, Kenya. BMC Res. Notes 7: 627.