International Journal of Aerospace Science, Technology and Engineering(IJASTE)
ISSN: 3068-4536 | DOI: 10.33140/IJASTE


Research Article - (2026) Volume 2, Issue 1
Comparative Study of Numerical and Experimental Aerodynamic Performance of NACA4412 Wind Turbine Airfoil Blade Section Under Atmospheric Icing Conditions
2ELTE Eotvos Lorand University, Faculty of Science, Doctoral School of Environmental Science, Budapest, Hungary
Received Date: Feb 16, 2026 / Accepted Date: Mar 28, 2026 / Published Date: Apr 21, 2026
Copyright: ©2026 Ronald Okoth, et al. This is an open-access article distributed under the terms of the Creative Commons Attribution License, which permits unrestricted use, distribution, and reproduction in any medium, provided the original author and source are credited.
Citation: Rotich, I., K., Okoth, R. (2026). Comparative Study of Numerical and Experimental Aerodynamic Performance of NACA4412 Wind Turbine Airfoil Blade Section Under Atmospheric Icing Conditions. Int J Aerosp Sci Technol Engg, 2(1), 01-13.
Abstract
Wind energy is an emerging renewable energy but its reliability in cold regions is significantly affected by atmospheric icing. Ice accretion alters airfoil profiles by reducing energy production and increasing operational risks and maintenance costs. This study focused on the prediction of aerodynamic performance of iced airfoil blade sections through numerical approach using ANSYS Fluent and FENSAP ICE. The results obtained were verified with the experimental studies in a closed loop wind tunnel that was equipped to replicate the conditions for in-cloud icing phenomena.
The ice accretion was numerically simulated with the aid of FENSAP ICE on NACA4412 airfoil at given conditions such as Liquid water content (LWC) of 0.8 g/m3 , 1.6 g/m3 , and 4.9 g/m3 , angle of attack of α=0 ° to 15 ° , and median volume diameter (MVD) of 50 μm, 51 μm and 54 μm. Temperatures of -4° C and -17° C were considered during the experimental set up and numerical calculations to correspond to the in-cloud temperatures for glaze and rime ice occurrence during Icing. The experimental findings were done in an icing wind tunnel using NACA4412 airfoil blade section during which the LWC, angle of attack and ambient temperature were varied while maintaining the velocity constant at 20m/s. The experimental aerodynamic performance findings showed similar trends with numerical findings. It was observed that an increase in LWC and angle of attack with decrease in temperature led to an increase in ice mass accreted on the airfoil section. The ice shapes were found to be nearly the same for both the numerical and experimental set ups. In both cases, aerodynamic performance was found to decrease gradually with increase in LWC, angle of attack and ice accretion time.
Keywords
Wind Energy, Atmospheric Icing, Liquid Water Content (LWC), Median Volume Diameter (MVD), Aerodynamic Performance, ANSYS Fluent and FENSAP ICE, Icing Wind Tunnel
Introduction
In recent years, the global energy scene has been marked by a significant increase in demand. In 2023, global energy consumption grew by 2.3%, surpassing the average annual growth rate by 1.5% that had been observed between 2010 and 2019 [1]. In the international Energy Agency (IEA) world energy outlook 2023, it emphasized the critical role of renewable energy in meeting the future energy need while ensuring energy security and fostering economic development. The report also recommended cost effective ways to bend the emissions curve downwards by 2030. These included Tripling renewable energy capacity, doubling the pace of energy efficiency improvements to 4% per year, ramping up electrification and slashing methane emissions from fossil fuel operations that would together provide more than 80% of the emissions reductions needed by 2030 to put the energy sector on a pathway to limit warming to 1.5 °C [2].
Within the renewable energy spectrum, wind energy has emerged as a pivotal contributor. The Global Electricity Review 2023 highlights that clean energy generation, led by wind and solar, is anticipated to grow significantly, outpacing the projected demand and increase. The report also acknowledged that Wind and solar had reached a record 12% of global electricity in 2022[3]. The total installed wind power has been on a constant rise with estimated power produced being 6.6 % (837 GW) as of 2020 [4]. The wind energy in cold regions is influenced by seasonal variability due to geographical locations [5,6]. It has been observed that in cold regions, the power output is expected to rise due to an increase in air density and velocity stratifications. About 20 % of wind power energy potential is found in icing regions with an annual energy production (AEP) loss estimated to be about 20 % to 50 % [7,8]. Wind turbines in cold regions experience a challenge due to accumulation of ice on the blades impacting aerodynamic performance, power output and structural integrity [9-11]. estimated that 94 %, 72 %, and 19 % of Europe, North America, and Asia respectively encounter icing events that affect wind turbines in these regions.
The use of experimental studies has been found to provide valuable detailed icing studies. Numerical models based on computational fluid dynamics (CFD) have recently been used in icing studies due to their cost and its time consuming [12,13] Theoretical icing incorporates complex Mathematics and Physics in the models used in predicting analytical accretion solutions such as FENSAP ICE, TURBICE, MULTI-ICE and Open-FOAM [14-16]. Several studies using these models have been widely used in predicting ice accretion in varying conditions [17-21]. However, numerical studies alone are insufficient without validation. Experimental studies are necessary to confirm the accuracy of CFD predictions and ensure realistic representation of icing effects. While only a few institutions worldwide have dedicated icing wind tunnels, many studies rely on CFD-generated iced airfoils rather than physical testing. In our institution, that is Eotvos Lorand University (ELTE),we have access to an icing wind tunnel, which provides a unique opportunity to validate CFD findings against real-world conditions. By integrating both numerical and experimental approaches, this study aims to enhance the reliability of icing models and contribute to the development of effective mitigation strategies for wind turbine performance in cold climates by comparative study of numerical and experimental aerodynamic performance of wind turbine airfoils under atmospheric icing conditions.
Research Objectives
The main objective of this research is to compare the aerodynamic performance of wind turbine blade section under atmospheric icing conditions using both numerical and experimental approaches.
To achieve this, the study is guided by the following specific objectives.
1. To numerically investigate the effects of icing on the aerodynamic performance of wind turbine blade sections by varying wind velocity, angle of attack, liquid water content (LWC), and evaluating changes in the lift-to-drag ratio.
2. To experimentally examine and quantify the real-time aerodynamic degradation of iced wind turbine blade sections in a controlled wind tunnel environment by systematically varying wind velocity, angle of attack, and LWC, while measuring lift and drag.
3. To validate the numerical simulation results against experimental data to ensure accuracy and reliability, establishing a correlation between predicted and observed aerodynamic behavior under icing conditions.
Methodology
Computational Domain and Boundary Conditions
To ensure that there was a minimal boundary effect while maintaining accurate flow over the airfoil, the computational domain was carefully designed. The domain extended to 5 and 14 chord length from the leading and trailing edge respectively as shown in figure 1 ensuring accurate capture of flow disturbances in ANSYS Fluent. This was done to capture wake characteristics which could have led to stabilization and reduction in vortex shedding phenomena as described in [22]. The k - ![]() SST turbulence model was used to help in capturing far field flows that would prevent numerical reflections, and which ensured that solutions remained independent in the boundary conditions. The triangular mesh was considered with a growth rate of 1.05 %, near the airfoil, the boundary layer with a first layer thickness which corresponded to a non-dimensional wall distance obtained from y+ < 1 with the first layer thickness of 1.43 × 10⁻⁵ m with the 45th layer being 2.78 × 10⁻⁵ m. A steady state solver was considered with an appropriate time stepping of 300 and grid convergence of 1 × 10⁻⁶.
SST turbulence model was used to help in capturing far field flows that would prevent numerical reflections, and which ensured that solutions remained independent in the boundary conditions. The triangular mesh was considered with a growth rate of 1.05 %, near the airfoil, the boundary layer with a first layer thickness which corresponded to a non-dimensional wall distance obtained from y+ < 1 with the first layer thickness of 1.43 × 10⁻⁵ m with the 45th layer being 2.78 × 10⁻⁵ m. A steady state solver was considered with an appropriate time stepping of 300 and grid convergence of 1 × 10⁻⁶.
The first layer thickness y1 was calculated to ensure that the y+ value at this was less than 1.This is achieved by rearranging the
![]()
the fluid, uT represented the friction velocity which depends on the flow conditions such as freestream velocity, Reynolds number, and wall shear stress,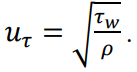 Ensuring y+ < 1 was important because it would allow the solver to accurately resolve the viscous sublayer, where viscous effects dominate, ensured that the near-wall turbulence models that is k–
![]() , and k–
, and k–![]() in involved in the k–
in involved in the k–![]() SST model could correctly predict the flow behavior. Generated mesh from ANSYS Fluent was then exported to a readable file used in FENSAP ICE to study icing.
SST model could correctly predict the flow behavior. Generated mesh from ANSYS Fluent was then exported to a readable file used in FENSAP ICE to study icing.

Figure 1: Rectangular Computational Domain with the mesh and its boundaries.
The geometry used for computational modelling was NACA 4412 and it corresponded to the experimental model. Other parameters used during the numerical and experimental set up are as shown in table 1.
|
Airfoil |
NACA4412 |
|
Chord length (m) |
0.2 |
|
Spanwise length (m) |
0.5 |
|
MVD (µm) |
50, 51, 54 |
|
LWC (g/m3) |
0.8, 1.6, 4.9 |
|
Velocity (m/s) |
20 |
|
AoA (°) |
0, 5, 10, 15, |
|
Temperature (°C) |
-4 °C, -17 °C |
|
Accretion time (mins) |
20 |
Table 1: Operating parameters of Airfoil NACA 4412 used in the numerical and Experimental modelling
Icing Simulation
Icing on the airfoil occurs when supercooled water droplets impact on the airfoil surface (wall) and freeze upon contact. In this study, the icing process was simulated using numerical software that is FENSAP – ICE. This approach involved the multiphase order in which the conditions varied from gas-liquid-solid that is incorporated in FENSAP-DROP3D-ICE3D software. Finite Element Navier-Stokes Analysis Package (FENSAP) is a computational fluid dynamics (CFD) tool used for simulating complex fluid flows, particularly in aerospace applications. Generally, FENSAP can solve incompressible, compressible, steady, unsteady, viscous and inviscid three-dimensional flows [23,24]. For incompressible flows FENSAP offers Euler equations, whereas for compressible flows FENSAP solves compressible Reynolds Averaged Navier-Stokes (RANS), also termed Favre-averaged Navier-Stokes equations [25]. The Eulerian method was used to model supercooled water droplets in the flow field, which would solve droplet transport equations. Convergence studies were performed to ensure numerical stability, with iterative solvers applied to balance mass, momentum, and energy conservation, whose fundamental equations are represented in equations 1, 2 and 3 respectively.
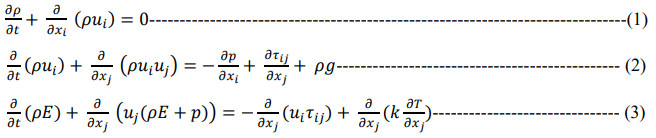
Whereby, p - Density of the fluid, u - Velocity of the fluid, p - The pressure, T - Temperature, E – Total energy, ![]() – Viscous stress tensor, k- Thermal conductivity, and g- acceleration due to gravity The DROP3D that is 3D Eulerian water droplet and ice crystal impingement module of the FENSAP-ICE system, was used to compute the impingement solution in a single, non- iterative pass that eliminated the need of laborious iterative droplet injection. It uses high-resolution discretization of partial differential equations to calculate droplet velocity fields and water concentration over the entire computational domain. The output included the mass of water captured by the airfoil, the droplet impingement limits, impingement patterns, droplet velocity vector and shadow zone characteristics. The mathematical model for DROP3D was introduced by Bourgault et al [26]. and it consists of the Navier-Stokes or Euler equations for viscous and inviscid air represented by continuity and momentum equations [27]. In non-dimensional form these equations are shown in equations 4 and 5 respectively.
– Viscous stress tensor, k- Thermal conductivity, and g- acceleration due to gravity The DROP3D that is 3D Eulerian water droplet and ice crystal impingement module of the FENSAP-ICE system, was used to compute the impingement solution in a single, non- iterative pass that eliminated the need of laborious iterative droplet injection. It uses high-resolution discretization of partial differential equations to calculate droplet velocity fields and water concentration over the entire computational domain. The output included the mass of water captured by the airfoil, the droplet impingement limits, impingement patterns, droplet velocity vector and shadow zone characteristics. The mathematical model for DROP3D was introduced by Bourgault et al [26]. and it consists of the Navier-Stokes or Euler equations for viscous and inviscid air represented by continuity and momentum equations [27]. In non-dimensional form these equations are shown in equations 4 and 5 respectively.
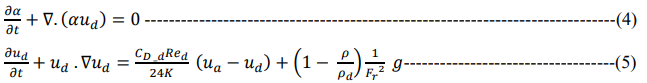
Whereby, ua - The air velocity, ![]() - Mean water fraction, ud - Mean droplet velocity, K- is the droplet inertia parameter, F_r – Froude number, and pd- the droplet density, Red - Droplet ICE3D is the 3D ice accretion module of the FENSAP-ICE system, also based on high resolution partial differential equations for the complex thermodynamics of ice formation. It yields 3D ice shape, water film thickness and surface temperature on any number of complex 3D surfaces [23].
- Mean water fraction, ud - Mean droplet velocity, K- is the droplet inertia parameter, F_r – Froude number, and pd- the droplet density, Red - Droplet ICE3D is the 3D ice accretion module of the FENSAP-ICE system, also based on high resolution partial differential equations for the complex thermodynamics of ice formation. It yields 3D ice shape, water film thickness and surface temperature on any number of complex 3D surfaces [23].
ICE3D was used to calculate the ice accretion rate based on the friction force and the heat fluxes obtained by FENSAP and the mass rate of water caught known from the impingement module DROP3D [25]. The model is based on a system of partial differential equations (PDEs) derived from the conservation of mass and energy, building upon the foundational work of the Messinger [28] model and further refined to account for ice accretion and water runback phenomena. The key equations, that is Mass Conservation and Energy conservation equations are presented in equations 6 and 5 respectively.
The integration of mass and energy conservation equations, along with empirical correlations for heat and mass transfer, ensured robust and accurate predictions in icing scenarios.
Experimental Set – Up
The experimental component utilized a closed-loop, horizontal wind tunnel located at the Fluid Mechanics Laboratory of the Savaria Institute of Technology, Eotvos Lorand University. The tunnel is capable of simulating flows around immersed objects as well as simulating icing processes by incorporating water injection and cooling systems making it unique in Central Europe. The wind tunnel used had a total length of 24m closed loop , Cross-section of the test section of 0.5 m × 0.5 m and a length of 1 m as shown in figure 2, Contraction ratio of 1:5, maximum velocity in the test section: 35 m / s, lowest temperature in the test section: -20°C,water injection through 3 nozzles, each with adjustable flow rate in the range of (10-100 cm3 ) / m in, insulated cabin around the test section, with an area of 5 m2 and inner height of 2.1 m. During the experiment, the nozzle opening and closing were controlled by duty cycle. This parameter aided in the determination of the flow rate of the nozzles and consequently, the liquid water content in the cloud produced.
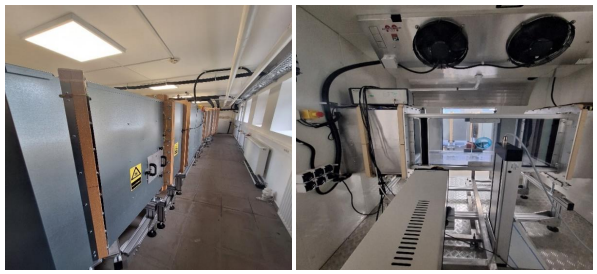
Figure 2:The closed-loop horizontal wind tunnel and its test section.
To simulate two-phase flows representative of in-cloud icing or precipitation icing, supercooled water droplets were introduced via nozzles, replicating a range of atmospheric conditions.
Experimental Determination of Median Volume Diameter (MVD)
The two-phase flows were modelled by injecting supercooled water droplets to create the cloud conditions with the help of atomizers which were adjusted into wide range of atmospheric conditions. The droplet size characteristic was considered using the PDPA in examining spatial distribution of the super cooled droplet generated on the SUJ11 vertical nozzles separated by 300 mm. These nozzles were manufactured by Spraying Systems Co. The PDPA signals were generated from the FSA 4800/5800 as transmitters whereas the generated beams were received on RV2100 module 500 mm apart from the Gaussian region (region of bright fringes). The laser intersecting angle was obtained to be 30° where Gaussian distribution had the ''butterfly point'' based on the refractive index between glass and air being 1.33 and the wave frequency of 532 nm. The data was captured using 5,000 maximum attempts with a real time capture of 1000 and by applying photomultiplier tube (PMT) voltage set to 500 V and burst threshold held at 200 mV. This was done to ensure that smaller droplets were captured. The data obtained were sent to readable data in BurstPro software where the distributions sizes were calculated using the equations based on ASTME799 - 03€1 standard to obtain characteristic diameters. For this study, the considered droplet diameters were d30 representing the average volume of the droplets as shown in equation [29].
Where di is the diameter of the ith droplet, and ni is the total number of the valid count droplets.
Based on the Droplet sizes, it is possible to calculate the Liquid water content (LWC) which is the measure of liquid water per unit volume of air in a cloud or spray. The formular in Equation 10 is applied to calculate LWC based on the droplet size distribution measured by the PDPA system and as applied by Knop et al., 2021 [30].
![]()
Where m water is the mass flow rate of injected water from the SUJ11 nozzles, ![]() is the is the percentage of the moistened cross-sectional area, Atestsection is the cross-sectional area of the test section and U
is the is the percentage of the moistened cross-sectional area, Atestsection is the cross-sectional area of the test section and U![]() is the tunnel velocity. During the experiment, the total obtained volume flow rate varied between 30 ml/min to 255 ml/ min depending on the air and water pressure and the duty cycles ranging between 20% to 80%. The test section cross-sectional area was 0.25 m2 and the percentage of the moistened cross-sectional area was set to 0.5 during calculation of the LWC based on equation 10.
is the tunnel velocity. During the experiment, the total obtained volume flow rate varied between 30 ml/min to 255 ml/ min depending on the air and water pressure and the duty cycles ranging between 20% to 80%. The test section cross-sectional area was 0.25 m2 and the percentage of the moistened cross-sectional area was set to 0.5 during calculation of the LWC based on equation 10.
Experimental Procedure
The liquid water content (LWC) and median volumetric diameter (MVD) of the droplets were controlled by precisely regulating the water and air pressures within the nozzle channels, as well as adjusting the nozzle duty cycle. The target LWC values were determined based on prior calibration experiments that had been carried out before. Table 2 specifies the air pressure settings applied at the nozzle for each corresponding water spray condition to achieve the desired LWC and MVD during experiments.
|
S/N |
Water pressure (Bars) |
Air pressure (Bars) |
Duty cycle (%) |
LWC (g/m3) |
MVD (µm) |
|
1. |
2.07 |
2.07 |
20 |
0.8 |
54 |
|
2. |
2.34 |
3.45 |
50 |
1.6 |
51 |
|
3. |
3.45 |
2.41 |
80 |
4.9 |
50 |
Table 2:Various operation conditions considered during icing experiments
During experiments, the wind tunnel velocity was held constant at 20 m/s, and data acquisition was performed at a sampling rate of 2 Hz over a 20-minutes duration. The angle of attack (<img src="https://www.opastpublishers.com/scholarly-images/10597-6a0af08ba5858-comparative-study-of-numerical-and-experimental-aerodynamic-.png" width="16" height="16">) was systematically varied from 0° to 15° to assess the aerodynamic forces acting on the airfoil across the specified flow conditions. At the conclusion of each trial, the accumulated ice mass was measured using a precision weighing balance to quantify ice accretion. The same procedure was followed for both -4°C and -17°C conditions, with the test room and the wind tunnel set to these respective temperatures. There were five load cells that were installed on the cross-sectional area of the test section. These cells were the primary means by which we measured the Aerodynamic forces generated by the airfoil as shown in figure 3. The raw analogue signals were then transferred to QuantumX MX840B (figure 4) where they were converted to digital signals using the HBM Catman software. The data obtained were then transferred to Excel for analysis and visualization.


Figure 3: Strain gauges set up used to measure forces acting on the airfoil section.

Figure 4: QuantumX MX840B data acquisition system and its connection to the Load cells.
Results and Discussion
Comparison of Numerical and Experimental Ice Mass Accretion
Tables 3,4 and 5 present the mass of ice accreted at liquid water content (LWC) of 0.8 g/m³, 1.6 g/m³, and 4.9 g/m³ respectively, for both -4°C and -17°C conditions after 20 minutes of accretion. The results indicated that the conditions at -17°C led to a greater mass of ice accretion compared to -4°C across all angles of attack. Furthermore, the mass of accreted ice increased with the angle of attack for -4°C and -17°C conditions. This trend suggested that higher angles of attack enhanced ice accumulation, likely due to increased droplet impingement and prolonged exposure to supercooled water droplets.

Table 3: Mass of ice accreted at Liquid water content of 0.8 g/m3
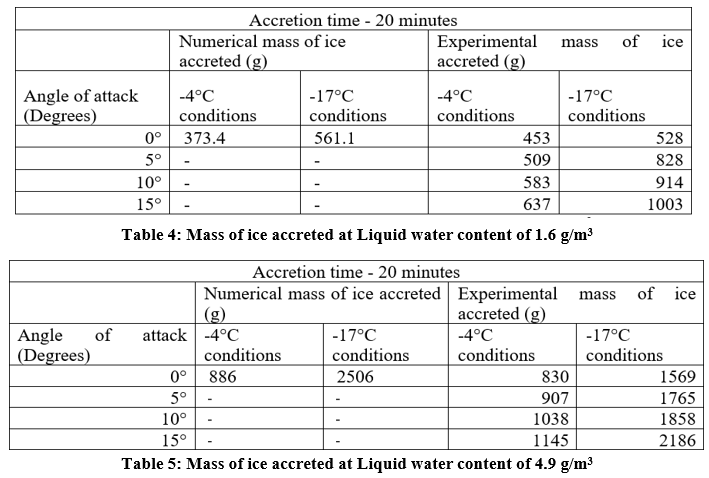
A comparison between numerical simulations and experimental data revealed that the numerically predicted ice accretion masses were slightly higher than those obtained experimentally, though the values remained within a close range. This agreement indicated that both numerical and experimental approaches could be reliably used to predict ice accretion mass under similar conditions. However, the observed discrepancies may be attributed to measurement tolerances in the experimental setup and conditions that were not modelled numerically such as the clearance between the aerofoil model and the top and bottom wall of the test section.
The experimental results further demonstrated that the masses of ice accreted on the airfoil section were directly proportional to the liquid water content (LWC) and angle of attack. Higher LWC and larger angles of attack consistently resulted in greater ice accumulation, highlighting the combined influence of these parameters on accretion rates as shown in Figures 5 and 6.
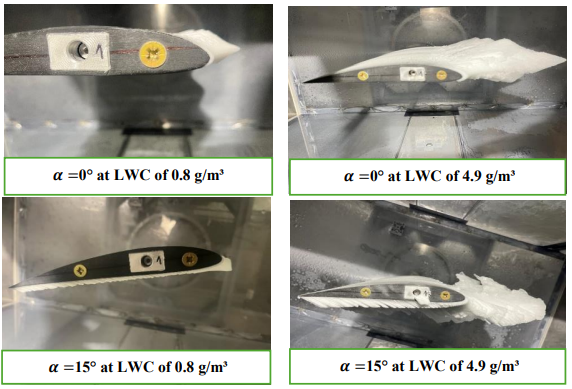
Figure 5: Comparison of Ice Accretion Mass at α = 0° and α = 15° Under -17°C Conditions with LWC of 0.8 g/m³ and 4.9 g/m³.
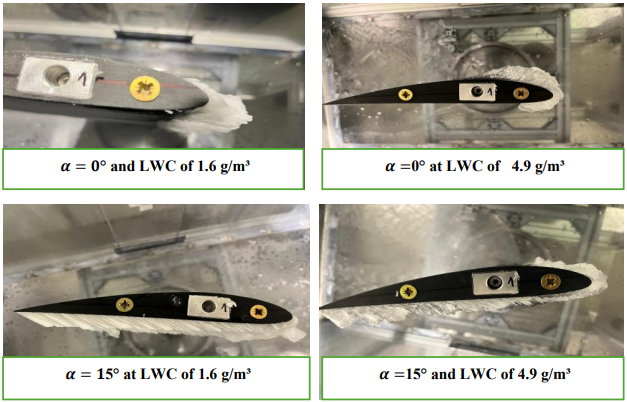
Figure 6: Comparison of Ice Accretion Mass at α = 0° and α = 15° Under -4°C Conditions with LWC of 1.6 g/m³ and 4.9 g/m³
Nevertheless, numerical simulations exhibited limitations at extreme conditions specifically, at high angles of attack coupled with high LWC values. Under these conditions, the rapid accumulation of large ice masses introduced computational instabilities, preventing convergence within the required iteration steps and simulation time. Therefore, numerical analysis for higher LWC values such as 1.6 g/m³ and 4.9 g/m³ was restricted to a zero angle of attack to maintain reliability and computational feasibility as shown in Tables 4 and 5.
The ice accretion process described in [32] shows the conditions influencing wind turbine ice accretion rate. The collection efficiency described in that research was dependent on the atmospheric and physical conditions such as temperature and droplets sizes which were considered in this study. Figure 3 shows that when LWC was increased, the ice mass increased, whereas when the ambient temperature was lower (-17 °C), there was higher ice mass compared to (-4 °C). The impact of LWC and temperatures shows the effect of surface runback on the airfoil surface, at higher temperatures and high LWC. It is estimated that a significant proportion of supercooled water droplets remained unfrozen upon impacting on the airfoil surface at -4 °C as shown in figure 4, while at extremely low temperatures and MVD, even at higher LWC, there is likely formation of rime ice conditions due to the rapid freezing of droplets upon impact as shown in figure 3.
The Lift-to-Drag Ratio (CL/CD) of NACA 4412 Under Atmospheric Icing Conditions
Figures 5, 6 and 7 illustrate the degradation of the lift-to-drag ratio CL / CD for -4°C and -17°C at the liquid water content (LWC) conditions investigated in this study. During the experiments, intentional stabilization period was implemented to validate that the pre-icing aerodynamic performance matched the bare airfoil conditions prior to the initiation of ice accretion via injections. In the graphs presented, time zero represent the instantaneous time at which spray system was opened. The results demonstrated that the ice accretion at -4°C had a more pronounced adverse effect on the lift-to-drag ratio CL / CD compared to -17°C at all stages of the accretion process. In both cases, aerodynamic performance deteriorated progressively as ice accumulated, with degradation observed across all angles of attack. Notably, the CL / CD was lower at higher angle of attack and higher LWC. In addition, the rate of reduction (degradation) was lower at low LWC instances as compared to the cases with Higher LWC across all cases as demonstrated by the picture 8.


Figure 5: Graph of CL / CD against ice accretion time at 0.8 g/m³ for -4°C and -17°C respectively.
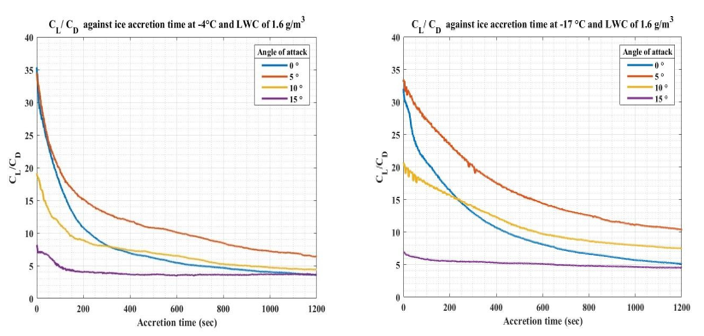
Figure 6: Graph of CL / CD against ice accretion time at 1.6 g/m³ for -4°C and -17°C respectively.


Figure 7: Graph of CL / CD against ice accretion time at 4.9 g/m³ for -4°C and -17°C respectively.
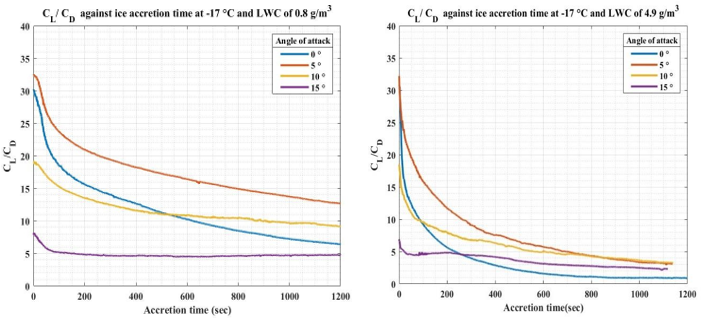
Figure 8: Graph of CL / CD against ice accretion time at 0.8 g/m³ and 4.9 g/m³ for -17°C .
In Figure 7 at -4°C condition, there were peaks observed between 400 s and 1000 s, and a sharp drop occurred in the ratio of CL / CD especially at angle of attack of 5°. This indicated local shedding of small parts of ice due to the instability of the ice formed. These fluctuations highlighted the unsteady, chaotic nature of glaze ice growth under high LWC, where thin films freeze slowly and build complex ice structures that promote strong flow separation and vortex shedding as shown in figure 9.


Figure 9: complex ice structures that promote strong flow separation and vortex shedding in glaze ice at 4.9 g/m3 LWC for - 4°C.
Comparison Between Numerical and Experimental Accreted Ice Shapes
During ice accaretion at -17°C conditions and low LWC, there was a relatively symmetric ice growth pattern with a sharp leading edge observed in the experiments as well as in the numerical models as shown in figure 10. While at -4°C conditions, the accreted ice structure had a complex shapes as shown in figure 10. The distribution of ice showed similarities, but there were discrepancies in the ice accretion locally. These differences are attributed to numerical simulation assumptions such as two-dimensional flow, idealized thermodynamics boundary conditions and uniform droplet size distribution. However, the experimental shape showed slight local difference as a result of surface roughness evolution which is difficult to capture in the simulations.

Figure 10: Accreted ice shape on the leading edge at α=0° at 4.9 g/m3 and - 17°C after 20 minutes; (a) numerical, (b) experimental results.
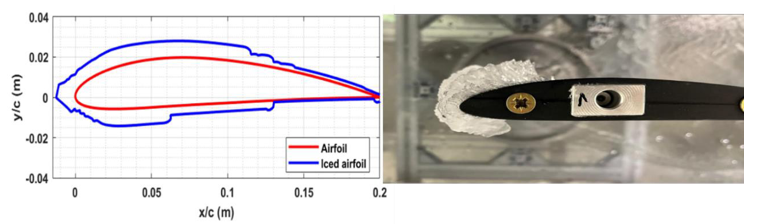
Figure 11: Accreted ice shape on the leading edge at α=0° at 0.8 g/m3 and – 4 °C after 20 minutes; (a) numerical, (b) experimental results.
The ice accreted at – 4 °C conditions both experimentally and numerically were characterized by rough and irregular hornlike shapes, which resulted in sharper and unstable decreases in the CL / CD curve as highlighted in figures 5,6 and 7. However, at - 17 °C, rapid freezing of the droplets upon impact occurred, leading to the formation of translucent but brittle ice. The microstructural differences between the ice formed at - 4°C and that formed at -17 °C were influenced by the grain size and air bubble distribution within the atmospheric ice at lower temperatures Microstructural variation of these accreted ice greatly affected the mechanical properties of ice, such as the ice density and adhesion strength as depicted in figure 10 and 11.
Conclusions
The ice accretion effects on the aerodynamic performance of NACA4412 airfoil section have been examined numerically and Experimentally under different atmospheric conditions. Both the average lift and drag forces exhibited a proportional relationship with the angle of attack and flow velocity, as observed in both numerical and experimental results presented aligning with established theoretical principles regarding the dependence of aerodynamic forces on angle of attack and velocity. The ice mass comparison between the numerical and experimental results displayed a linear correlation with increasing LWC and angle of attack, the observations which have been confirmed by the results of Banitalebi Dehkordi et al. 2013 and Rotich et al. [33,34]. Ice accumulation at -4°C worsened aerodynamic performance more significantly than that accreted at -17°C. This is because the ice type formed at -17 °C roughens the blade but does not modify its shape significantly while that at - 4 C, on the other hand, is smoother yet alters the blade's shape significantly [35]. In both Numerical and Experimental studies, the mass of ice accreted increased exponentially with accretion time. Increasing the angle of attack caused more ice to form on the lower surface of the airfoil. The results obtained in this study are meant to better understand ice-induced aerodynamic degradation and support the development of effective mitigation strategies for wind turbines operating in cold climates.
Recommendations And Future Work
Based on the findings, it is recommended that a study on vorticity and recirculation effects in the test section be carried out. This could be done by incorporating end plates that were not utilized during experimental studies. The results obtained would be used to compare the ones presented here to help pave way for the resolution and syncing of numerical results and experimental results presented in this study.
References
- BCHINI, Q., DUFFOUR, G., PEFFEN, A. (2025) “global-energy-climate-trends-2024-edition-enerdata,”
- (IEA) -International Energy Agency, (2023). “World Energy Outlook 2023,”
- Wiatros-Motyka, M., et al. (2023). “Krzysztof Bolesta (European Commision), Toby Lockwood (Clean Air Task Force), Lauri Myllyvirta,”
- Rotich, I. K., & Musyimi, P. K. (2023). Wind power density characterization in arid and semi-arid Taita-Taveta and Garissa counties of Kenya. Cleaner Engineering and Technology, 17, 100704.
- Tedesco, P., Lenkoski, A., Bloomfield, H. C., & Sillmann,J. (2023). Gaussian copula modeling of extreme cold and weak-wind events over Europe conditioned on winter weather regimes. Environmental Research Letters, 18(3), 034008.
- Pryor, S. C., Shepherd, T. J., & Barthelmie, R. J. (2018). Interannual variability of wind climates and wind turbine annual energy production. Wind Energy Science, 3(2), 651-665.
- Muñoz, C. Q. G., Márquez, F. P. G., & Tomás, J. M. S. (2016). Ice detection using thermal infrared radiometry on wind turbine blades. Measurement, 93, 157-163.
- Shu, L., Yu, Z., Hu, Q., & Jiang, X. (2023). Numerical and experimental investigations of deicing performance for the pneumatic impulse deicing method. Journal of Marine Science and Engineering, 11(7), 1371.
- Chuang, Z., Yi, H., Chang, X., Liu, H., Zhang, H., & Xia, L. (2023). Comprehensive analysis of the impact of the icing of wind turbine blades on power loss in cold regions. Journal of Marine Science and Engineering, 11(6), 1125.
- Gao, L., & Hu, H. (2021). Wind turbine icing characteristics and icing-induced power losses to utility-scale wind turbines. Proceedings of the National Academy of Sciences, 118(42), e2111461118.
- Battisti, L. (2015). Wind turbines in cold climates: Icing impacts and mitigation systems. Springer.
- Ishaque, S., Rehman, S. U., & Kim, M. H. (2024). Numerical Modeling and Experimental Validation of Icing Phenomena on the External Surface of a U-Bend Tube. Processes, 12(11), 2366.
- Li, S., & Paoli, R. (2022). Aircraft icing severity evaluation. Encyclopedia, 2(1), 56-69.
- Beaugendre, H., Morency, F., & Habashi, W. G. (2003). FENSAP-ICE's three-dimensional in-flight ice accretion module: ICE3D. Journal of aircraft, 40(2), 239-247.
- Mingione, G., & Brandi, V. (1998). Ice accretion prediction on multielement airfoils. Journal of Aircraft, 35(2), 240-246.
- Li, S., & Paoli, R. (2019). Modeling of ice accretion over aircraft wings using a compressible OpenFOAM solver. International Journal of Aerospace Engineering, 2019(1), 4864927.
- Yang, B., Jin, A., Cheng, J., Zhou, S., & Jiang, B. (2025). Numerical simulation of ice crystal accretion and aerodynamic impacts on wind turbine blades in cold climates. Coatings, 15(2), 126.
- Shen, X., Zhao, J., Ye, Z., Wang, H., & Lin, G. (2024).Influence of ice growth mode on the ice thickness and shape prediction of two-dimensional airfoil. Aerospace, 11(12), 1010.
- Ozcer, I. A., & Moula, G. (2024). Numerical investigations into swept-wing ice accretion rate variations with time. In AIAA Aviation Forum and Ascend 2024 (p. 3684).
- Ozcer, I. A., Baruzzi, G. S., Reid, T., Habashi, W. G., Fossati, M., & Croce, G. (2011, June). FENSAP-ICE: Numerical prediction of ice roughness evolution, and its effects on ice shapes. In SAE 2011 International Conference on Aircraft and Engine Icing and Ground Deicing. SAE Technical Paper.
- Croce, G., De Candido, E., Habashi, W. G., Munzar, J., Aubé,M. S., Baruzzi, G. S., & Aliaga, C. (2010). FENSAP-ICE:Analytical model for spatial and temporal evolution of in-flight icing roughness. Journal of Aircraft, 47(4), 1283-1289.
- Rotich, I., & Kollár, L. E. (2022). Numerical simulation of the performance of an asymmetrical airfoil under extreme weather conditions.
- ANSYS. (2025). “ Ansys FENSAP-ICE User Manual ,”
- Fajt, N., Hann, R., & Lutz, T. (2019, July). The influence of meteorological conditions on the icing performance penalties on a UAV airfoil. In 8th European Conference for Aeronautics and Space Sciences (EUCASS).
- Habashi, W. G., Morency, F., & Beaugendre, H. (2003, June). FENSAP-ICE: A second generation 3D CFD-based in-flight icing simulation system. In FAA In-flight Icing/Ground Deicing International Conference & Exhibition. SAE Technical Paper.
- Bourgault, Y., Habashi, W. G., Dompierre, J., & Baruzzi, G.S. (1999). A finite element method study of Eulerian droplets impingement models. International Journal for Numerical methods in fluids, 29(4), 429-449.
- Morency, F., Beaugendre, H., Baruzzi, G., & Habashi, W. (2001, June). FENSAP-ICE-A comprehensive 3D simulation system for in-flight icing. In 15th AIAA computational fluid dynamics conference (p. 2566).
- Messinger, B. L. (1953). Equilibrium temperature of an unheated icing surface as a function of air speed. Journal of the aeronautical sciences, 20(1), 29-42.
- International Standard Organization. (2020). (ISO 1332 -1, “Practice for Determining Data Criteria and Processing for Liquid Drop Size Analysis,” Apr. 01, ASTM International, West Conshohocken, PA.
- Knop, I., Bansmer, S. E., Hahn, V., & Voigt, C. (2021).Comparison of different droplet measurement techniques in the Braunschweig Icing Wind Tunnel. Atmospheric Measurement Techniques, 14(2), 1761-1781.
- HBK. (2025). “QuantumX MX840B and MX440B: 24-Bit Universal Measuring Amplifier for All Common Sensor Technologies.” Accessed: Jan. 28.
- Makkonen, L., Laakso, T., Marjaniemi, M., & Finstad, K. J. (2001). Modelling and prevention of ice accretion on wind turbines. Wind engineering, 25(1), 3-21.
- Dehkordi, H. B., Farzaneh, M., Van Dyke, P., & Kollar, L.E. (2013). The effect of droplet size and liquid water content on ice accretion and aerodynamic coefficients of tower legs. Atmospheric research, 132, 362-374.
- Rotich, I., & Kollár, L. E. (2022). Numerical simulation of the performance of an asymmetrical airfoil under extreme weather conditions.
- Fortin, G., & Perron, J. (2009, January). Wind turbine icing and de-icing. In 47th AIAA aerospace sciences meeting including the new horizons forum and aerospace exposition (p. 274).
Appendix
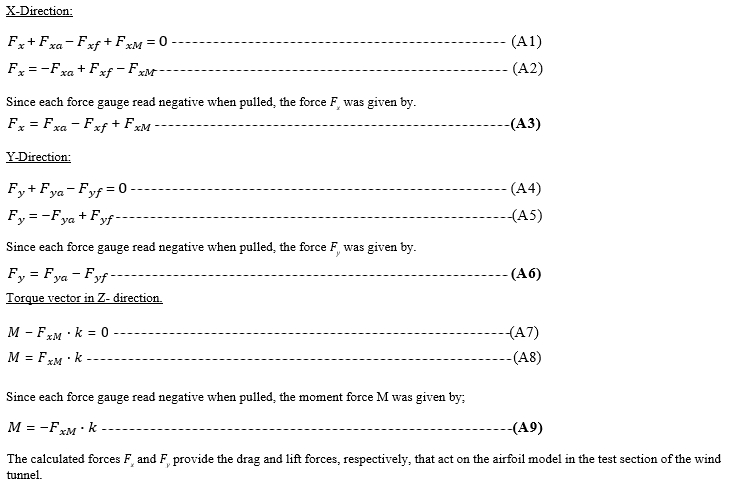
Forces Acting on The Load Cell Strain Gauges
The forces acting on the blade section could be calculated based on the forces measured by the loads cells as highlighted in the Equations A1 to A9 below.