
Journal of Investment, Banking and Finance(JIBF)
ISSN: 2997-2256 | DOI: 10.33140/JIBF
Impact Factor: 0.92


Research Article - (2026) Volume 4, Issue 1
Black-Litterman Portfolio Optimization using Machine-Learning, Deep Learning and Reinforcement Learning Algorithms
2Oklahoma State University, USA
Received Date: Sep 02, 2025 / Accepted Date: Jan 20, 2026 / Published Date: Feb 17, 2026
Copyright: ©2026 Shigolakov Ivan Vasilevich, et al. This is an open-access article distributed under the terms of the Creative Commons Attribution License, which permits unrestricted use, distribution, and reproduction in any medium, provided the original author and source are credited.
Citation: Shigolakov, I.V., Byers, J. W. (2026). Black-Litterman Portfolio Optimization using Machine-Learning, Deep Learning and Reinforcement Learning Algorithms. J Invest Bank Finance, 4(1), 01-11.
Abstract
A portfolio optimization plays a critical role in the financial world. Today the portfolio managers, financial and investment analysts, quantitative researchers from different financial institutions and companies try to find new or better approaches to optimize the investment portfolio in comparison with classical techniques. Nobel prized Harry Markowitz in 1952 introduced his world famous model which is still used by financial scientists in researches as a benchmark or as a background to develop new approaches. The model has some limitations in terms of data normality assumption, historical mean- variance approach instead of potential risks evaluation and others. As a result, some assumptions become irrelevant in real market conditions. Black-Litterman model developed by Fischer Black and Robert Litterman in 1992 attempts to handle some limitations of Markowitz model. This research project will use the Black-Litterman model as a background for further investigation. The view matrix construction will use the Machine Learning and Deep Learning models predictions. MLDL-based Black-Litterman model is expected to demonstrate higher cumulative returns and Sharpe ratios in comparison with classical Markowitz and BL models.
Keywords
Portfolio Optimization, Markowitz Model, Black-Litterman Model, Machine Learning, Deep Learning, Reinforcement Learning
Introduction
Probably one of the most important event for investment or finance related participants is the introduction by Harry Markowitz in 1952 his new theory of optimal portfolio optimization known as Modern Portfolio Theory (MPT). The proposed model has several limitations and drawbacks, which often leads to unpredictable results when applied in practice. The data normality of distribution usually makes the model irrelevant for real application but useful for theoretical researches. Input parameters sensitivity is another issue because the real market conditions change every time and a small adjustment in one variable of the model leads to large changes in asset weights. Another problem that practitioners face with is the calculation of expected returns and variance is based on historical datasets. Almost certainly, there will be errors in real returns and actual variances of investment assets and as a result pure portfolio performance.
Fisher Black and Robert Litterman, in 1992, introduced a new approach to optimal portfolio allocation, which to a certain extent attempts to handle Markowitz model’s limitations. The new proposed approach uses the combination of subjective views of investors (or investor) concerning the expected returns of the assets and market equilibrium vector of expected returns to a new estimation of returns. There are many research papers dedicated to different approaches of predicting the expected returns in order to construct the BL view matrix. S.L Beach et al, used egarch model to build views in BL model. A. Duqi et al, implemented another technique based on volatility forecast. All these approaches have one common characteristic – they use the forecasting models belonging to a certain class to construct the view matrix [1,2]. This property can potentially lead to frustrating results especially when the model deals with constantly changing or dynamic regime changing environment. Not all models can adapt to changing regimes.
This project research attempts to show whether the implementation of Reinforcement Learning Agent in couple with Machine Learning and Deep Learning forecasting approaches can increase the performance of the portfolio in comparison with classical MV and BL methods by construction the optimal strategy of building the Black-Litterman view matrix.
Literature Review
It has become an indisputable fact that Machine Learning methods significantly improves the portfolio performance in comparison with classical approaches. The researchers implies different ML techniques to forecast the assets different characteristics [3]. Used in their paper two Random Forest models to predict assets monthly excess returns and volatility. This approach gave a good improvement in terms of investor utility and Sharpe ratios. Random Forest model is one of the best methods for classification tasks but can also be applied in regression analysis. For such models, the overfitting is the main problem and the Random Forest based models should be continuously tested and adjusted to dynamic market changes.
Francisco Espiga-Fernández et al. [4]. Applied Deep Reinforcement learning algorithms for portfolio optimization using DQN, DDPG, PPO and SAC methods. Some techniques performed better than others did but in general, the researchers showed a good performance of RL algorithms compared to MV classical method. Srijan Sood et al. also implemented the RL algorithms in their work [5].
Zhang et al [6]. Made a good research where they adopted LSTM Neural Network approach to optimize Sharpe ratio directly without predicting the assets future returns. The authors compare the portfolio strategy with other different techniques showing good performance. The proposed approach has also a robust dynamic in the periods of disturbance like COVID-19.
A combination of different approaches was used in the paper introduced by Liam Smith et al. [7]. The research attempts to implement different algorithms, including regression analysis, time-series forecasting and clustering, to analyze historical financial data and identify patterns that inform investment decisions. The results are very promising and the authors of the paper made a robust model that adapts to changing market conditions and can predict future asset performance with increased accuracy. The main issue of the approach is potential overfitting coursed by historical based model learning approaches.
There are many research papers dedicated to Black-Litterman model. The researchers try to find new approaches of expert views formulation. Stoilov et al. [8]. Proposed to compare implied and mean asset returns to build view matrix. The approach implies active management as only a limited amount of historical data and short-term forecast shift are used. In general, the algorithm can be used in real market but in order to ensure the robustness on regime changes more investigations should be made.
Jia et al. [9]. Assumed that investors’ views regarding the assets returns are entirely private information and proposed to adjust variances based on corresponding assets options. Modifying the experts view in the Black-Litterman model using modern approaches is perhaps the most popular direction for today. As an additional examples [8-12].
Approach
The project will use Black-Litterman model to allocate the assets into an optimal portfolio. The main purpose is to adjust the view matrix of the model to improve the portfolio performance.
We attempt to accumulate the power of Machine Learning and Deep Learning approaches to derive a set of forecasts for each financial asset and, using the Reinforcement Learning techniques, choose the optimal prediction. We will construct the loss function based on which the Reinforcement Learning Agent will build the optimal strategy of choosing the most correct forecast derived by different ML and DL models. The expected result is the view matrix, which will be dynamically adjusted to reconstruct the portfolio based on new weights.
Methodology
Data
The historical datasets will be used for different financial assets from technological, real estate, energy, financial services, consum¬er defensive sectors and others to implement a modified Black-Lit-terman model in the project. The project research will include the assets presented in Table 1:
|
Asset name |
Ticker |
Short description |
|
Rio Tinto |
RIO |
One of the biggest multinational British-Australian metals and |
|
|
|
mining corporation |
|
AT&T |
T |
The American transnational telecommunication company |
|
Philip Morris International |
PM |
The American multinational tobacco company |
|
British Petroleum |
BP |
Transnational British oil company |
|
Allianz |
ALV.DE |
The German multinational insurance company |
|
AstraZeneca |
AZN |
The international British-Swedish pharma and biotech |
|
|
|
company |
|
Siemens |
SIE.DE |
The German engineering company |
|
Boeing |
BA |
The American aerospace manufacturer |
|
3M |
MMM |
The American multinational chemical company |
|
Vornado Realty Trust |
VNO |
The American Real estate company |
Table 1: Portfolio Assets Short Description
All the data are downloaded using Yahoo Finance API services. Before the modeling, we split the data into training (90%) and testing datasets (10%):
i. Training dataset – the assets prices data are used to calculate implied equilibrium returns, Covariance matrix, make predictions of assets returns etc. The main purpose is to train the models and use the results to construct the view matrix of BL model. The length is 90% of all dataset. This set is also splitted into training (80%) and view building sets (20%).
ii. Testing dataset – the asset prices data are used to simulate (test) the constructed portfolio on new data to derive and analyze the performance metrics.
Features
The project implements several prediction models using ML, DL and RL approaches. The main component of prediction model is features. A researcher can use both periodic or statistical economic indicators published by various providers and technical indicators based on mathematical calculations. We will use technical indica¬tors both trending and momentum as features to train the models. A summary of all indicators are presented in Table 2.
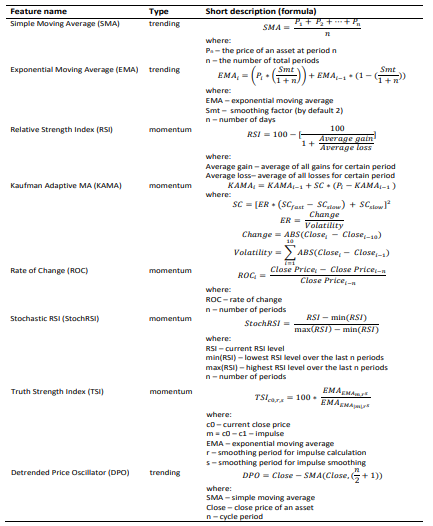
Table 2: Short Description of Technical Indicators Used as Models Features
Black-Litterman model
The Black-Litterman model is a major instrument of this project research. The purpose is to make an estimation of expected returns of each asset in question by means of combination of experts views regarding to assets expected returns and vector of market equilibrium expected returns. The first step of modeling the Black-Litterman approach is to find implied equilibrium returns using the following formula (1):
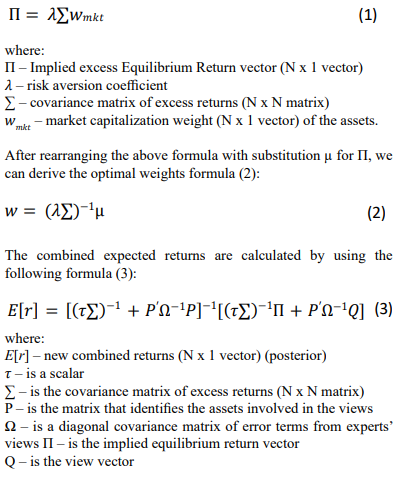
Forecasting Models and View Matrix
The research project implements several Machine Learning and Deep Learning models to make forecasts of assets returns for 5 days ahead. All the models are trained using training period. Several models are also optimized by applying hyper-parameters tuning. The models descriptions are summarized in Table 3.
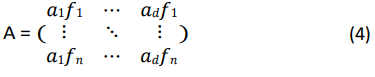
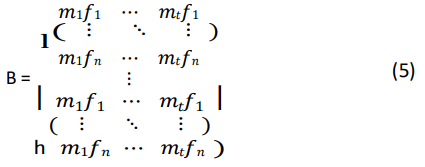
The next step is to construct the view matrix. In order to derive the matrix, the forecasting results of all models are summarized in one matrix with dimension of n x d, where d – number of assets in portfolio, n – number of forecasts. See an example of the matrix in (1).
The project specifies two approaches: averaging all the forecasts for one asset to derive a single one and the usage of Reinforcement Learning Agent to make a decision which model to choose based on historical performance.
The averaging method of constructing the view matrix is straightforward and does not require special descriptions. The process of teaching a RL Agent can be summarized in several steps:
1. Training the models on training datasets for each asset.
2. Making forecasts for each asset at each time step in view building period (see Figure 2). We summarize all models predictions for each asset in one matrix with dimension of d x n x t, where d - the number of assets in portfolio, n – the number of forecasts which is equal to the length of view building period, t – the number of prediction models.
3. In this step, we begin the process of teaching the Reinforcement Learning Agent. Based on all forecasts made by models the Agent finds the optimal strategy of model choosing. To be specific, the project implies Deep Q-Network Model (DQN) to train an Agent.
4. The trained RL Agent is being used in the steps when a new price data is delivered. Based on new data the new features are calculated to make new forecasts for asset. Among the several predictions, the Agent makes an optimal choice.
5. Gathering all Agent’s choices for each asset, we construct a view matrix.
|
Model name |
Type |
Model description |
|
DecisionTreeRegressor LinearRegression SGDRegressor XGBRegressor LSTM CNN |
ML ML ML ML DL DL |
The Machine Learning model that predicts numeric (continuous) values based on tree-like structure. The model divides the dataset by key features into smaller sets using the certain rules. The mathematical model that assumes the linear relationship between variables. The model searches the optimal weights to minimize the error term. The regression technique that uses Stochastic Gradient Descent method for finding the optimal parameters of the model. The Machine Learning boosting method that uses penalty techniques like L1 and L2. Long-Short term model. Deep Learning Method. Convolutional Neural Network. Deep Learning Method. |
Table 3: Short Description of Models Used in the Research
Results
This paper used ten assets from different economic sectors to construct the portfolio. The prices dynamic of the assets is shown in the Figure 3.

Figure 3: Project Assets Price Dynamic
The portfolio of the project utilizes the assets with low correlation as shown in Figure 4.

Figure 4: Project Assets Correlation Matrix
The result section also shows the comparative analysis of different asset allocation approaches. We used tree methods to optimize the portfolio: evenly allocated assets (naïve approach) that will serves as a benchmark, Markowitz model and modified Black-Litterman model. We also used several financial metrics to make judgments which approach is better for investments decisions. The results of naive method of portfolio optimization are in Figure 5.

Figure 5: Naïve Method Cumulative Returns Performance
The results of Markowitz’s method of portfolio optimization are depicted in Figure 6.

Figure 6: Optimal Weights Generated by Markowitz Model We see asset overconcentration issue.
The Markowitz model gives three weights for Philip Morris, Allianz and AstraZeneca as optimal – more than 50% of capital is invested into AstraZeneca and around 42% is allocated in Allianz stocks. We can observe the cumulative returns performance of constructed Markowitz portfolio (see Figure 7).

Figure 7: Cumulative Returns Performance of Markowitz Portfolio
The optimal weights of modified Black-Litterman approach are presented in Figure 8. In the graphs, one can observe how the asset weights structure was changing during the testing period [13,14].

Figure 8: Black-Litterman Weights Structure Changes
We can see a dramatic change in weights for such assets like Philip Moris, BP, Siemens and AstraZeneka at the very beginning of testing period. Philip Moris had more than 70% weight in the beginning of investment testing period. At the middle of testing period (the middle of the investment year) the weight of Philip Moris in portfolio changed significantly to 16%. In the end of testing period BL model recommendation for Philip Moris stayed the same.
We can observe for AstraZeneka company an increasing dynamic during the testing period – at the beginning the portfolio did not hold any stocks of AstraZeneka but in the middle and the end of investment period we can observe an increasing dynamic of weights.
The Figure 9 shows the dynamics of portfolio returns generated by modified Black- Litterman model.

Figure 9: Cumulative Returns Performance of Bl Portfolio
The following plot consolidates the different approaches performance (see Figure 10 and Table 3).

Figure 10: Different Asset Allocation Approaches Performance
|
Model/approach |
Expected Return |
Sharpe Ratio |
Std. deviation |
Max DD rate |
|
Naïve method |
0.003274 |
0.142731 |
0.023950 |
1.218030 |
|
Markowitz |
0.002442 |
0.101556 |
0.023904 |
0.835240 |
|
Black-Litterman (RL) |
0.005474 |
0.238617 |
0.022940 |
2.569488 |
Table 3: Models Performance Comparative Analysis (Test Period)
The Figure 10 shows that modified Black-Litterman approach using Machine Learning and Deep Learning modes in couple with RL trained Agent for optimal prediction model choice has more smoothed cumulative returns line. Furthermore, the BL method has the highest Sharpe Ratio, which is described by comparatively high expected rate of returns and low standard deviation. The Table 3 summarizes different portfolio performance metrics on testing period.
All the methods show significant drawdown in the period of March 2025. The Black- Litterman portfolio suffered the most decline but the method showed the fastest recovery in the near future.
It is also worth noting that the second half of testing period is more volatile which influences the overall portfolio performance. See the comparison of stocks average returns and standard deviations in first and second half of testing period shown in Table 4.
|
Company |
Std (1h) |
Std (2h) |
diff |
Return (1h) |
Return (2h) |
diff |
|
Allianz |
0,00962 |
0,01225 |
0,00263 |
0,0010 |
0,0021 |
0,0012 |
|
AstraZeneca |
0,01186 |
0,01545 |
0,00359 |
0,0015 |
-0,0005 |
-0,0020 |
|
Boeing |
0,02147 |
0,02602 |
0,00455 |
-0,0004 |
0,0015 |
0,0019 |
|
BP |
0,01287 |
0,01960 |
0,00673 |
-0,0005 |
-0,0001 |
0,0004 |
|
3M |
0,02291 |
0,01837 |
-0,00454 |
0,0031 |
0,0014 |
-0,0016 |
|
Philip Morris |
0,01025 |
0,01720 |
0,00695 |
0,0016 |
0,0024 |
0,0008 |
|
Rio Tinto |
0,01356 |
0,01662 |
0,00306 |
0,0002 |
0,0005 |
0,0003 |
|
Siemens |
0,01543 |
0,02086 |
0,00543 |
0,0015 |
0,0022 |
0,0007 |
|
AT&T |
0,01232 |
0,01506 |
0,00274 |
0,0015 |
0,0023 |
0,0007 |
|
Vornado |
0,03493 |
0,02493 |
-0,01000 |
0,0027 |
0,0018 |
-0,0009 |
Table 4: Standard Deviations and Average Returns for Portfolio Companies on Testing Period
|
Model/approach |
Expected Return |
Sharpe Ratio |
Std |
|
Naïve method |
0.003791 |
0.243834 |
0.015546 |
|
Markowitz |
0.004188 |
0.259196 |
0.016158 |
|
Black-Litterman (RL) |
0.003462 |
0.191211 |
0.018106 |
Table 5: Models Performance Comparative Analysis (1-st Half of Test Period)
|
Model/approach |
Expected Return |
Sharpe Ratio |
Std |
|
Naïve method |
0.002758 |
0.091681 |
0.030083 |
|
Markowitz |
0.000696 |
0.023507 |
0.029591 |
|
Black-Litterman (RL) |
0.006265 |
0.241403 |
0.025951 |
Table 6: Models Performance Comparative Analysis (2-nd Half of Test Period)
Discussion
This project research demonstrated how a new approach developed based on Black- Litterman model can improve investment portfolio performance in comparison to other classical methods. To be more specific, this paper attempts to build a new technique of experts’ views construction.
The Machine Learning and Deep Learning models were used to build assets returns forecasts. In order to choose the best model I used a trained DQN Agent. Comparing the proposed methods performance results, we can see Markovitz’s dominance in the beginning of the testing period. The Black-Litterman approach is among outsiders but showed a smoothed returns dynamic indicating a comparatively low variance and risks. Only in the second half of the testing period, we observe the outperforming results indicating the ability of ML, DL and RL methods to predict. The second half is more volatile in comparison to the first half of the testing period and can be treated as an opportunity to profit but with more risk. The standard deviation of returns ranges from 0.016 to 0.018 in low-volatile period and from 0.026 to 0.030 in high- volatile period for different investment approaches (see Table 5 and Table 6).
The modified Black-Litterman asset allocation technique shows a robust behavior for low- variance market regime and good performance in case of high-variance or risky regime. We used only a limited number of assets for developing a new approach due to large computational costs. It is recommended to use more historical datasets meaning not only larger time series but also different financial asset from other economic sectors.
Conclusion
This project attempts to discover a better approach of asset allocation in comparison with equal-weighted and Markowitz approaches. The paper implies Black-Litterman model developing new method of expert views matrix construction. The model uses Stochastic Gradient Descent regression, linear regression, Decision Tree, Random Forest, Extreme Gradient Boosting regression and Deep Learning models as LSTM and CNN to predict the assets price 5 days ahead. After all models predictions are built, we construct a view matrix by using a trained Agent of DQN model. The models training is made on training dataset, the RL agent environment is built on validation dataset derived from training set. Finally, the constructed portfolio performance is being checked on testing dataset.
Based on testing performance results, we can conclude that the modified Black-Litterman model is more preferable for active-trading investors seeking high profit with relatively low risks. The comparative analysis shows good figures for BL approach - the Sharpe ratio is twice as much as Markowitz portfolio metric. Good performance metric explains high expected return and low risk factor.
The model can be extended to more assets with longer historical datasets. Implement real trading terms as transaction fees and other costs. The implied ML and DL models can be extended by using more hyper-parameters to tune. Also more features are recommended to be added to train the models. Among the proposed technical indicators, which by default have low predictive power the research can include macroeconomic and public statistical indicators.
The approach proposed in the paper has good performance and has potential for further development.
References
- Beach, S. L., & Orlov, A. G. (2007). An application of the Black–Litterman model with EGARCH-M-derived views for international portfolio management. Financial Markets and Portfolio Management, 21(2), 147-166.
- Duqi, A., Franci, L., & Torluccio, G. (2014). The Black–Litterman model: The definition of views based on volatility forecasts. Applied Financial Economics, 24(19), 1285-1296.
- Pinelis, M., & Ruppert, D. (2022). Machine learning portfolio allocation. The Journal of Finance and Data Science, 8, 35-54.
- Espiga-Fernández, F., García-Sánchez, Á., & Ordieres-Meré,J. (2024). A Systematic Approach to Portfolio Optimization: A Comparative Study of Reinforcement Learning Agents, Market Signals, and Investment Horizons. Algorithms, 17(12), 570.
- Oshingbesan, A., Ajiboye, E., Kamashazi, P., & Mbaka,T. (2022). Model-Free Reinforcement Learning for Asset Allocation. arXiv preprint arXiv:2209.10458.
- Zhang, Z., Zohren, S., & Roberts, S. (2020). Deep learning for portfolio optimization. arXiv preprint arXiv:2005.13665.
- Liam, S., Elijah, W., Olivia, M., Noah, D., Samantha,L. Optimizing Investment Portfolio Management Using Machine Learning Techniques. https://www.researchgate.net/ publication/388955846_Optimizing_Investment_Portfolio_ Management
- Stoilov, T., Stoilova, K., & Vladimirov, M. (2021). Application of modified Black-Litterman model for active portfolio management. Expert Systems with Applications, 186, 115719.
- Jia, X., & Gao, J. (2016, May). Extensions of black-litterman portfolio optimization model with downside risk measure. In 2016 Chinese Control and Decision Conference (CCDC) (pp. 1114-1119). IEEE.v
- Simos, T. E., Mourtas, S. D., & Katsikis, V. N. (2021). Time-varying Black–Litterman portfolio optimization using a bio-inspired approach and neuronets. Applied Soft Computing, 112, 107767.
- Alexander, D., & Svetlana, D. (2013). Application of Ensemble learning for views generation in Meucci Portfolio Optimization Framework. Review of Business and Economics Studies, (1), 100-110.
- Min, L., Dong, J., Liu, D., & Kong, X. (2021). A black-litterman portfolio selection model with investor opinions generating from machine learning algorithms. Engineering Letters, 29(2), 710-721.
- Donthireddy, P. (2018). Black–Litterman Portfolios with Machine Learning Derived Views. Research Gate.
- Kara, M., Ulucan, A., & Atici, K. B. (2019). A hybrid approach for generating investor views in Black–Litterman model. Expert Systems with Applications, 128, 256-270.