


Research Article - (2019) Volume 4, Issue 4
Association of Fasting Insulin with Plasma and RBC Micronutrients Copper, Zinc in Newly Diagnosed Type 2 Diabetic Patients
2Kurmitola General Hospital, Bangladesh
3National Medical College and Hospital, Bangladesh
4Shahabuddin Medical College and Hospital, Bangladesh
5Rangpur Medical College and Hospital, Bangladesh
6Bangabandhu Sheikh Mujib Medical University, Bangladesh
Received Date: Sep 12, 2019 / Accepted Date: Sep 28, 2019 / Published Date: Oct 22, 2019
Copyright: ©Humaira Binte Asad, et al. This is an open-access article distributed under the terms of the Creative Commons Attribution License, which permits unrestricted use, distribution, and reproduction in any medium, provided the original author and source are credited.
Abstract
Copper and Zinc are extremely important trace elements involved in a number of metabolic processes. Imbalance of a trace element may be the consequence of certain disorders. Zn plays a clear role in the synthesis, storage and secretion of insulin as well as conformational integrity of insulin in the hexametric form. The decreased levels of Zn affect the ability of the islet cell to produce and secrete insulin thus complicating the problem, particularly in Type 2 diabetes. Cu is an integral part of numerous enzymes like cytochrome c oxidase, superoxide dismutase that are involved in metabolic processes. The aim of this study was to find out the association between fasting plasma insulin and plasma, RBC Cu and Zn among both the control healthy also newly diagnosed type 2 DM. A case control study was carried out in the department of Biochemistry jointly with the Department of Endocrine Medicine of Bangabandhu Sheikh Mujib Medical University. A total of 64 non-smokers, non- alcoholic, normotensive subjects free from renal and hepatic diseases were included in this study. Among them thirty three were newly diagnosed type - 2 DM. Thirty one were age and sex matched healthy control. Mean±SD of fasting insulin was 13.13±7.87 µU/ml and 16.53±13.78 µU/ml in healthy controls and newly diagnosed type -2 DM. The median values of RBC Zn of both groups were 6984.00 ppb and 5155.50 ppb respectively (p<.001). Significant negative correlation was found between plasma Insulin and RBC Zn (p<.0001, r = -.7881) in newly diagnosed type 2 DM. Others showed no significant correlations. All the median values of trace elements significantly differed between groups. Micronutrients derangement could be related to type -2 Diabetes Mellitus development as well as its complications.
Keywords
Copper, Zinc, Diabetes Mellitus, Insulin
Abbreviations
RBC: Red Blood Cells
ENT: Ear Nose Throat
DM: Diabetes Mellitus
Cu: Copper
Zn: Zinc
SD: Standard Deviation
OCP: Oral Contraceptive Pills
BSMMU: Bangabandhu Sheikh Mujib Medical University
EDTA: Ethylenediaminetetraacetic Acid
NaF: Sodium Fluoride
SGPT (ALT): Alanine Aminotransferase
ELISA: Enzyme-linked immunosorbent assay
SI: System Internationale
BMI: Body Mass Index
BIRDEM: Bangladesh Institute of Research and Rehabilitation in Diabetes, Endocrine and Metabolic Disorders
Introduction
Microminerals like Copper and Zinc are extremely important trace elements as involved in a number of metabolic processes though required less than 100 mg/day. So imbalance of trace elements may be the consequence of metabolic disorders [1]. Trace elements act as essential co-factors of enzymes as well as organizers of the molecular structures of the cells (e.g., mitochondria) and different biological membranes. There is optimal concentration of each trace element in a particular tissue. Its excess can be toxic and its insufficiency may lead to metabolic disorders. Zinc is widely distributed in all tissues [2]. Nearly 99% of total body Zn is inside the cells, the remainder in plasma and extracellular fluids. Zn content of red cells is approximately ten times that of serum Zn [2]. It’s also involved in the synthesis and stabilization of proteins. Zn plays a clear role in the synthesis, storage and secretion of insulin as well as conformational integrity of insulin in the hexametric form [3]. So decreased Zn concentration affects the ability of the islet cells to produce and secrete insulin ultimately complicating the problem in Type 2 diabetes.
The Cu exists largely in the form of ceruloplasmin in plasma. The ceruloplasmin Cu constitutes 90-95% of serum Cu. Most of the remainder of the plasma Cu is albumin bound and 1-2% associated with amino acids [4]. Cu is an integral part of numerous enzymes like amine oxidases, ferroxidase, cytochrome c oxidase, superoxide dismutase, dopamine hydroxylase-all are involved in metabolic processes. Therefore Copper deficiency leads to abnormal metabolic processes like glucose intolerance. Moreover Copper depletion experiments with men and women have revealed abnormalities of lipid metabolism besides impaired glucose metabolism.
The aim of this study was to find out the association between fasting plasma insulin and micronutrients Cu and Zn in plasma, RBC among both the healthy control and newly diagnosed type 2 DM.
Materials and Methods
A case control study was carried out in the department of Biochemistry jointly with the Department of Endocrine Medicine of Bangabandhu Sheikh Mujib Medical University. A total of 64 non-smokers, non- alcoholic, normotensive subjects free from renal and hepatic diseases were included in this study. Among them thirty three were newly diagnosed type-2 DM. Thirty one were age and sex matched healthy control.
Permission for the study was taken from the concerned departments and authorities for ethical clearance. All subjects included in this study were informed and explained about the nature of this study. The only subjects, who had given their written consent, were included in this study.
The Subjects were Divided into:
Group I-Control: Thirty one age and sex matched healthy volunteers, consisted of 16 males and 15 females. They had no evidence of diabetes mellitus or impaired glucose tolerance as evaluated by WHO criteria.
Group II-Test Subjects: Thirty three newly diagnosed untreated non-insulin dependent diabetes mellitus patients consisted of 17 males and 16 females. Diabetes mellitus was confirmed by oral glucose tolerance test.
Inclusion Criteria:
The subjects were included by following criteria
• Those who were normotensive
• BMI of 18-24.99 were considered normal and 25-29.99 were over-weight [5].
• Non-smoker and non-alcoholic
Exclusion Criteria:
The followings were excluded
• Those who had history of acute or chronic systemic illness
• Pregnant and lactating mothers
• Subjects with history of taking drugs like steroids, OCPs, minerals (particularly trace minerals)
• Those were underweight or obese
• Subjects suffering from Endocrine disorders like thyroid disorders and phaeochromocytoma
• Oral Glucose tolerance revealed impaired glucose tolerance test
After selection, volunteers were asked to fast overnight. All the anthropometric measurement and samples were taken between 8:00-8:30 AM in the department of Biochemistry, BSMMU.
Six ml blood was collected with full aseptic precaution usually from the antecubital vein. Blood was immediately transferred into a pretreated metal free plastic test tube containing EDTA (1.5mg/ ml). Then 75 gm of glucose dissolved in 300 ml of water was given orally. Two hours after the glucose load 2ml blood was collected and was kept into a test tube with preservative (NaF).
Collected blood was centrifuged at 4000 rpm for 10 mins. The plasma was separated and kept to measure fasting plasma insulin and glucose, creatinine, SGPT, Cu and Zn. Finally 1 ml of RBC was taken in a test tube and RBCs were hemolyzed in 6 ml deionized water [6]. Haemolysate was used to measure RBC Cu and Zn. The samples were preserved at -35°C till analysis was completed. The second sample that was collected 2hrs after 75 gms glucose load, centrifuged at 2500 rpm for 5 mins. Clear plasma was transferred into eppendorf for further preservation at -35°C.
Laboratory Investigations: Assay of plasma, RBC Cu and Zn was done in the pyro-coated graphite furnace atomic absorption spectrophotometry. Assay of blood glucose was done by enzymatic method. Serum creatinine was assayed by picric acid method. SGPT was assayed by single vial method. Assay of plasma Insulin was done by ELISA method.
Statistical Analysis: Values were presented as mean ±SD. Student’s unpaired “t” tests were used when mean values were compared. Nonparametric results expressed as medians with ranges. Mann-Whitney U tests were done for analysis. The correlation was seen between fasting insulin and fasting plasma, RBC Cu & Zn. Plasma glucose were expressed as mmol/L, S. creatinine mg/dl, P. Insulin µU/ml, SGPT as U/L, trace elements as ppb(parts per billion).
• 1ppb = 1 µg/L
• 1 µg/L of Cu=0.0157µmol/L (SI unit)
• 1 µg/L of Zn=0.0153µmol/L (SI unit)
Results and Discussion
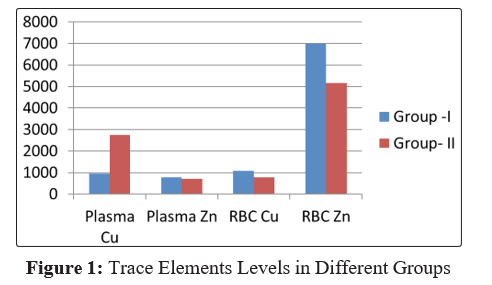
Table 1 shows the general characteristics of age and BMI. Mean±SD of age and BMI in controls and cases showed no significant differences. Serum creatinine and SGPT were measured to exclude renal and hepatic diseases. The two parameters were within normal reference value and showed in Table 2. The parameters showed no significant differences among groups. Plasma glucose levels both fasting and 2 hours after glucose load were showed in Table 3. Mean±SD of fasting plasma glucose in cases were significantly (p<.001) higher than controls. On the other hand mean±SD of 2hrs after glucose load in cases were also significantly (p<.001) higher than controls. Table 4 showed mean±SD of plasma fasting insulin levels in both groups which showed no significant differences. Mean±SD of plasma fasting insulin in group I was within reference level but in group II was a bit higher than reference level. It may be due to resistance to the peripheral receptors to insulin. Trace element levels showed a wide range of variations in both plasma and RBC. So the median values in different groups were expressed in Figure I which showed a bar diagram of median values of Cu and Zn in plasma, also RBC. Median values of plasma Cu in cases were significantly (p<.001) higher than controls. This is consistent with previous work done by Mortuza in 1993 and other findings abroad [7-9]. On the other hand median values of RBC Cu in cases were significantly (p<.001) lower than controls. A study on 26 patients with Diabetes Mellitus and age and sex matched controls in Papworth hospital NHS trust was performed. They observed a significant negative correlation between washed red blood cell Cu and the duration of Diabetes [10]. Median values of plasma and RBC Zn in cases were significantly (p<.05 and P<.001) lower than controls. According to Gavrilova J 2014, changes in the Zn levels have been found to be associated with diabetes [11]. Mateo MC in 1978 found a significant correlation between Zinc and insulin (p<.001) [12]. Figure II showed a significant negative correlation (r = - .7881, p< .0001) between Plasma fasting insulin and RBC Zn in cases. Others showed no significant correlation.
Table 1: General Characteristics in Different Groups
|
Characteristics |
Groups |
Numbers |
Mean±SD |
p-value |
|
Age (yrs.) |
Gr.-I |
31 |
38.29±5.81 |
NS |
|
Gr.-II |
33 |
40.73±5.71 |
||
|
BMI |
Gr.-I |
31 |
32.78±1.62 |
NS |
|
Gr.-II |
33 |
33.90±1.98 |
Table 2: S. Creatinine and SGPT in Different Groups
|
Variables |
Group-I |
Group-II |
P-value |
|
S. Creatinine (mg/dl) (Mean±SD) |
1.01±.17 |
1.02±.45 |
NS |
|
SGPT(U/L) (Mean±SD) |
21.56±10.13 |
25.71±13.03 |
NS |
Table 3: Plasma Glucose Level (Fasting and 2HAG) in Different Groups
|
Variables |
Group-I |
Group-II |
P-value |
|
F. Plasma glucose (mmol/L) Mean±SD |
4.53±.46 |
13.28±4.94 |
P<.001 |
|
Pl. glucose 2HAG (mmol/L) Mean±SD |
5.78±.65 |
18.92±7.24 |
P<.001 |
Table 4: Plasma Fasting Insulin Level in Different Groups
|
Variables |
Group-I |
Group-II |
P-value |
|
F. Plasma Insulin (µU/ml) Mean±SD |
13.13±7.87 |
16.53±13.78 |
NS |
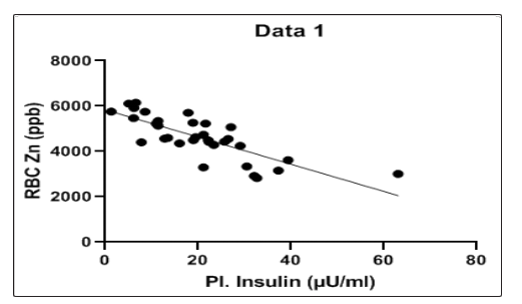
r = - 0.7881
p = <0.0001
Williams et al. in 1995 concluded that Cu and Zn status of diabetes patients were reduced [13].
Trace element concentrations determined in whole blood or plasma very often leads to conclusion contrary to the actual intracellular concentration [13]. Especially in metabolic diseases like diabetes mellitus, conclusion drawn from trace element concentration in blood cells usually offers more valuable clinical information about the metabolic state than in plasma or whole blood [13].
Conclusion and Significance
At the end of the study, we can conclude that alteration of trace element status is seen in the case of newly diagnosed type 2 diabetic patients in Bangladesh. May be their alteration is associated with the development of the disease and also with its complications. Moreover intracellular level offered more conclusive information than the plasma level.
Acknowledgements
We are highly grateful to the Endocrine Department of BSMMU and BIRDEM for their continual support.
References
- M Khan LA (1994) “Serum levels of Mg, Zn and Cu in newly diagnosed Diabetic subjects below 30yrs of age”. MD (EM) Thesis, BIRDEM.
- Mortuza ATM (1993) “Study of serum Zinc, Copper and Magnesium in patients with NIDDM”. M Phil (thesis) IPGMR.
- Chauser AB (1998) “Zinc, insulin and diabetes”. J Am Coll Nutr 17: 109-115.
- Mc Lauchlan DM, Gowland E (1998) Varley’s Practical clinical Biochemistry, CBS Publishers and distributers, New Delhi, India pp 322, 350, 461 and 462.
- Hellerstein MK, Parks EJ (2001) “Obesity and Overweight”. In Greenspan FS, Gardner DG. Basic and Clinical Endocrinology, Mc Graw Hill Company, 6th Ed USA 746-757.
- Raz I and Havivi E (1988) “Influence of Chronic Diabetes on Tissue and Blood Cells Status of Zinc, Copper and Chromium in the Rat”. Diabetes Research 7: 19-23.
- Schlienger JL, Grunenberger F, Maier EA, Simon C, Chabrier G, et al. (1988) “Disorders of plasma trace elements in diabetes.Relation to blood glucose equilibrium.” Press Med 17: 1076-1079.
- Walter RM Jr, Uriu-Hare JY, Olin KY, Oster MH, Anawalt BD, et al. (1991) “Copper, zinc manganese and magnesium status and complications of diabetes mellitus.” Diabetes care 14: 1050-1056.
- Zargar AH, Shah NA, Masoodi SR, Laway BA, Dar FA, et al. (1998) “Copper, Zinc and Magnesium levels in non-insulin dependent diabetes mellitus.” Postgraduate Med J 74: 665-668.
- Williams NR, Rajput-Williams J, West JA, Nigdikar SV, Foote JW, et al. (1995) “Plasma, granulocyte and mononuclear cellcopper and zinc in patients with diabetes mellitus.” Analyst 120: 887-890.
- Gavrilova J, Tougu V, Palumaa P (2014) “Affinity of zinc and copper ions for insulin monomers.” Metallomics 6: 1296-1300
- Mateo MC, Bustamante JB, Cantalapiedra MA (1978) “Serum, zinc, copper and insulin in diabetes mellitus”. Biomedicine 29: 56-58.
- Kruse- Jarres JD, Rukgaues M (2000) “Trace elements in Diabetes mellitus. Pecularities & clinical validity of determinations in blood cells”. J Trace Element Med Biol 14: 21-27.