

World Journal of Forest Research(WJFR)
ISSN: 2994-5569 | DOI: 10.33140/WJFR



Research Article - (2026) Volume 5, Issue 2
Assessment of Indigenous Fodder Tree and Shrub Species in Borana Rangelands, Southern Ethiopia
 and Sisay Taye Gifawesen
 Received Date: Jun 09, 2026 / Accepted Date: Jul 13, 2026 / Published Date: Jul 20, 2026
Copyright: ©2026 Siraj Kelil Gobelle, et al. This is an open-access article distributed under the terms of the Creative Commons Attribution License, which permits unrestricted use, distribution, and reproduction in any medium, provided the original author and source are credited.
Citation: Gobelle, S. K., Gifawesen, S. T. (2026). Assessment of Indigenous Fodder Tree and Shrub Species in Borana Rangelands, Southern Ethiopia. World J Forest Res, 5(2), 01-16.
Abstract
Native woody species are vital for livestock feeding in Borana's lowlands, especially during dry spells when herbaceous forage is scarce. This study analyzed the diversity, utilization, and regeneration of key fodder trees and shrubs, highlighting their socio-ecological significance to local communities. Data collection involved household surveys and vegetation assessments across five indigenous grazing landscapes. The findings highlight that nearly all respondents (99.9%) recognize indigenous fodder trees and shrubs as vital feed resources, alongside their roles in providing fuelwood and meeting other livelihood needs. A total of 88 species from 32 families were identified, with Fabaceae as the most prevalent. These species are crucial during drought periods, maintaining green foliage and producing pods to support livestock and mitigate mortality risks. Key preferred species mentioned include Acacia tortilis, Pappea capensis, Grewia spp., Olea europaea, Boscia mossambicensis, and Balanites aegyptiaca. However, 90.05% of respondents reported a decline in the availability and regeneration of essential species. Notably, Pappea capensis, Olea europaea, Acacia tortilis, Balanites aegyptiaca, and Grewia spp. exhibit poor regeneration status. The decline of indigenous woody species is primarily due to factors such as overgrazing, recurring drought, and poor integration into land-use systems. The study recommends enhancing community-based conservation approaches, integrating native species into restoration and agroforestry practices, raising pastoral awareness of their ecological and economic roles, and implementing controlled grazing. Further research on propagation techniques and nutritional analysis, while highlighting the importance of integrating scientific and indigenous knowledge for the sustainable management and conservation of essential rangeland resources.
Keywords
Grazing Landscapes, Livestock, Native Species, Over Browsing, Regeneration
Introduction
Indigenous fodder trees and shrubs significantly contribute to social, economic, and ecological functions, including erosion control, enhancing quality of life, acting as carbon sinks, and supporting biodiversity [1,2]. Indigenous silvopastoral systems are allowing pastoralists to maintain livestock production during extreme weather; enhances grazing land fertility for grasses; and increased woody biomass enhances ecosystem carbon storage, promoting ecological sustainability [3-5]. Indigenous fodder trees/shrubs are alternative green forage crucial feed sources for livestock throughout the year [6-8]. They contributing up to 90% for rangeland productivity and account for 40-50% of the total available feed [9]. The species are rich in CP, minerals and energy and can maintain livestock feeding value for an extended period of time to supplement poor quality roughages due to their deep root system [2,10].
Ethiopia has a wide range of naturally occurring tree and shrub species that can be used as fodder for ruminants. The Borana Rangelands in southern Ethiopia are an important semi-arid ecosystem where native fodder trees and shrubs are important for keeping livestock production going during times of drought and lack of forage. These plants not only give forage, but they also help keep the environment stable by protecting the soil, supporting biodiversity, and allowing plants to grow back naturally. In the Borana rangelands, pastoralists use most of (76%) trees and shrubs species in their areas as forage, medicines, food, construction, hygiene, rituals and shade purposes [11]. However, due to climate change, rangeland degradation and diminishing dry forests these ingenuous plant species declining and pastoralists in Borana are experiencing feed shortages and declining livestock production. A systemic approach that employs a landscape perspective is necessary to address these interlinked challenges. This study evaluates the availability and regeneration status of indigenous fodder trees and shrubs across the grazing landscapes of Borana rangeland.
Materials and Methods
Study Area Description
Borana zone located in southern Oromia, Ethiopia, about 570 km from Addis Ababa. The Zone situated between latitudes 30°36’- 60°38’ N and longitudes 36°43’-41°40’ E, with a total area of approximately 95,000 km² and altitudes ranging from 500 m to 2000 m a.s.l. (Figure 1). The climate is semi-arid, with annual rainfall varying from 300 mm in the south to over 700 mm in the north. It experiences a bimodal rainfall pattern, with the main rainy season (“Ganna”) from March to May and a smaller season (“Hagayya”) from mid-September to mid-November. Mean annual temperatures range from 19°C to 24°C, showing moderate seasonal variation [12]. The vegetation in Borana often includes a mix of grasslands, shrub lands, and scattered trees. Acacia species are commonly found in the area and are adapted to arid conditions.

Figure 1: Map of the Study Area (Borana Zone)
Methods
Sellection of the Study Sites
From Dire landscape; Dire, Dubluq, Miyo, and Moyale districts were selected and, from each district one kebele, Dida Mega, Lafto, Dibandiba, and Dambi Saphante were respectively selected for detailed assessment. Bila and Saba kebeles were selected from Teltele and Elwoye districts to represent Melbe grazing landscape. From the Dillo district, Dilo Badiya, and Cirate kebeles were assessed as a Golbo grazing landscape. For the Gomole landscape, Areri and Dida Hara kebeles from Yaballo district and Surupha Badiya from Gomole district were included. Lastly, from Dhas district, Gayo and Dhas kebeles were selected to represent the Wayama grazing landscape. In this context, kebeles serve as the lowest neighborhood administration level, facilitating localized study of indigenous fodder trees and shrub regeneration within the varied grazing landscapes. The selection strategy ensures representative sampling across different ecological and administrative zones relevant to dryland pastoral areas, Borana.
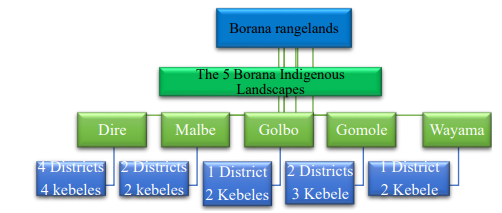
Figure 2: The Five Indigenous Grazing Landscapes of Borana Rangelands and the Number of Selected Districts and Kebele for the Study
Sampling Techniques
To select respondent households, a multistage sampling procedure was employed. Five native grazing landscapes, Dire, Melbe, Gomole, Woyama, and Golbo were chosen in the first stage through stratified sampling. The second stage involved selecting kebeles based on vegetation and altitudinal variation. Individual Households were chosen using simple random sampling.
Household Survey
Primary data collection involved the preparation and use of questionnaires to gather data from households in selected Kebeles. The study assessed pastoralists' indigenous knowledge of various fodder trees and shrubs, along with the current status of these resources. The sample size was determined using the Kothari sample size formula [13].

Where; n = sample size, Z = 95% confidence limit (interval) that is 1.96 given or constant, P = 0.1 (population proportion to be included in the sample that is 10%) =it depends, q = None occurrence of event = 1-p = 1-0.1 that is (0.9), N = total number of (household) found in the study area and e= level of accuracy or sampling error (Where, α = 0.05).
In addition to questionnaires, a checklist was employed to gather information on fodder tree and shrub species from key informants and community members through Focus Group Discussions (FGD). Elders, living in the Borana pastoral areas, were consulted to document extensively the plants and their practical uses based on indigenous knowledge.
Vegetation Survey
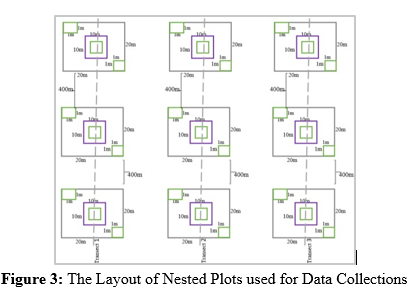
Data on fodder trees and shrubs species and their regeneration status were collected using nested quadrats of 20mx20m, 10mx10m, and 1mx1m. The main plot 20mx20m was used for tree-level sampling, while, sub plot 10mx10 m within the main plot was used to sample sapling and shrubs ; whereas, 1mx1m sub-plots along the diagonal of the main plot were used to collect seedling level data (Figure 3). The nested sampling plots were systematically placed along transect lines.
Data Analysis
The data collected via a structured questionnaire was analyzed using JMP (version 18). Descriptive statistics, including means and percentages, were utilized to present the findings. Index method was employed for evaluating and summarizing native fodder trees and shrubs [14].

Where; Rn: Value given for the least ranked level (example if the least rank is 5th rank, then Rn-5, Rn-1=4 and … R1= 1) Cn: Counts of the least ranked level (in the above example, the count of the 5th rank = Cn, and the counts of the 1st rank = C1).
The regeneration status of fodder tree and shrub species was determined based on the population size of seedlings and saplings and mature tree/shrubs. Good regeneration was defined as seedlings >saplings >adults, and fair regeneration as seedlings >or ≤ saplings ≤ matured. If a species is represented by only saplings (saplings ≤ or ≥adults), the regeneration status is deemed poor; if a species is represented by only trees, the regeneration status is deemed non-regenerating [15,16].
Results and Discussions
Socio-Economic Characteristics of the Households
The household survey encompassed 221 respondents from 13 Kebeles across selected districts and indigenous grazing landscapes. Gender distribution revealed that 71.95% (159) of participants were male and 28.05% (62) were female, a pattern consistent across all districts. Age distribution indicated that the largest group, 33.03% (73), were aged between 40 and 60 years, followed by 23.53% (52) over 60 years, and 23.08% (51) in the 31 to 40 age bracket. The smallest group was those aged 21 to 30 years, making up 20.36% (45 individuals). Additionally, marital status showed that a vast majority, 97.29% (215) of the respondents, were married, while only 2.71% (6) were widowed. With respect to formal education, the majority of respondents (87.78%, 194 individuals) were illiterate. A smaller proportion, 9.05% (20 respondents), had attained primary education, and only 2.71% (6 respondents) had reached secondary level education. Concerning occupational status, most respondents (73.30%, 162 individuals) were agro-pastoralists, whereas 26.70% (59 individuals) were engaged exclusively in pastoralist livelihoods. These detailed demographic profiles provide important context for understanding the surveyed communities’ social composition and livelihoods (Table 1).
The survey results indicate that over 90% of respondents in Borana pastoral communities own goats and cattle, highlighting these animals as the most commonly kept livestock. Approximately 80.54% of households also raise sheep, underlining the importance of these livestock for the communities’ livelihoods, as they provide various resources like milk, meat, and income. In contrast, only 26.24% own camels, likely due to economic limitations or cultural preferences. Additionally, very few respondents reported having horses, mules, or donkeys, which, while less common, serve specific purposes such as labor and transportation (Table2). Overall, cattle, goats, and sheep dominate livestock management in these communities, with camels and work animals being less significant.
The majority of respondents primarily rely on crop and livestock production for income, with variations depending on the specific district and landscape. Additionally, 15.38% report earnings from safety net participation and beekeeping, 9.95% from labor work, and approximately 10.41% from selling firewood and charcoal (Table 2). The alternative sources of income households are beekeeping and involvement in safety net programs. These activities offer significant additional sources of income in the regions. Another significant income source is the sale of charcoal and firewood, indicating reliance on natural resources for financial gain and raising concerns about sustainability and resource management. Petty trade serves as an extra income source, enabling households to diversify their livelihoods through small-scale buying and selling of goods (Table 2). This distribution of income sources highlights significant diversification in the region, shaped by geographic, ecological, and socioeconomic factors, extending beyond traditional farming and livestock household resilience.
|
Indigeno us grazing landscap e |
Sex |
Age |
Marital status |
Status of education |
Livelihood |
|||||||||
|
Male |
Female |
21-30 |
31-40 |
41-60 |
>60 |
Marrie d |
Wido wed |
Illiterat e |
Prima ry |
Secon dary |
Colle ge |
Agro- pastorali st |
Pastorali st |
|
|
% (N) |
% (N) |
% (N) |
% (N) |
% (N) |
% (N) |
% (N) |
% (N) |
% (N) |
% (N) |
% (N) |
|
% (N) |
% (N) |
|
|
Dire |
52.73% (29) |
47.27% (26) |
18.18 % (10) |
29.09% (16) |
29.09% (16) |
27.27% (15) |
96.36% (53) |
3.64% (2) |
90.91% (50) |
7.27% (4) |
1.82% (1) |
0.00% (0) |
81.82% (45) |
18.18% (10) |
|
Golbo |
90.63% (29) |
9.38% (3) |
3.13% (1) |
43.75% (14) |
43.75% (14) |
28.13% (9) |
96.88% (31) |
3.13% (1) |
96.88% (31) |
3.13% (1) |
0.00% (0) |
0.00% (0) |
34.38% (11) |
65.63% (21) |
|
Gomole |
74.42% (32) |
25.58% (11) |
34.88 % (15) |
30.23% (13) |
30.23% (13) |
13.95% (6) |
97.67% (42) |
2.33% (1) |
76.74% (33) |
18.60 % (8) |
2.33% (1) |
2.33% (1) |
88.37% (38) |
11.63% (5) |
|
Melbe |
76.19% (32) |
23.81% (10) |
30.95 % (13) |
35.71% (15) |
35.71% (15) |
9.52% (4) |
97.62% (41) |
2.38% (1) |
76.19% (32) |
14.29 % (6) |
9.52% (4) |
0.00% (0) |
90.48% (38) |
9.52% (4) |
|
Wayama |
75.51% (37) |
24.49% (12) |
12.24 % (6) |
30.61% (15) |
30.61% (15) |
36.73% (18) |
97.96% (48) |
2.04% (1) |
97.96% (48) |
2.04% (1) |
0.00% (0) |
0.00% (0) |
61.22% (30) |
38.78% (19) |
|
All |
71.95% (159) |
28.05% (62) |
23.53 % (52) |
23.08% (51) |
33.03% (73) |
23.53% (52) |
97.29% (215) |
2.71% (6) |
87.78% (194) |
9.05% (20) |
2.71% (6) |
0.45% (1) |
73.30% (162) |
26.70% (59) |
Table 1: Sex, Age, Marital Status, Level of Education and Livelihood of the Respondents (% (N))
|
Distric ts |
|
What are your other source of income? |
||||||||||
|
Cattle |
Goats |
Sheep |
Camel |
Donkey |
Horse & Mule |
Bee keeping |
No |
Petty trade |
Safety net |
Safety net, Wage |
Selling F/wood, Charcoal |
|
|
Gomol |
92.31% |
100.00% (13) |
61.54% (8) |
23.08% (3) |
15.38% |
0.00% (0) |
30.77% |
15.38% (2) |
7.69% |
23.08% |
15.38% |
7.69% (1) |
|
e |
(12) |
|
|
|
(2) |
|
(4) |
|
(1) |
(3) |
(2) |
|
|
Yaball |
93.33% |
96.67% (29) |
86.67% (26) |
26.67% (8) |
23.33% |
0.00% (0) |
6.67% (2) |
36.67% |
13.33% |
30.00% |
6.67% |
6.67% (2) |
|
o |
(28) |
|
|
|
(7) |
|
|
(11) |
(4) |
(9) |
(2) |
|
|
Dire |
80.00% |
95.00% (19) |
70.00% (14) |
45.00% (9) |
0.00% (0) |
5.00% (1) |
10.00% |
65.00% |
0.00% |
15.00% |
10.00% |
0.00% (0) |
|
|
|
(16) |
|
|
|
|
|
(2) |
(13) |
(0) |
(3) |
(2) |
|
|
|
Miyo |
94.12% |
100.00% (17) |
100.00% |
5.88% (1) |
5.88% (1) |
0.00% (0) |
5.88% (1) |
41.18% (7) |
0.00% |
17.65% |
0.00% |
35.29% (6) |
|
|
|
(16) |
|
(17) |
|
|
|
|
|
(0) |
(3) |
(0) |
|
|
|
Moyal |
95.65% |
91.30% (21) |
60.87% (14) |
39.13% (9) |
47.83% |
4.35% (1) |
0.00% (0) |
73.91% |
4.35% |
0.00% (0) |
4.35% |
17.39% (4) |
|
|
e |
(22) |
|
|
|
(11) |
|
|
(17) |
(1) |
|
(1) |
|
|
|
Teltell |
92.31% |
96.15% (25) |
61.54% (16) |
15.38% (4) |
23.08% |
7.69% (2) |
23.08% |
46.15% |
0.00% |
23.08% |
7.69% |
0.00% (0) |
|
|
e |
(24) |
|
|
|
(6) |
|
(6) |
(12) |
(0) |
(6) |
(2) |
|
|
|
Dhas |
96.67% |
100.00% (30) |
93.33% (28) |
26.67% (8) |
3.33% (1) |
0.00% (0) |
16.67% |
23.33% (7) |
6.67% |
16.67% |
16.67% |
20.00% (6) |
|
|
|
(29) |
|
|
|
|
|
(5) |
|
(2) |
(5) |
(5) |
|
|
|
El- |
100.00% |
100.00% (18) |
100.00% |
5.56% (1) |
0.00% (0) |
0.00% (0) |
61.11% |
22.22% (4) |
11.11% |
5.56% (1) |
0.00% |
0.00% (0) |
|
|
Woye |
(18) |
|
(18) |
|
|
|
(11) |
|
(2) |
|
(0) |
|
|
|
Dubluq |
100.00% |
90.48% (19) |
76.19% (16) |
23.81% (5) |
19.05% |
4.76% (1) |
9.52% (2) |
47.62% |
0.00% |
9.52% (2) |
14.29% |
19.05% (4) |
|
|
|
(21) |
|
|
|
(4) |
|
|
(10) |
(0) |
|
(3) |
|
|
|
4.35% (1) |
65.22% |
0.00% |
8.70% (2) |
21.74% |
0.00% (0) |
||||||||
|
Dillo |
100.00% |
86.96% (20) |
91.30% (21) |
43.48% |
8.70% (2) |
0.00% (0) |
|||||||
|
|
(23) |
|
|
(10) |
|
|
|
(15) |
(0) |
|
(5) |
|
|
|
Total |
94.57% |
95.48% |
80.54% |
26.24% |
15.38% |
2.26% |
15.38% |
44.34% |
4.52% |
15.38% |
9.95% |
10.41% |
|
|
|
(209) |
(211) |
(178) |
(58) |
(34) |
(5) |
(34) |
(98) |
(10) |
(34) |
(22) |
(23) |
Table 2: Livestock Species Owned and other Source of Income of the Respondents (% (N))
Trends of Livestock Dynamics and Rangeland Productivity
Majority of respondents, 99.10% (219) reported a continuous decrease in livestock holdings over time. Similarly, 95.48% (211) of respondents across the five indigenous grazing landscapes indicated that rangeland productivity has been steadily declining, while 98.64% (218) reported persistent livestock feed shortages in their areas. Only a small proportion (3.62%) perceived rangeland productivity as stable (Table 3). Livestock dynamics in the Borana rangeland show a "boom-and-bust" pattern, with rapid herd growth during good rainfall and significant declines during droughts. Recently, there has been a general declining trend in livestock populations despite this variability. These findings align with earlier research indicating substantial long-term decreases in rangeland productivity in Borana, attributed to land-use changes, climate variability, and intensified human pressures such as overgrazing and resource mismanagement [17-19].
|
Indigeno us grazing landscape |
Trends of livestock dynamics |
Trends of rangeland productivity |
Is there a feed shortage in your areas |
||||
|
Decreasing |
Stable |
Decreasing |
Stable |
Increasin g |
Yes |
No |
|
|
% (N) |
% (N) |
% (N) |
% (N) |
% (N) |
% (N) |
% (N) |
|
|
Dire |
100.00% (55) |
0.00% (0) |
100.00% (55) |
0.00% (0) |
0.00% (0) |
96.36% (53) |
3.64% (2) |
|
Golbo |
100.00% (32) |
0.00% (0) |
100.00% (32) |
0.00% (0) |
0.00% (0) |
100.00% (32) |
0.00% (0) |
|
Gomole |
100.00% (43) |
0.00% (0) |
97.67% (42) |
0.00% (0) |
2.33% (1) |
100.00% (43) |
0.00% (0) |
|
Melbe |
100.00% (42) |
0.00% (0) |
95.24% (40) |
2.38% (1) |
2.38% (1) |
97.62% (41) |
2.38% (1) |
|
Wayama |
95.92% (47) |
4.08% (2) |
85.71% (42) |
14.29% (7) |
0.00% (0) |
100.00% (49) |
0.00% (0) |
|
Total |
99.10% (219) |
0.90% (2) |
95.48% (211) |
3.62% (8) |
0.90% (2) |
98.64% (218) |
1.36% (3) |
Table 3: Trends of Livestock Dynamics, Rangeland Productivity and Forage Availability in Different Indigenous Grazing Landscapes of Borana Rangeland
Socio-Economic Role of Fodder Tree and Shrub Species
Almost all respondents (99.9%) said indigenous fodder trees and shrubs significantly contribute to livestock feeds, especially during dry seasons. Majority of respondents stressed the importance of fodder trees and shrubs in preventing livestock death during the dry season (Figure 4). The other advantages respondents mentioned that these species contribute to increased milk production, implying that lactating animals' access to fodder from these trees improves their nutritional intake. Additionally, respondents noted that fodder trees and shrubs help animals grow better, stay healthier and enhanced reproduction, which is essential for the sustainability of herds. Studies in parts of Ethiopia and southern Africa reported report that livestock browse indigenous fodder trees and shrubs usually survive critical dry periods, sustained milk production, and better resilience in prolonged droughts, whereas animals without such access often starve or are sold at low prices [20-23]. The significance of these species varies by livestock type, as different animals have specific preferences and nutritional needs. This reliance underscores the ecological importance of indigenous woody species in enhancing rangeland resilience and supporting pastoral livelihoods by improving feed security in adverse climatic conditions.

Figure 4: Perception of Respondents on the Benefits of Fodder Trees and Shrubs for Livestock
Among the identified species, 22 are valued for livestock and human medicinal purposes. Certain fodder species, such as Boswellia neglecta and Acacia senegal, also produce gum and resin in Borana rangeland. Indigenous fodder trees offer multiple benefits, including food, fuel wood, construction materials, and honey bee flowers. A prior study noted that Borana communities utilize most local trees and shrubs for forage, medicine, food, construction, hygiene, rituals, and shade [11].
Identified Indigenous Fodder Tree and Shrub Species
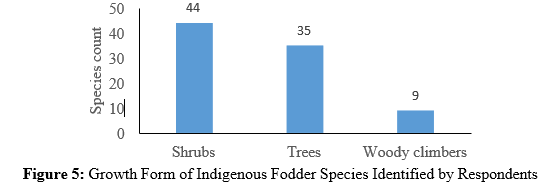
The households were asked to list major indigenous fodder tree and shrubs in their area. A total of 88 indigenous fodder tree and shrub species were identified by respondents across the grazing landscapes. Of the identified 88 fodder tree and shrub species, 44 were shrubs, 35 were trees, and 9 were woody climbers (Figure 5).
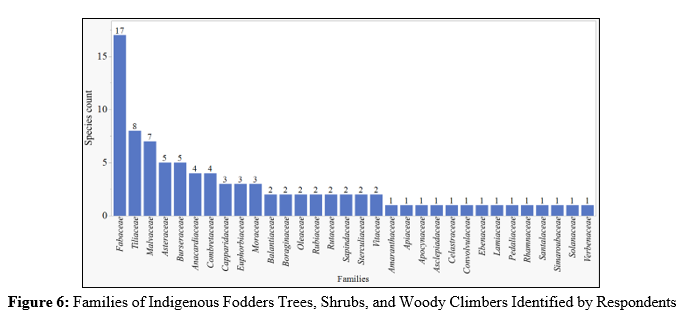
The study identified a total of 32 woody plant families that are useful for livestock feed, with the Fabaceae family being the most dominant, comprising 17 species. Tiliaceae followed with 8 species, while Malvaceae had 7 species. Other notable families include Asteraceae and Burseraceae (5 species each), Anacardiaceae and Combretaceae (4 species each), and several others contributing a smaller number of species. In total, the remaining 14 families each contributed 1 species (Figure 6). The finding indicates that the Borana rangeland is richest in browse plant diversity. A previous study indicated that Borana communities utilize a wide variety of trees and shrubs found in their regions for multiple purposes, including forage [11]. The current study confirms the findings of which emphasize the significance of browse species as vital feed for various classes of livestock in the central Rift Valley regions as well as the Gamo Gofa and Wolayta zones of Ethiopia. Among the tree and shrub species that were identified by respondents as most useful for livestock feed that provides feed during the dry season include Pappea capensis, Ficus thonningii, Balanites aegyptiaca, Boscia mossambicensis, R. natalensis, A. tortilis (leaf and pod), A. nilotica (leaf and pod), A. brevispica, and G. tembensis. These species contributing more to the feed pool during the dry period, because they can maintain green leaves and produce pods [24,25].
Preference Ranking of Indigenous Browse Trees and Shrub Species
The top five preferred fodder tree and shrub species in the Dire grazing landscape include Pappea capensis, Olea europaea, Acacia tortilis, Balanites aegyptiaca, Grewia tembensis and Grewia evolute. In the Gomole grazing landscape, these preferences are similar, indicating shared ecological conditions. However, in the Woyama grazing landscape, the preferred species change more significantly. The primary fodder species identified are Acacia tortilis, Balanites aegyptiaca, B. mossambicensis, Grewia species, and P. capensis. Notably, B. mossambicensis appears significant in contrast to the Dire and Gomole grazing areas, potentially due to specific local soil or moisture conditions. Similar species selection with variation in ranking reported from northern Ethiopia by Kibret et al., [23]. According to A. tortilis and B. aegypetiaca are the goats' favorite browse fodder Belachew et al., [25]. Acacia tortilis, Boscia mossambicensis, Chionothrix latifolia, Grewia bicolor, Pappea capensis, Acacia brevispica, Grewia tembensis, and Maerua triphylla were identified as important fodder species [26]. The variation in species preference among pastoralists is influenced by the natural abundance of species in grazing landscapes, shaped by local ecological conditions such as rainfall, soil, and topography.
|
Melbe (N=42) |
Dire (N=55) |
Gomole (N=43) |
Woyama (N=49) |
||||||||
|
Species name |
Inde x |
Ra nk |
Species name |
Ind ex |
Ra nk |
Species name |
Ind ex |
Ra nk |
Species name |
Ind ex |
Ra nk |
|
Balanites aegyptiaca |
0.1 |
5 |
Acacia tortilis |
0.1 5 |
1 |
P. capensis |
0.1 3 |
1 |
Balanites aegyptiaca |
0.1 2 |
2 |
|
Olea europaea |
0.11 |
3 |
Pappea capensis |
0.1 4 |
2 |
O. europaea |
0.1 2 |
2 |
Olea europaea |
0.0 9 |
6 |
|
Rhus Spcies |
0.07 |
8 |
Ficus thonningii |
0.1 3 |
3 |
Acacia tortilis |
0.1 2 |
3 |
Rhus Spcies |
0.0 7 |
9 |
|
Acacia bussei |
0.03 |
12 |
Olea europaea |
0.1 2 |
4 |
B. aegyptiaca |
0.1 1 |
4 |
Acacia bussei |
0.0 8 |
8 |
|
Grewia species |
0.13 |
2 |
Grewia species |
0.1 1 |
5 |
Grewia species |
0.1 1 |
5 |
Grewia species |
0.1 |
4 |
|
Pappea capensis |
0.14 |
1 |
Balanites aegyptiaca |
0.1 1 |
6 |
B. mossambice nsis |
0.0 7 |
6 |
Pappea capensis |
0.1 0 |
5 |
|
Ficus thonningii |
0.04 |
11 |
B. mossambice nsis |
0.1 |
7 |
T. brownii |
0.0 7 |
7 |
Ficus thonningii |
0.0 4 |
11 |
|
T. brownii |
0.06 |
9 |
H. foliolosum |
0.0 91 |
8 |
D. microphylla |
0.0 6 |
8 |
T. brownii |
0.0 6 |
10 |
|
B. mossambice nsis |
0.11 |
4 |
Acacia bussei |
0.0 8 |
9 |
Rhus Species |
0.0 4 |
9 |
B. mossambicensi s |
0.1 |
3 |
|
Acacia tortilis |
0.05 |
10 |
T. brownii |
0.0 7 |
10 |
Cordia ovalis |
0.0 3 |
10 |
Acacia tortilis |
0.1 3 |
1 |
|
Cordia gharaf |
0.09 |
6 |
Rhus Spcies |
0.0 6 |
11 |
H. foliolosum |
0.0 2 |
11 |
Cordia gharaf |
0.0 8 |
7 |
|
Phyllanthus sepialis |
0.08 |
7 |
Cordia gharaf |
0.0 4 |
12 |
F. thonningii |
0.0 1 |
12 |
Phyllanthus sepialis |
0.0 3 |
12 |
Table 4: Preference Ranking of the Top Twelve Fodder Tree and Shrub Species in Malbe, Dire, Gomole and Woyama Grazing
Methods of Utilizing Indigenous Browse Trees and Shrub Species
96.82% of respondents allow livestock to browse on fodder trees and shrubs during the rainy season, enabling animals to graze naturally on abundant foliage, thereby reducing labor needs. To sustain livestock during the dry season, where forage is limited, 91.86% of respondents choice to cut-and-carry, browsing, and lopping feeding techniques (Table 5). The majority of the respondents (97.74%) said they use branch cutting, lopping, and collection of pods and leaves for feeding, as these sustainable techniques preserve tree health and promote regrowth. Only 25.79% of people use the destructive method of felling entire trees or shrubs to feed their livestock. In general, these feeding methods demonstrate adaptive pastoral techniques that strike a balance between the preservation of vegetation and the immediate needs of livestock.
|
Indigenous grazing landscape |
In which seasons do you apply cutting trees/shrubs to feeding livestock |
Do you cut branches, lopping, collecting pods and leaves to feed |
Felling trees/shrubs to feed |
||||
|
Dry seasons |
All seasons |
Wet seasons |
Yes |
No |
No |
Yes |
|
|
% (N) |
% (N) |
% (N) |
% (N) |
% (N) |
% (N) |
% (N) |
|
|
Dire |
87.27% (48) |
10.91% (6) |
1.82% (1) |
100.00% (55) |
0.00% (0) |
83.64% (46) |
16.36% (9) |
|
Wayama |
93.88% (46) |
2.04% (1) |
4.08% (2) |
97.96% (48) |
2.04% (1) |
65.31% (32) |
34.69% (17) |
|
Gomole |
97.67% (42) |
0.00% (0) |
2.33% (1) |
100.00% (43) |
0.00% (0) |
76.74% (33) |
23.26% (10) |
|
Indigenous grazing landscape |
In which seasons do you apply cutting trees/shrubs to feeding livestock |
Do you cut branches, lopping, collecting pods and leaves to feed |
Felling trees/shrubs to feed |
||||
|
Dry seasons |
All seasons |
Wet seasons |
Yes |
No |
No |
Yes |
|
|
% (N) |
% (N) |
% (N) |
% (N) |
% (N) |
% (N) |
% (N) |
|
|
Melbe |
95.24% (40) |
4.76% (2) |
0.00% (0) |
90.48% (38) |
9.52% (4) |
64.29% (27) |
35.71% (15) |
|
Golbo |
84.38% (27) |
12.50% (4) |
3.13% (1) |
100.00% (32) |
0.00% (0) |
81.25% (26) |
18.75% (6) |
|
Total |
91.86% (203) |
5.88% (13) |
2.26% (5) |
97.74% (216) |
2.26% (5) |
74.21% (164) |
25.79% (57) |
Table 5: Methods of Grazing/Browsing During Dry and Wet Seasons Across the Indigenous Grazing Landscapes
Perception of Respondents Trends on Availability and Regeneration of Fodder Trees and Shrubs
90.05% of respondents report a decline in the availability of browsing trees and shrubs, indicating a significant concern regarding these essential fodder resources. This trend is noted across indigenous grazing landscapes, with the Melbe grazing landscape showing near-universal agreement among respondents about the decreasing availability of key fodder species. Only 9.50% of respondents believe the availability of fodder trees and shrubs has remained stable, with only one person reporting an increasing trend (Table 6), indicating a negative outlook on these natural resources in the study area. The study in Northern Kenya indicates that the quality of Borana rangeland is deteriorating, with a decline in the availability of major fodder trees and shrubs [27]. The decline in fodder tree and shrub availability is attributed to several interrelated factors: bush encroachment affecting ecosystem balance and species diversity, limited growth due to drought and rainfall shortages, frequent cutting for fuelwood and construction, population growth and land degradation leading to overexploitation, over browsing by livestock damaging young plants, and ineffective management by local communities that fails to address degradation.
|
Indigenou s grazing landscape |
Trends in the availability of browsing trees and shrubs |
Current regeneration status? |
What to expect in the next five years |
|||||||
|
Decreasing |
Stable |
Increasin g |
Scarce |
Moderat e |
No regenerati on |
Plentif ul |
Decreasing |
Stable |
Increasin g |
|
|
Dire |
89.09% (49) |
10.91 % (6) |
0.00% (0) |
54.55% (30) |
32.73% (18) |
12.73% (7) |
0.00% (0) |
90.91% (50) |
9.09% (5) |
0.00% (0) |
|
Wayama |
73.47% (36) |
24.49 % (12) |
2.04% (1) |
34.69% (17) |
57.14% (28) |
8.16% (4) |
0.00% (0) |
77.55% (38) |
22.45% (11) |
0.00% (0) |
|
Gomole |
97.67% (42) |
2.33% (1) |
0.00% (0) |
67.44% (29) |
25.58% (11) |
0.00% (0) |
6.98% (3) |
100.00% (43) |
0.00% (0) |
0.00% (0) |
|
Melbe |
100.00% (42) |
0.00% (0) |
0.00% (0) |
64.29% (27) |
23.81% (10) |
11.90% (5) |
0.00% (0) |
80.95% (34) |
11.90% (5) |
7.14% (3) |
|
Golbo |
93.75% (30) |
6.25% (2) |
0.00% (0) |
53.13% (17) |
40.63% (13) |
0.00% (0) |
6.25% (2) |
87.50% (28) |
6.25% (2) |
6.25% (2) |
|
All |
90.05% (199) |
9.50% (21) |
0.45% (1) |
54.30% (120) |
36.20% (80) |
7.24% (16) |
2.26% (5) |
87.33% (193) |
10.41% (23) |
2.26% (5) |
Table 6: Perception of Respondents (% (N)) on the Availability and Regeneration of Major Indigenous Browsing Tree and Shrubs in the Study Area
Regeneration Status of Selected Fodder Tree and Shrub Species
Natural regeneration is crucial for maintaining sustainable rangelands in pastoral systems that rely on native fodder species. In the Wayama grazing landscape, only a limited number of fodder tree and shrub species exhibited effective natural regeneration, indicated by a robust presence of seedlings, saplings, and mature individuals. These species, including Boswellia neglecta, Grewia evolute, Commiphora, and Acacia nilotica, demonstrate a well-regenerative pattern but show a decline in mature trees (Table 7).An inverted J-shaped regeneration pattern was observed in both protected and grazing areas. In contrast, species like Acacia bussei and Balanites aegyptiaca show critical regeneration failure, with zero seedlings per hectare in both environments. Other fodder trees and shrubs experienced good regeneration in enclosures while struggling in free grazing rangeland, indicating that grazing pressure adversely impacts regeneration (Table 7). Many species lack intermediate maturity stages, leading to an irregular regeneration structure.
|
Species Name |
Vernacula r Name |
Growt h form |
Aver. No. of seedlings/Ha |
Average No of Saplings count |
Aver. No. mat. of Trees, shrubs /Ha |
|
|||
|
|
|||||||||
|
Enclo sure |
Free grazin g |
Enclos ure |
Free grazin g |
Enclos ure |
Free grazi ng |
|
|||
|
Acacia bussei |
Alloo |
Tree |
0 |
0 |
25 |
0 |
68.75 |
25 |
Poor |
|
Acacia nilotica |
Burquqqee |
Tree |
2000 |
3000 |
100 |
100 |
25 |
50 |
Good |
|
Acacia senegal |
S. diimaa |
Tree |
3000 |
0 |
225 |
300 |
68.75 |
112.5 |
Fair |
|
Acacia tortilis |
Dhaddacha |
Tree |
2000 |
50 |
|
|
|
|
Fair |
|
Acalypha fruticosa |
Dh,boorano o |
Shrub |
8000 |
0 |
900 |
0 |
100 |
0 |
Fair |
|
Balanites aegyptiaca |
Baddana |
Tree |
0 |
0 |
100 |
0 |
25 |
12.5 |
Poor |
|
Balanites rotundifolia |
B. okolee |
Tree |
0 |
0 |
0 |
0 |
25 |
50 |
Poor |
|
Boscia mossambicensis |
Qalqalcha |
Tree |
3000 |
2000 |
50 |
0 |
0 |
0 |
Fair |
|
Boswellia neglecta |
Dakkara |
Tree |
3000 |
2000 |
100 |
300 |
75 |
120 |
Good |
|
C. africana |
Hammeessa |
Tree |
0 |
0 |
233.33 |
0 |
133.33 |
175 |
Poor |
|
Commiphora |
H.callaanqa a |
Tree |
1000 |
1000 |
66.67 |
0 |
58.33 |
75 |
Good |
|
Commiphora habessinica |
H.homacho o |
Tree |
0 |
0 |
0 |
350 |
25 |
37.5 |
Poor |
|
Cordia ovalis |
Madheera |
Shrub |
2000 |
0 |
100 |
0 |
0 |
12.5 |
Poor |
|
Grewia evolute |
Harooressa |
Shrub |
6000 |
6000 |
200 |
100 |
25 |
12.5 |
Good |
|
Grewia tembensis |
Dheekkaa |
Shrub |
23000 |
12400 |
600 |
700 |
120 |
0 |
fair |
|
Grewia villosa |
Ogomdii |
Shrub |
8500 |
4000 |
375 |
100 |
18.75 |
0 |
Fair |
|
Hibiscus species |
Bungaala |
Shrub |
33000 |
6000 |
425 |
0 |
68.75 |
0 |
Fair |
|
P.phyllantheoidea |
Ladhana |
Shrub |
6000 |
0 |
200 |
0 |
25 |
10 |
Fair |
|
Phyllanthus sepialis |
Dh.Worsee sso |
Shrub |
6000 |
0 |
300 |
0 |
50 |
0 |
poor |
|
Premna schimperi Engl. |
Xaaxessaa |
Shrub |
4000 |
100 |
250 |
50 |
25 |
10 |
Good |
|
Rhus ruspolii |
Daboobessa |
Shrub |
1000 |
0 |
50 |
0 |
25 |
50 |
Poor |
|
Terminalia brownii |
Birreessa |
Tree |
0 |
0 |
0 |
0 |
10 |
25 |
Poor |
Regeneration status, Good = seedlings > saplings > adults, fair = seedlings > or ≤ saplings ≤ matured, poor = species is represented by only saplings, Non-regenerating = if a species is represented by only matured trees.
Table 7: Average Number of Seedlings, Saplings and Matured Trees and Shrubs Per Hectare of Selected Fodder Tree and Shrub Species under Enclosure and Free Grazing Land in Wayama Indigenous Grazing Landscape
In the Gomole grazing landscape, species like Dalbergia microphylla, Grewia evolute, Grewia tembensis, Terminalia brownii, and Rhus ruspolii show good natural regeneration across enclosure and grazing areas. Conversely, Acacia etabaica, Albizia amara, Cordia ovalis, Pappea capensis, Grewia villosa, and Premna schimperi exhibit poor regeneration, with zero seedlings per hectare in both environments, indicating significant regeneration failure. Others fodder trees and shrubs such as Acacia brevispica, A. tortilis, Olea europaea, Cordia ovalis, P.phyllantheoidea were Phyllanthus sepialis have good regeneration in enclosures and poor in free grazing rangeland (Table 8). This suggests that grazing pressure adversely impacts the regeneration of various species, resulting in a disrupted process where many individual seedlings fail to survive or develop into saplings or mature trees and shrubs, likely due to factors like browsing, trampling, or environmental stresses
|
Species name |
Aver. No. of seedlings/ha |
Average No of Saplings /ha |
Aver. No. mat. of Trees, shrubs /ha |
Regen. Statas |
|||
|
Enclosure |
Free Grazing |
Enclosure |
Free Grazing |
Enclosure |
Free Grazing |
||
|
Acacia brevispica |
8000 |
0 |
200 |
0 |
25 |
100 |
fair |
|
Acacia etabaica |
0 |
0 |
0 |
0 |
0 |
25 |
poor |
|
Acacia nilotica |
0 |
9777.78 |
0 |
0 |
50 |
38.89 |
poor |
|
Acacia tortilis |
8000 |
285.7143 |
300 |
0 |
50 |
35.72 |
poor |
|
Acalypha fruticosa |
4000 |
4000 |
200 |
0 |
100 |
0 |
good |
|
Albizia amara |
0 |
0 |
200 |
100 |
100 |
0 |
poor |
|
Balanites aegyptiaca |
6000 |
1200 |
125 |
240 |
12.5 |
65 |
good |
|
Balanites rotundifolia |
2000 |
4000 |
0 |
0 |
50 |
0 |
good |
|
Boscia mossambicensis |
6000 |
2000 |
0 |
100 |
0 |
100 |
good |
|
Boswellia neglecta |
0 |
1000 |
0 |
0 |
0 |
50 |
poor |
|
Combretum molle |
3333.33 |
5200 |
0 |
240 |
41.67 |
10 |
good |
|
Commiphora africana |
2000 |
10333.33 |
100 |
66.67 |
0 |
25 |
good |
|
C. habessinica |
2000 |
1000 |
0 |
0 |
0 |
62.5 |
fair |
|
Cordia ovalis |
0 |
0 |
0 |
0 |
50 |
0 |
poor |
|
Dalbergia microphylla |
10000 |
4000 |
100 |
150 |
25 |
87.5 |
good |
|
Grewia evolute |
6000 |
2666.67 |
100 |
83.33 |
25 |
29.17 |
good |
|
Grewia tembensis |
7333.333 |
8000 |
125 |
33.33 |
16.67 |
12.5 |
good |
|
Grewia villosa |
3000 |
4000 |
100 |
0 |
0 |
0 |
Poor |
|
Olea europaea |
4000 |
0 |
0 |
0 |
0 |
25 |
poor |
|
Pappea capensis |
0 |
0 |
0 |
- |
2.5 |
0 |
poor |
|
Premna schimperi |
0 |
0 |
0 |
0 |
125 |
0 |
poor |
|
Psiadia incana |
2666.67 |
5000 |
366.67 |
0 |
12.5 |
0 |
poor |
|
Rhynchosia ferruginea |
2000 |
0 |
400 |
287.5 |
200 |
0 |
fair |
|
Terminalia brownii |
10000 |
1333.333 |
500 |
100 |
100 |
25 |
good |
Table 8: Average Number of Seedlings, Saplings and Matured Trees and Shrubs Per Hectare of Selected Fodder Tree and Shrub Species in Gomole Indigenous Grazing Landscape
The regeneration dynamics of fodder trees and shrubs in the Dirre grazing landscape reveal that most key species, including various Acacia species and others like Boswellia rotundifolia and Ficus thonningii, lack normal germination structures, resulting in minimal seedling production and very low germination rates in both protected and free grazing areas (Table 9). This findings highlights the challenges certain species face in natural regeneration, posing risks to their population sustainability. It notes that mature trees and saplings are often rare despite a high number of seedlings, indicating a regeneration bottleneck. This issue is attributed to intense grazing pressures from livestock, along with abiotic factors such as drought, soil degradation, and competition. Normal regeneration of fodder trees and shrubs in the Dirre grazing landscape are significantly hindered, low seedling survival rates. This skewed population structure threatens the long-term availability of essential fodder resources for livelihoods and ecosystem stability.
|
Species Name |
Vernacula r Name |
Average No of Seedlings/ha |
Average No of Saplings/ha |
Average No of tree and shrubs /ha |
Reg. statu s |
|||
|
|
|
|||||||
|
Enclosu re |
Free Grazing |
Enclos ure |
Free Grazing |
Encl osur e |
Free Grazing |
|
||
|
Acacia etabaica |
Alaqabeessa |
0 |
0 |
66.67 |
0 |
50 |
25 |
poor |
|
Acacia brevispica |
Hammarree ssa |
0 |
0 |
0 |
|
150 |
75 |
poor |
|
Acacia bussei |
Alloo |
0 |
0 |
0 |
0 |
125 |
12.5 |
poor |
|
Acacia nilotica |
Burquqqee |
6666.6 7 |
0 |
100 |
0 |
25 |
50 |
fair |
|
Acacia tortilis |
Dhaddacha |
0 |
0 |
0 |
0 |
25 |
100 |
poor |
|
Balanites aegyptiaca |
Baddana |
10000 |
1200 |
400 |
12.5 |
150 |
8.33 |
good |
|
B. rotundifolia |
B. okolee |
0 |
0 |
200 |
120 |
0 |
12.5 |
poor |
|
Boswellia neglecta |
Dakkara |
0 |
4000 |
200 |
0 |
125 |
25 |
Fair |
|
Combretum molle |
Rukeessa |
0 |
0 |
0 |
0 |
125 |
25 |
poor |
|
C. africana |
Hammeessa |
6666.6 7 |
12000 |
66.67 |
300 |
0 |
37.5 |
good |
|
C. habessinica |
H. callaanqaa |
0 |
0 |
100 |
0 |
0 |
75 |
poor |
|
Commiphora ss |
H. homachoo |
3000 |
4000 |
0 |
100 |
12.5 |
62.5 |
good |
|
Cordia gharaf |
Madheera |
3000 |
0 |
0 |
50 |
0 |
12.5 |
poor |
|
D. microphylla |
Walchaamal a |
0 |
0 |
0 |
100 |
25 |
25 |
poor |
|
Dombeya aethiopica |
Daanniasa |
0 |
0 |
0 |
100 |
25 |
100 |
poor |
|
Ficus glumosa |
Qilxaa |
0 |
0 |
0 |
0 |
12.5 |
25 |
Non |
|
Ficus thonningii |
Dambii |
0 |
0 |
25 |
|
6.25 |
0 |
poor |
|
Grewia evolute |
Harooressa |
5500 |
1000 |
175 |
150 |
62.5 |
62.5 |
good |
|
Grewia tembensis |
Dheekkaa |
6000 |
3714.2 9 |
75 |
157. 1 |
6.25 |
28.57 |
good |
|
Grewia villosa |
Ogomdii |
4500 |
0 |
25 |
12.5 |
6.25 |
0 |
fair |
|
Olea europaea |
Ejersa |
0 |
18000 |
0 |
800 |
6.25 |
62.5 |
fair |
|
Pappea capensis |
Biiqqaa |
1500 |
2000 |
75 |
100 |
50 |
8.33 |
good |
|
Phyllanthus sepialis |
Dh. daalattii |
17333. 33 |
0 |
1000 |
0 |
50 |
133.33 |
good |
|
Psiadia incana |
Qaxxee |
17333. 33 |
16500 |
683.33 |
225 |
79.17 |
25 |
good |
Table 9: Average Number of Seedlings, Saplings and Matured Trees and Shrubs Per Hectare of Selected Fodder Tree and Shrub Species in Dirre Grazing Landscape
In the Melbe grazing landscape, natural regeneration of fodder trees and shrubs is significantly better than in other grazing areas. Enclosed land use promotes high seedling density due to limited grazing, allowing young plants to thrive without livestock interference. This leads to better survival rates for seedlings. Conversely, unrestricted free grazing significantly reduces the regeneration capacity of many important fodder species, including Acacia nilotica and Combretum molle, among others were not observed at all (Table 10). The effects of continuous grazing, trampling, and browsing hinder seedling survival and establishment, resulting in limited or absent regeneration. Although many fodder trees and shrubs can regenerate naturally, few seedlings reach maturity, indicating potential growth bottlenecks. Young plants face challenges such as browsing damage, harsh conditions, insufficient moisture, and competition from grasses. This restricted growth may threaten the future sustainability of the ecosystem and the availability of fodder biomass.
|
Species Name |
Vernacular Name |
Average of Seedling/ha |
Average of Sapling/Ha |
Average of tree/ha |
Regen. status |
|||
|
Enclosure |
Free grazing |
Enclosure |
Free grazing |
Enclosure |
Free grazing |
|||
|
Acacia brevispica |
Hammarreessa |
2000 |
2000 |
0 |
300 |
0 |
175 |
good |
|
Acacia nilotica |
Burquqqee |
500 |
0 |
0 |
0 |
25 |
37.5 |
poor |
|
Acacia tortilis |
Dhaddacha |
3000 |
3500 |
0 |
125 |
37.5 |
37.5 |
good |
|
Acalypha fruticosa |
Dhiirrii diimtuu |
7500 |
4000 |
1125 |
350 |
287.5 |
131.25 |
good |
|
B. mossambicensis |
Qalqalcha |
2000 |
0 |
0 |
0 |
0 |
25 |
poor |
|
Balanites aegyptiaca |
Baddana |
4000 |
6000 |
300 |
0 |
0 |
25 |
good |
|
C. africana |
Hammeessa |
2000 |
2000 |
200 |
0 |
33.33 |
25 |
good |
|
C. erythraea |
Agarsuu |
2000 |
0 |
66.67 |
0.00 |
33.33 |
75 |
good |
|
Combretum molle |
Rukeessa |
8000 |
0 |
500 |
0 |
50 |
0 |
fair |
|
Cordia gharaf |
Madheera |
2666.67 |
2000 |
0 |
0 |
16.67 |
16.67 |
fair |
|
Grewia evolute Juss |
Harooressa |
5666.67 |
5428.57 |
516.67 |
185.71 |
54.17 |
32.14 |
good |
|
Grewia tembensis |
Dheekkaa |
2400 |
1666.67 |
440 |
350 |
100 |
45.83 |
good |
|
Grewia villosa |
Ogomdii |
2285.71 |
2000 |
171.43 |
66.67 |
117.86 |
41.67 |
good |
|
Hibiscus boranensis |
Bungaala |
9000 |
5666.67 |
683.33 |
200 |
150 |
91.67 |
good |
|
P. tenuiflorus |
Barbarreessa |
0 |
4000 |
600 |
0 |
50 |
0 |
poor |
|
Pappea capensis |
Biiqqaa |
2000 |
0 |
0 |
0 |
12.5 |
0 |
poor |
|
Phyllanthus sepialis |
Dhirrii daalattii |
4666.67 |
|
266.67 |
|
108.33 |
0 |
good |
|
Premna schimperi |
Xaaxessaa |
6000 |
1333.33 |
250 |
33.33 |
0 |
16.67 |
good |
|
Psiadia incana |
Qaxxee |
8000 |
12000 |
200 |
350 |
50 |
75 |
good |
|
Rhus ruspolii |
Daboobessa |
4000 |
3200 |
433.33 |
240 |
45.83 |
30 |
good |
|
Terminalia brownii |
Birreessa |
3333.33 |
0 |
0 |
0 |
8.33 |
0 |
poor |
Table 10: Average Number of Seedlings, Saplings and Matured Trees and Shrubs Per Hectare of Selected Fodder Tree and Shrub Species in Malbe Indigenous Grazing Landscape
Overall, in all grazing land scrapes, the study found that most fodder tree and shrub species in grazing land scrapes have disturbed regeneration structures due to grazing pressure, browsing, trampling, environmental stresses, and drought, emphasizing the need for protection. Many studies have documented the negative impacts of grazing pressure that result in the natural regeneration failure [28-30]. Therefore, conservation of fodder trees and shrubs is facing regeneration problems by promoting natural regeneration, reducing disturbance, and enhancing sustainable use practices.
Conclusion
The present study assessed the major fodder tree and shrub species and their natural regeneration status in Borana rangeland. Native fodder trees and shrubs are essential for feeding cattle, particularly during dry seasons when there is a shortage of other forage. Pastoral and agro-pastoral communities generally rely heavily on these species for fuelwood, additional fodder, and other purposes, according to household surveys. The availability and regeneration of important fodder tree and shrub species are declining, and those demonstrated poor regeneration require conservation measures like Pappea capensis, Olea europaea, Acacia tortilis, Balanites aegyptiaca,G. tembensis and G. evolute). In addition to providing feed, these species support rangeland ecosystem sustainability, biodiversity, and soil conservation. Seasonal variability, overgrazing pressures, year-round fodder scarcity, and the restricted integration of certain native species into farmlands are among the difficulties.
Recommendation
Fodder trees and shrubs greatly benefit pastoral areas. To combat degradation and enhance regeneration, conservation measures for key species should be supported through community initiatives, fostering the sustainable management of native fodder shrubs and trees. Promoting the inclusion of more native fodder species in rangeland restoration, agroforestry, and homesteading can enhance year-round feed availability. Encourage pastoralists and agro pastoralists to increase their knowledge and skills regarding the advantages of these species for enhancing ecosystem health and livestock productivity. To safeguard regenerating species, policies should be implemented that support controlled grazing methods and overgrazing. Encourage research and development organization for improve methods of propagation, nutritional analysis, and various uses of the native species. To maximize the use and preservation of these resources for long-term sustainability, the connections between scientific research and indigenous knowledge should be strengthened.
References
- Sorn, S. (2003). Increasing the Germination Capacity of Tree Cuttings. Retrieved on January, 15, 2013.
- Gina, T. G., Nigatu, L., & Animut, G. (2014). Biodiversity of indigenous multipurpose fodder trees of wolayta zone, southern Ethiopia: ecological and socio-economic importance. International Journal of Emerging Technology and Advanced Engineering, 4(5), 494-503.
- Ibrahim, M., Villanueva, C., & Mora, J. (2005). Traditional and improved silvopastoral systems and their importance in sustainability of livestock farms. In Silvopastoralism and sustainable land management. Proceedings of an international congress on silvopastoralism and sustainable management held in Lugo, Spain, April 2004 (pp. 13-18). Wallingford UK: CABI publishing.
- Moreno, G., & Obrador, J. J. (2007). Effects of trees and understorey management on soil fertility and nutritional status of holm oaks in Spanish dehesas. Nutrient Cycling in Agroecosystems, 78(3), 253-264.
- Papanastasis, V. P., Yiakoulaki, M. D., Decandia, M., & Dini-Papanastasi, O. (2008). Integrating woody species into livestock feeding in the Mediterranean areas of Europe. Animal Feed Science and Technology, 140(1-2), 1-17.
- Kökten, K., Kaplan, M., HatipoÄ?lu, R., Saruhan, V., & Çınar,S. (2012). Nutritive value of Mediterranean shrubs.
- Barakat, N. A., Laudadio, V., Cazzato, E., & Tufarelli, V. (2013). Potential contribution of Retama raetam (Forssk.) Webb & Berthel as a forage shrub in Sinai, Egypt. Arid Land Research and Management, 27(3), 257-271.
- Franzel, S., Carsan, S., Lukuyu, B., Sinja, J., & Wambugu,C. (2014). Fodder trees for improving livestock productivity and smallholder livelihoods in Africa. Current opinion in environmental sustainability, 6, 98-103.
- FAO. (1991). Legume Trees and other Fodder Trees as Protein Sources for Livestock. Proceedings of the FAO Expert Consultation held at the Malaysian Agricultural Research and Development Institute (MARDI) in Kuala Lumpur, Malaysia, 14–18 October 1991.
- Jamala, G. Y., Tarimbuka, I. L., Moris, D., Mahai, S., & Adamawa, S. (2013). The scope and potentials of fodder trees and shrubs in agroforestry. Journal of Agriculture and Veterinary Science, 5(4), 11-17.
- Gemedo-Dalle, T., Maass, B. L., & Isselstein, J. (2005). Plant biodiversity and ethnobotany of Borana pastoralists in southern Oromia, Ethiopia. Economic botany, 59(1), 43-65.
- Coppock, D. L. (Ed.). (1994). The Borana plateau of southern Ethiopia: synthesis of pastoral research, development, and change, 1980-91 (Vol. 5). ILRI (aka ILCA and ILRAD).
- Kothari, C. R. (2004). Research methodology: Methods and techniques. New Age International.
- Musa, L. M. A., Peters, K. J., & Ahmed, M. K. A. (2006).On farm characterization of Butana and Kenana cattle breed production systems in Sudan. Livestock research for rural development, 18(12), 1-15.
- Jayakumar, R., & Nair, K. K. N. (2013). Species diversity and tree regeneration patterns in tropical forests of the Western Ghats, India. International Scholarly Research Notices, 2013(1), 890862.
- Gebeyehu, G., Soromessa, T., Bekele, T., & Teketay, D. (2019). Species composition, stand structure, and regeneration status of tree species in dry Afromontane forests of Awi Zone, northwestern Ethiopia. Ecosystem Health and Sustainability, 5(1), 199-215.
- Fenetahun, Y., Yuan, Y., Xu, X. W., & Wang, Y. D. (2022). Borana rangeland of southern Ethiopia: Estimating biomass production and carrying capacity using field and remote sensing data. Plant Diversity, 44(6), 598-606.
- Daba, B., & Mammo, S. (2024). Rangeland degradation and management practice in Ethiopia: A systematic review paper. Environmental and Sustainability Indicators, 23, 100413.
- Zerga, B. (2025). Arid land degradation issues in Ethiopia: the case of the Borana and Afar rangeland systems: a review. Journal of Rangeland Science, 15(3).
- Hailesilassie, H. (2016). The effect of improved fodder production on livestock productivity in Endamehoni District, southern Tigray Ethiopia (Doctoral dissertation, Mekelle University).
- Derero, A., & Kitaw, G. (2018). Nutritive values of seven high priority indigenous fodder tree species in pastoral and agro-pastoral areas in Eastern Ethiopia. Agriculture & Food Security, 7(1), 68.
- Keba, D., Tolemarim, T., Demeke, S., & Hundie, D. (2020). Species and Chemical Composition, Productivity and Utilization of Grazing Lands in Bako-Tibe District, West Shewa, Oromia.
- Kibret, B., Asmare, B., & Yeheyis, L. (2025). Diversity, preference criteria and feeding practice of indigenous browse fodder by livestock farmers in northwest Ethiopia. Journal of Livestock Science (ISSN online 2277-6214), 16, 173-185.
- Beche, D., Gebeyehu, G., & Feyisa, K. (2016). Indigenous utilization and management of useful plants in and around Awash National Park, Ethiopia. J Plant Biol Soil Health, 3(1), 12.
- Belachew, M. T., Mersso, B. T., & Yadeta, A. T. (2020).Indigenous browse species and goats preferences in selected districts of Gamo Gofa and Wolayta zones, Ethiopia. International Journal of Livestock Production, 11(1), 34-42.
- Gemedo-Dalle, Isselstein, J., & Maass, B. L. (2006). Indigenous ecological knowledge of Borana pastoralists in southern Ethiopia and current challenges. The International Journal of Sustainable Development and World Ecology, 13(2), 113-130.
- Dabasso, B. H., Oba, G., & Roba, H. G. (2012). Livestock-based knowledge of rangeland quality assessment and monitoring at landscape level among borana herders of northern Kenya. Pastoralism: Research, Policy and Practice, 2(1), 2.
- Kikoti, I. A., Mligo, C., & Kilemo, D. B. (2015). The impact of grazing on plant natural regeneration in northern slopes of Mount Kilimanjaro, Tanzania. Open Journal of Ecology, 5(06), 266-273.
- Habte, M., Eshetu, M., Andualem, D., Maryo, M., & Legesse, A. (2021). The inventory of camel feed resource and the evaluation of its chemical composition in south-east rangelands of Ethiopia. Veterinary medicine and science, 7(4), 1172-1184.
- Maestre, F. T., Le Bagousse-Pinguet, Y., Delgado-Baquerizo, M., Eldridge, D. J., Saiz, H., Berdugo, M., ... & Gross, N. (2022). Grazing and ecosystem service delivery in global drylands. Science, 378(6622), 915-920.