
Petroleum and Chemical Industry International(PCII)
ISSN: 2639-7536 | DOI: 10.33140/PCII
Impact Factor: 0.719

Review Article - (2024) Volume 7, Issue 4
Analysis of the Carbon Footprint in Green and Fossil Fuel Production
Received Date: Oct 18, 2024 / Accepted Date: Nov 12, 2024 / Published Date: Nov 19, 2024
Copyright: ©Â©2024 C. Armenta-Deu, et al. This is an open-access article distributed under the terms of the Creative Commons Attribution License, which permits unrestricted use, distribution, and reproduction in any medium, provided the original author and source are credited.
Citation: Deu, C. A., Avial, I. (2024). Analysis of the Carbon Footprint in Green and Fossil Fuel Production. Petro Chem Indus Intern, 7(4), 01-10.
Abstract
This study compares the carbon footprint of clean versus fossil fuels using the ”Well-To-Wheels”(WTW) methodology, which considers all stages from production to consumption in vehicles. We evaluate fossil fuels like diesel, gasoline, LPG, and electric- ity. The results show that electric cars emit less CO2 during use, but it is essential to consider emissions from electricity produc- tion for a full assessment. Transitioning to clean fuels reduces emissions, but improving technologies is critical to maximizing environmental benefits. The study shows that battery and fuel cell electric vehicles are the most respectful to the environment when generating electricity in renewable energy plants. The analysis shows that fossil fuel engine cars and hybrid and plug-in hybrid electric vehicles have similar carbon footprints because of the high fossil fuel dependence, the high fraction of the driving range, and carbon dioxide emissions in thermal power plants during electricity generation for battery charge in plug-in electric vehicles. This situation reverses producing electricity in renewable energy systems. The study applies to any condition, world area, or country development despite the system development for specific driving conditions and world geographical area since the study develops a comparative analysis between engine types, regardless of driving mode or reference consumption rate.
Keywords
Carbon footprint, Well-To-Wheel (WTW) Methodology, Fossil and Clean Fuels, Electric Vehicle
Introduction
This work focuses on the environmental impact of green fuels compared with fossil fuels, including all production and distribution processes. The study analyzes the most used fossil fuels: gasoline, diesel, or petrol liquid gas, biofuels like biodiesel or bioethanol, and the electric energy generation for electric vehicle battery charge. The study develops an analysis of the fuels powering cars, aiming to evaluate the benefits derived from the replacement of conventional fossil fuels by green ones. The process follows the "Well to Wheel" methodology, meaning we should consider all production and distribution steps from the extraction of natural resources to their use in vehicles, moving through refining and distribution. In this work, we applied the "Well to Tank" (WTT) and "Tank to Wheel" (TTW) methodologies, covering all steps that generate carbon emissions. This procedure is widely used by researchers, professionals, and environmental agencies to develop projects and research [1]. The "Well to Wheel" (WTW) methodology includes a complete evaluation of vehicle environmental impact, starting with the natural resource extraction and ending in the final use for powering internal combustion engines or electric motors. The WTW methodology is a Life Cycle Assessment (LCA) technique simplification since it focuses on the carbon emissions generated by fossil and green fuels for powering vehicles transformation, transportation, and consumption [2]. The increasing worry about climatic change and the need for GHG emissions reduction leads to a deeper analysis of the vehicle's lifespan carbon footprint, independent of the type and characteristics of the analyzed car. Previous work demonstrates that the WTW method is a practical tool to evaluate the global carbon emissions of any fuel that powers a vehicle [1-3].
Fossil and Green Fuels
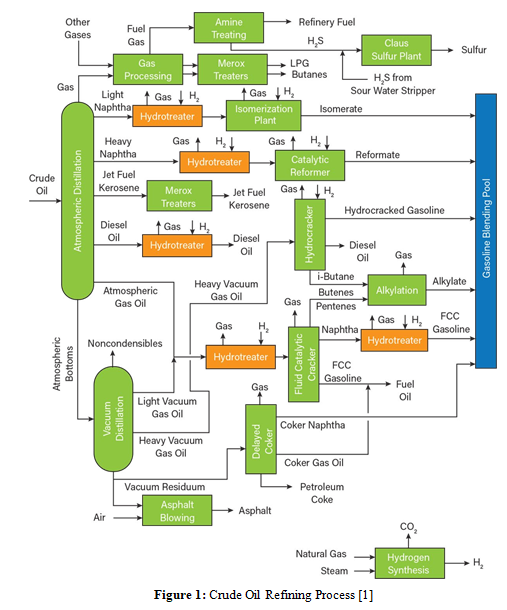
Fossil fuels used for the automobile industry derive from crude oil refining (Figure 1). The most important process in the crude oil refining are the fractioned distillation, the cracking, the hydro-treatment, the reforming, the hydrocracking reforming, the isomerization, and the mixing [4-14]. Any of the above-mentioned processes requires specific chemical treatment and energy supply to obtain the final product. Among the many products we obtain from the crude oil refining, we focus on fuels for powering cars: gasoline, diesel, and liquid petrol gas (LPG). Green fuels like biodiesel or bioethanol derive from organic matter and vegetable materials; an alternative classification is first- or second-generation biofuels [15]. First generation biofuels are produced from food crops such as corn, wheat, sugar cane, rapeseed, sunflower seeds and palm oil. Bioethanol derive from primary matter enriched in sugar and starch while biodiesel is produced from oil and grass vegetables. In USA the primary matter for bioethanol production is corn while in Brazil is sugar cane; biodiesel, a fuel largely produced in the European Union, mainly derives from rapeseed oil. First-generation biofuels show an energy-close behavior with primary matters used to produce fossil fuels, resulting in high compatibility with these latter fuels so we can mix them for vehicle powering. On the other hand, they have drawbacks since they compete with the food crops industry, reducing the availability of primary matter; besides, they impact biodiversity, water, and soil and increase carbon emissions due to a landfall change of use [16].
Second-generation biofuel production derives from non-food crops like dedicated energy crops (perennial grasses, short-rotation willows, and other lignocellulosic plants) and waste biomass (agricultural, forestry, and urban solid waste). The second- generation biofuel industry prefers biomass residues to dedicated energy crops because they avoid landfall and water waste and reduce onsite carbon emissions. The principal second-generation biofuels are bioethanol and biodiesel, although recent developments include bio-hydrogen, bio-methanol, bio-DMF, bio DME, and Fischer- Tropsch biodiesel among alternative biofuels [16].The production follows two ways: thermochemical and biochemical processes. Thermochemical production includes liquefaction, gasification, and pyrolysis to generate liquid fuels and synthetic gas (syngas). Biochemical processes include anaerobic digestion and chemical and biological conversion to obtain biodiesel and ethanol.
Hydrogen is not a fuel but an energy vector because there is no free hydrogen in nature; it appears linked to another element. Therefore, hydrogen generation requires a transformation process to free the hydrogen so we can use it in a fuel cell [17]. The two methods to produce free hydrogen are reforming and electrolysis [18, 19].
Steam Methane Reforming (SMR) uses methane as a primary matter to generate free hydrogen in a process like shown in Equation 1.
CH4 (g) + H2O(v) + CO(g) + 3H2 (g) (1)
In the SMR process, the methane reacts with water vapor at high temperatures to produce carbon monoxide and hydrogen, as shown in Equation 1. The chemical reaction requires the presence of a catalyzer, currently nickel and heat supply [18].
The hydrogen passes through a chemical absorber, storing the gas in a specific container. The carbon monoxide reacts with water producing carbon dioxide and hydrogen (Equation 2).
CO(g) + H2O(v) + CO2 (g) + H2 (g) (2)
The carbon dioxide is captured and stored to reduce carbon emissions and environmental impact [20].
The electrolysis requires distilled water or brine [19]. In this latter case (alkaline electrolysis), we use an alkaline solution (KOH, NaOH, NaCl) at 60-80º C. The technique is simple and cheap, has a long lifespan, and operates in large production plants. Nevertheless, the current density is low, and the maintenance costs are high. The efficiency is in the range of 43-69% [19]. The distilled water electrolysis uses a polymeric proton exchange membrane (PEM), currently Nafion, as an electrolyte. The water dissociation requires noble metals like platinum or iridium and operates at 50- 80º C. The process may work at higher pressures than alkaline electrolysis, up to 80 bars. The efficiency is similar to the alkaline electrolysis, 40-69%, but the process is more expensive due to the presence of noble metals. On the other hand, the current density is higher, the process runs faster, and the elements do not suffer from corrosion. However, the lifespan is shorter.
Electricity Generation
Electricity for powering vehicles is not a traditional fuel but an energy source generated from fossil or green fuels like coal, gas, oil, nuclear, hydropower, solar, or wind. Electricity generation in coal power plants uses a combustion process to produce water vapor to move a turbine linked to an electric generator [21]. In gas power plants, the combustion process generates reheated gas to rotate the turbine; the enthalpy excess is driven to a vapor turbine to generate an extra electric current in a combined cycle power plant that increases global efficiency [22]. Nuclear power plants operate in a similar way to coal power plants using nuclear reactions instead of coal combustion to heat water and produce water vapor. The great advantage of nuclear power plants is that they do not emit carbon dioxide only water vapor [23]. Electricity generation from renewable sources occur in solar thermal power plants, photovoltaic arrays, wind farms, geothermal power plants, or hydroelectric installations [24-28]. Solar thermal and geothermal power plants operate on the same basis as coal, gas, or nuclear, heating water to produce water vapor, which rotates a turbine connected to the electric generator. Photovoltaic arrays directly convert solar radiation into electricity using solar cells, while wind farms use the wind kinetic energy to generate electric current in a wind turbine. Finally, hydropower generation converts gravitational into kinetic energy to rotate a turbine linked to an electric generator to produce electricity.
Vehicle GHG Emissions
In this section, we develop a comparative analysis of GHG emissions from various types of vehicles, internal combustion engine (ICE) and electric in their different modalities, gasoline, diesel, compressed natural gas (CNG), and liquefied petroleum gas (LPG) for the internal combustion engines, and hybrid (HEV), plug- in hybrid (PHEV), battery (BEV), and fuel cell (FCEV) electric vehicles. We select cars of similar characteristics to develop a fair and accurate GHG emissions analysis. Table 1 shows the vehicle selection and its most relevant characteristics for the study.
|
Vehicle |
Fuel type |
Power (CV/kW) |
Consumption rate |
|
Volkswagen Golf 1.5 TSI |
Gasoline |
116/85 |
0.054 L/km |
|
Audi A3 Sedan 30 TDI |
Diesel |
116/85 |
0.054 L/km |
|
Seat Ibiza 1.5 TSI |
CNG |
115/84.3 |
0.033 kg/km |
|
Citroën C-Elysée |
LPG |
11584.3 |
0.064 L/km |
|
Seat León 1.5 TSI |
HEV |
115/84.3 |
0.055 L/km |
|
DS 4 Hybrid Pallas |
PHEV |
136/100 |
0.052 L/km |
|
Fiat 500e |
BEV |
118/86 |
169 Wh/km |
|
Hyundai Nexo |
FCEV |
136/100 |
0.0084 kg/km |
Table 1: Vehicle Type and Characteristics
Although battery and fuel cell electric vehicles do not produce GHG emissions during driving, we include them in the analysis since the electricity to charge the battery or to generate the hydrogen proceeds from power plants that currently operate with fossil fuel, emitting GHG to the atmosphere. Considering the carbon dioxide emissions as the most relevant GHG, we focus the study on this gas to evaluate carbon emissions to the environment. Retrieving data from the literature on the CO2 emitted per unit of fuel used, gasoline, diesel, CNG, or LPG, we determine the carbon emissions rate for each selected vehicle (Table 2) [29].
|
Vehicle |
CO2 emissions (kg/km) |
|
Volkswagen Golf 1.5 TSI |
0.127 |
|
Audi A3 Sedan 30 TDI |
0.144 |
|
Seat Ibiza 1.5 TSI |
0.091 |
|
Citroën C-Elysée |
0.097 |
|
Seat León 1.5 TSI |
0.129 |
|
DS 4 Hybrid Pallas |
0.122 |
|
Fiat 500e |
0 |
|
Hyundai Nexo |
0 |
Table 2: Direct Carbon Dioxide Emissions Rate
The analysis of results in Table 2 shows that direct carbon dioxide emissions from vehicles with similar engine power are close to each other, with lower values, around 28%, for CNG and LPG engines. The values shown in Table 2 depend on the driving mode since the consumption rate equally depends on the driving mode; therefore, we should expand the analysis to cover the most common driving attitudes, conservative, moderate, and aggressive, also known in the driving industry language as eco, normal and sport mode. According to the literature, the conservative driving mode consumes 30% less than the normal mode, while the aggressive uses a 20 % more [30, 31]. Table 3 shows the carbon dioxide corrected values for the three driving modes.
|
|
Vehicle engine type |
||||||
|
Driving mode |
Gasoline |
Diesel |
CNG |
LPG |
HEV (g) |
HEV (d) |
PHEV |
|
Conservative |
0.098 |
0.111 |
0.070 |
0.075 |
0.099 |
0.112 |
0.094 |
|
Moderate |
0.127 |
0.144 |
0.091 |
0.097 |
0.129 |
0.146 |
0.122 |
|
Aggressive |
0.152 |
0.173 |
0.109 |
0.116 |
0.155 |
0.175 |
0.146 |
Table 3: Vehicle Carbon Dioxide Emissions for Different Driving Mode (Kg/Km)
We selected two types of hybrid electric vehicles: gasoline HEV (g) and diesel HEV (d).
Electricity Generation Carbon Emissions
Since fossil fuel production derives from different oil refining and distillation processes, we analyzed every fuel production path to determine the carbon emissions due to the corresponding process. The fractioned distillation consumes 392.16 kJ/kg of processed oil, producing 0.5-3% of LPG, 13.5-26% of gasoline, and 21.5- 27.5% of diesel [32, 33]. For the calculation, we consider the average value of the above ranges, 1.75% for LPG, 19.75% for gasoline, and 24.50% for diesel. Considering that an oil barrel equals 159 liters and retrieving the oil density, 814.5 kg/m3, the barrel oil mass is 129.51 kg. On the other hand, the average carbon emissions for electricity generation is 120 kg/MWh, equal to 0.033 kg/MJ [34-36]. The next step is determining the carbon emissions associated with every fuel production; therefore, we analyze the different fuels used in the automobile industry.
• Gasoline: The gasoline production process requires additional steps other than fractioned distillation like the catalytic reforming, which consumes 495.31 kJ/kg; therefore, to produce a liter of gasoline, the process consumes 6.85 kJ/kg and emits 0.226 kilograms of carbon dioxide [33].
• Diesel: Diesel production requires hydro-cracking as an additional step to the fractioned distillation, adding 263.30 kJ/ kg [33]. Considering the diesel fraction from the crude oil, the diesel production energy consumption is 5.06 kJ/kg, representing a carbon dioxide emission of 0.167 kg per liter of diesel.
• LPG: The liquefied petroleum gas production requires a recovering process that adds 69.56 kJ/kg to the fractioned distillation, meaning an energy consumption of 3.56 kJ/kg, with carbon dioxide emissions of 0.118 kg per kilogram of LPG.
• CNG: Because the natural gas precedence is variable, we evaluate the environmental impact of the CNG depending on the geographical extraction point and transportation distance. For instance, in dealing with the European Union, three situations arise natural gas produced inside the European Union, natural gas extracted in the Middle East and carried from a distance of 4000 km, and natural gas from Siberia or the USA, transported for a distance of 7000 km. The geographical distance is relevant since the ship transportation consumes energy. According to reports from the EU, the carbon emissions due to compressed natural gas are (Table 4) [37].
|
Precedence |
CO2 emissions (kg/MJ) |
|
EU |
0.0084 |
|
Middle East |
0.0140 |
|
Siberia/USA |
0.0217 |
Table 4: Carbon Emissions Due to Compressed Natural Gas
We notice that the carbon emissions increase with distance in a non-linear way; therefore, the longer the distance from the extraction point, the higher the carbon emissions increase rate. Applying the CNG heat power, 47.1 MJ/kg, we may convert the carbon emission data in Table 4 into carbon emission values per CNG mass unit (Table 5) [38].
|
Precedence |
CO2 emissions (kg/kg CNG) |
|
EU |
0.40 |
|
Middle East |
0.66 |
|
Siberia/USA |
1.02 |
Table 5: Carbon Dioxide Emissions Per Gnc Mass Unit
For a mix of 42.5% EU, 16% Middle East, and 41.5% Siberia/USA, the average CO2 emissions are 0.697 kg per kilogram of CNG [39]. Summarizing yields (Table 6):
|
Gasoline |
Diesel |
LPG |
CNG |
|
0.226 |
0.167 |
0.118 |
0.697 |
Table 6: Carbon Dioxide Emissions, In Kg, Per Fuel Mass Unit
Global Carbon Emissions
Adding the carbon emissions due to the vehicle fuel consumption and electricity generation, we obtain:
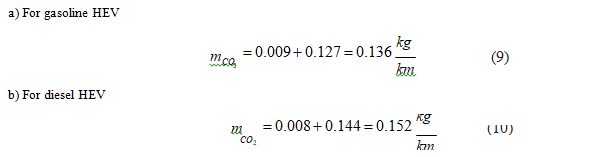
• Gasoline: Gasoline production generates 0.23 kilograms of carbon dioxide emissions per mass unit or 0.17 kilograms per volume unit [40]. Considering the gasoline vehicle average consumption rate of 0.054 L/km (Table 1), we obtain the carbon dioxide emissions associated with the gasoline production per traveled distance unit: Since the carbon dioxide emissions associated with driving are 0.127 kg/km in moderate driving mode (Table 3), the global carbon dioxide emissions in a gasoline vehicle is 0.136 kg/km.

• Diesel: Repeating the process for the diesel engine and considering the carbon dioxide emissions because of diesel production per volume unit, we obtain [41]. Retrieving the CO2 emissions associated with driving in moderate driving mode (Table 3), global carbon dioxide emissions in a diesel vehicle is 0.152 kg/km.
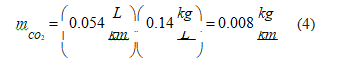
• LPG: Developing the same calculation for LPG engines, retrieving the carbon dioxide emissions because of LPG production, we have [41].

Using data for moderate driving mode (Table 3), the global carbon dioxide emissions in LPG engines is 0.101 kg/km.
• CNG: Applying the same calculation procedure for the CNG fuel:

Now, retrieving data from Table 3 for the moderate driving mode, the global CO2 emissions in CNG engines is 0.092 kg/km
HEV
The hybrid electric vehicle (HEV) charges the battery from the internal combustion engine (ICE) through an electric generator; therefore, it does not generate carbon dioxide emissions from the electricity supply. The global CO2 emissions rate is, thus, associated with driving, which for a HEV is:
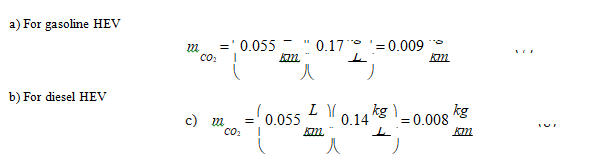
Now, retrieving the carbon dioxide emissions associated with driving (Table 3), we obtain the global carbon dioxide emissions associated with gasoline and diesel hybrid electric vehicles.
PHEV
Plug-in hybrid electric vehicle (PHEV) charges the battery from the grid; therefore, we should account for three contributions to carbon dioxide emissions: direct emissions from driving and indirect emissions associated with gasoline or diesel production and electricity generation.
Since the electricity consumption depends on the battery energy capacity, we select an average value of 21.5 kWh able to supply energy for a 107.5 km driving range at an electricity consumption rate of 200 Wh/km [42, 43].
Mathematically:

We use a gasoline PHEV because it is the current configuration.
BEV
For battery electric vehicles, considering an average electricity consumption rate of 200 Wh/km [43].

FCEV
Finally, for FCEV, the energy to decompose water for hydrogen generation depends on the developed technique, electrolysis, or reforming. In the former case, the consumption rate is 50 kWh/kg, while the second is 2 kWh/m3 or 1.512 kWh/kg.
Electrolysis requires more energy to produce the same hydrogen amount but is carbon dioxide emission-free; nevertheless, reforming needs less energy but emits carbon dioxide into the atmosphere.
Using equations 1 and 2, we notice that 4 moles of hydrogen production release 1 mole of carbon dioxide; therefore:
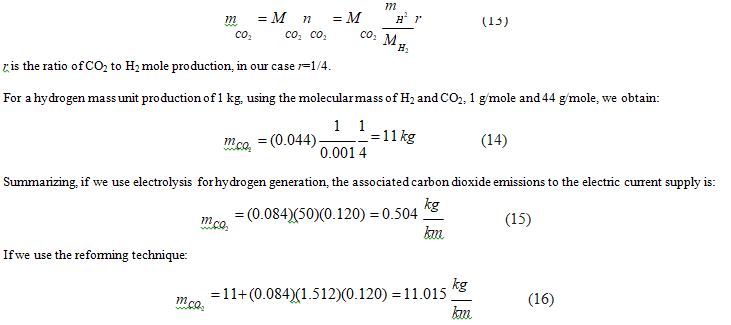
We notice that reforming method produces an excessive carbon dioxide emissions compared to electrolysis, around 22 times higher.
|
Gasoline |
Diesel |
LPG |
CNG |
HEV (g) |
HEV (d) |
PHEV |
BEV |
FCEV (e) |
FCEV (r) |
|
0.136 |
0.152 |
0.101 |
0.092 |
0.136 |
0.152 |
0.155 |
0.024 |
0.504 |
11.015 |
Table 7: Global Carbon Dioxide Emissions by Vehicle Type (Kg/Km)
FCEV (e) and FCEV (r) account for fuel cell electric vehicle with hydrogen generation by electrolysis and reforming.
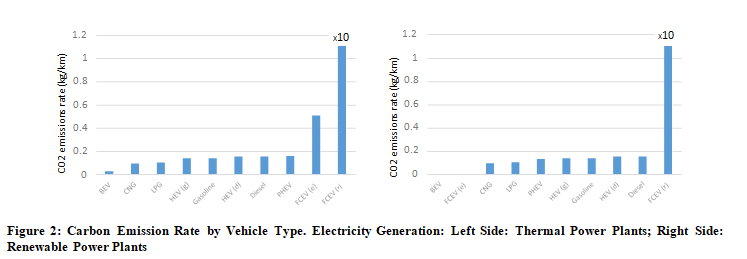
We observe that battery electric vehicles (BEVs) are the friendliest with the environment, showing a reduced carbon dioxide emissions rate. However, the fuel cell electric vehicle using a reforming technique for hydrogen production is the most pollutant. FCEV, where hydrogen generation proceeds from electrolysis, is also a pollutant system, with a carbon emissions rate 3.8 times higher than the average of ICE cars and EVs.
An alternative to reduce the environmental impact of electric vehicles is to generate electricity or hydrogen in renewable power plants like solar, wind, geothermal, hydro, or any other. In such a case, the carbon dioxide emissions are null; therefore, we should reformulate Table 7, yielding (Table 8):
|
Gasoline |
Diesel |
LPG |
CNG |
HEV (g) |
HEV (d) |
PHEV |
BEV |
FCEV (e) |
FCEV (r) |
|
0.136 |
0.152 |
0.101 |
0.092 |
0.136 |
0.152 |
0.131 |
0 |
0 |
11.015 |
Table 8: Global Carbon Dioxide Emissions by Vehicle Type (Kg/Km) With Electricity and Hydrogen Generated In Renewable Power Plants
The carbon dioxide emissions in the FCEV (r) case remain unchanged because renewable power plants cannot support the reforming
process due to the high operating temperature and the lower efficiency.
If we order the vehicle type from lowest to highest carbon emissions rate, we obtain (Figure 2):
Conclusion
The present study develops a deep analysis of the environmental impact caused by powering car fuels, including the carbon emissions due to driving and fuel production, either fossil or electricity, using conventional thermal power plants or renewable energy sources. The analysis of the carbon footprint for automobile powering fuels shows that battery electric vehicles are the most respectful of the environment, having a low carbon dioxide emission rate. On the other hand, fuel cell electric vehicles powered by hydrogen generated by the reforming process are the most pollutant system because of the carbon dioxide generation during the reforming process. Hybrid electric vehicles (HEV) and plug-in hybrid electric vehicles (PHEV) show a similar carbon footprint to cars powered by conventional fossil fuels like gasoline, diesel, LPG, and CNG because of the dependence on fossil fuels for running a high fraction of the driving range, and the carbon footprint produced in thermal power plants for the electricity generation required to charge the battery in PHEVs. This dependence vanishes when generating electricity in renewable energy plants. Fuel cell electric vehicles powered by hydrogen generated by electrolysis are the second most pollutant systems due to the associated carbon dioxide emissions in the thermal power plants when generating the electricity required for hydrogen production in the electrolyzer. This situation reduces to a null carbon footprint if the electricity is generated by renewable energy systems. The study represents an automobile industry's environmental impact faithful analysis because it applies to similar engine power for the different engine types, validating the obtained results with high reliability. The study applies to any condition, world area, or country development despite the system development for specific driving conditions and world geographical area since the study develops a comparative analysis between engine types, regardless of driving mode or reference consumption rate; therefore, if any of these two parameters change the results are identical with the only difference of the scale factor in the obtained values.
References
1. PRUSSI, M., YUGO, M., DE, P. L., PADELLA, M., & EDWARDS, R. (2020). JEC well to wheels report v5.
2. Moro, A., & Helmers, E. (2017). A new hybrid method for reducing the gap between WTW and LCA in the carbon footprint assessment of electric vehicles. The International Journal of Life Cycle Assessment, 22, 4-14.
3. Williamson, S. S., & Emadi, A. (2005). Comparative assessment of hybrid electric and fuel cell vehicles based on comprehensive well-to-wheels efficiency analysis. IEEE transactions on vehicular technology, 54(3), 856-862.
4. (2008). Gasoline. In Daintith, J. (Ed.), A Dictionary of Chemistry. : Oxford University Press. Retrieved 27 Jul. 2024.
5. (2008). Fractional distillation. In Daintith, J. (Ed.), A Dictionary of Chemistry. Oxford University Press. Retrieved 27 Jul. 2024
6. (2008). Cracking. In Daintith, J. (Ed.), A Dictionary of Chemistry. Oxford University Press. Retrieved 27 Jul. 2024
7. Ortega, E. (2021). An overview of hydrotreating. Chemical Engineering Progress, 117(10), 29-33.
8. (2008). Reforming. In Daintith, J. (Ed.), A Dictionary of Chemistry. Oxford University Press. Retrieved 27 Jul. 2024
9. Everett, D. H. (1972). Manual of symbols and terminology for physicochemical quantities and units, appendix II: Definitions, terminology and symbols in colloid and surface chemistry. Pure and Applied Chemistry, 31(4), 577-638.
10. Souza, M. M., Neto, O. R. M., & Schmal, M. (2006). Synthesis gas production from natural gas on supported Pt catalysts. Journal of Natural Gas Chemistry, 15(1), 21-27.
11. Ryu, J. H., Lee, K. Y., Kim, H. J., Yang, J. I., & Jung, H. (2008). Promotion of palladium-based catalysts on metal monolith for partial oxidation of methane to syngas. Applied Catalysis B: Environmental, 80(3-4), 306-312.
12. Occupational Safety and Health Administration. (2003). OSHA Technical Manual Section IV: Chapter 2 Petroleum Refining Processes. US Department of Labor [Web Page]. Located at http://www. osha-slc. gov/dts/osta/otm/otm_ iv_2html. Accessed: September, 24, 2003.
13. Jones, D and Treese, S 2015 Handbook of Petroleum Processing
14. Carruthers, J. E. , Waddams, . A.L. and Solomon, . Lee H. (2023, October 30). petroleum refining. Encyclopedia Britannica. https://www.britannica.com/technology/petroleum-refining
15. Lehman, C. and Selin, Noelle Eckley (2024). Biofuel. Encyclopedia Britannica.
16. Azapagic, A., & Perdan, S. (Eds.). (2011). Sustainable development in practice: case studies for engineers and scientists. John Wiley & Sons.
17. Eberle, U., Müller, B., & Von Helmolt, R. (2012). Fuel cell electric vehicles and hydrogen infrastructure: status 2012. Energy & Environmental Science, 5(10), 8780-8798.
18. Subramani, V., Sharma, P., Zhang, L., & Liu, K. (2009). Catalytic steam reforming technology for the production of hydrogen and syngas. Hydrogen and syngas production and purification technologies, 14-126.
19. Brynolf, S., Taljegard, M., Grahn, M., & Hansson, J. (2018). Electrofuels for the transport sector: A review of production costs. Renewable and Sustainable Energy Reviews, 81, 1887- 1905.
20. Shahid, M. Z., & Kim, J. K. (2023). Design and economic evaluation of a novel amine-based CO2 capture process for SMR-based hydrogen production plants. Journal of Cleaner Production, 402, 136704.
21. Di Gianfrancesco, A. (2017). The fossil fuel power plants technology. In Materials for ultra-supercritical and advanced ultra-supercritical power plants (pp. 1-49). Woodhead publishing.
22. Pilavachi, P. A., Stephanidis, S. D., Pappas, V. A., & Afgan,N. H. (2009). Multi-criteria evaluation of hydrogen and natural gas fuelled power plant technologies. Applied Thermal Engineering, 29(11-12), 2228-2234.
23. Alameri, S. A., & Alkaabi, A. K. (2020). Fundamentals of nuclear reactors. In Nuclear Reactor Technology Development and Utilization (pp. 27-60). Woodhead Publishing.
24. Reddy, V. S., Kaushik, S. C., Ranjan, K. R., & Tyagi, S. K. (2013). State-of-the-art of solar thermal power plants—A review. Renewable and Sustainable Energy Reviews, 27, 258- 273.
25. Hayat, M. B., Ali, D., Monyake, K. C., Alagha, L., & Ahmed, N. (2019). Solar energy—A look into power generation, challenges, and a solarâ?ÂÂpowered future. International Journal of Energy Research, 43(3), 1049-1067.
26. Gjengedal, T. (2005). Largeâ?ÂÂscale wind power farms as power plants. Wind Energy, 8(3), 361-373.
27. Barbier, E. (2002). Geothermal energy technology and current status: an overview. Renewable and sustainable energy reviews, 6(1-2), 3-65.
28. Killingtveit, Å. (2014). Hydroelectric power. In Future energy (pp. 453-470). Elsevier.
29. U.S Energy Information Administration, Voluntary Reporting of Greenhouse Gases Program, Carbon Dioxide Emission Factors for Transportation Fuels
30. Alessandrini, A., Cattivera, A., Filippi, F., & Ortenzi, F. (2012, August). Driving style influence on car CO2 emissions. In 2012 international emission inventory conference (pp. 1-11).
31. Meseguer, J. E., Calafate, C. T., Cano, J. C., & Manzoni, P. (2015, January). Assessing the impact of driving behavior on instantaneous fuel consumption. In 2015 12th annual IEEE consumer communications and networking conference (CCNC) (pp. 443-448). IEEE.
32. U.S Department of Energy, Office of Scientific and Technical Information, Materials for Separation Technologies. Energy and Emission Reduction Opportunities. United States.
33. Alfke, G., Irion, W.W. and Neuwirth, O.S. (2007). Oil Refining. In Ullmann’s Encyclopedia of Industrial Chemistry, (Ed.).
34. Taylor, B. N. (2007). B. 8 factors for units listed alphabetically- Section B. Guide for the use of SI Units, NIST, Academic Dictionaries and Encyclopedias.
35. Brannt, W. T. (1895). Petroleum: its history, origin, occurrence, production, physical and chemical constitution, technology, examination and uses, together with the occurrence and uses of natural gas. (No Title).
36. Red Eléctrica de España, Datos de Generación,
37. Smokers, Richard, Robin Vermeulen, Robert van Mieghem, Raymond Gense, Ian Skinner, Malcolm Fergusson, Ellie MacKay, Patrick ten Brink, George Fontaras, and Zisis Samaras. "Review and analysis of the reduction potential and costs of technological and other measures to reduce CO2- emissions from passenger cars." TNO report 6 (2006).
38. Chala, G. T., Abd Aziz, A. R., & Hagos, F. Y. (2018). Natural gas engine technologies: Challenges and energy sustainability issue. Energies, 11(11), 2934.
39. Petroleum Product Strategic Reserves Corporation. Natural Gas Import/Export.
40. Rodríguez-Antón, L. M., Hernández-Campos, M., & Sanz- Perez, F. (2013). Experimental determination of some physical properties of gasoline, ethanol and ETBE blends. Fuel, 112, 178-184.
41. Speight, J. G. (2011). Production, properties and environmental impact of hydrocarbon fuel conversion. In Advances in clean hydrocarbon fuel processing (pp. 54-82). Woodhead Publishing.
42. Noah Staats, Electric Car Batteries Versus PHEV Batteries: The Differences Explained. TOPSPEED. Published December 26, 2023.
43. How much electricity does an electric car use? EVBOX.